A Larger and More Profitable Equipment Franchise, Not Yet a Cash-Generative Platform
Earnings Reports
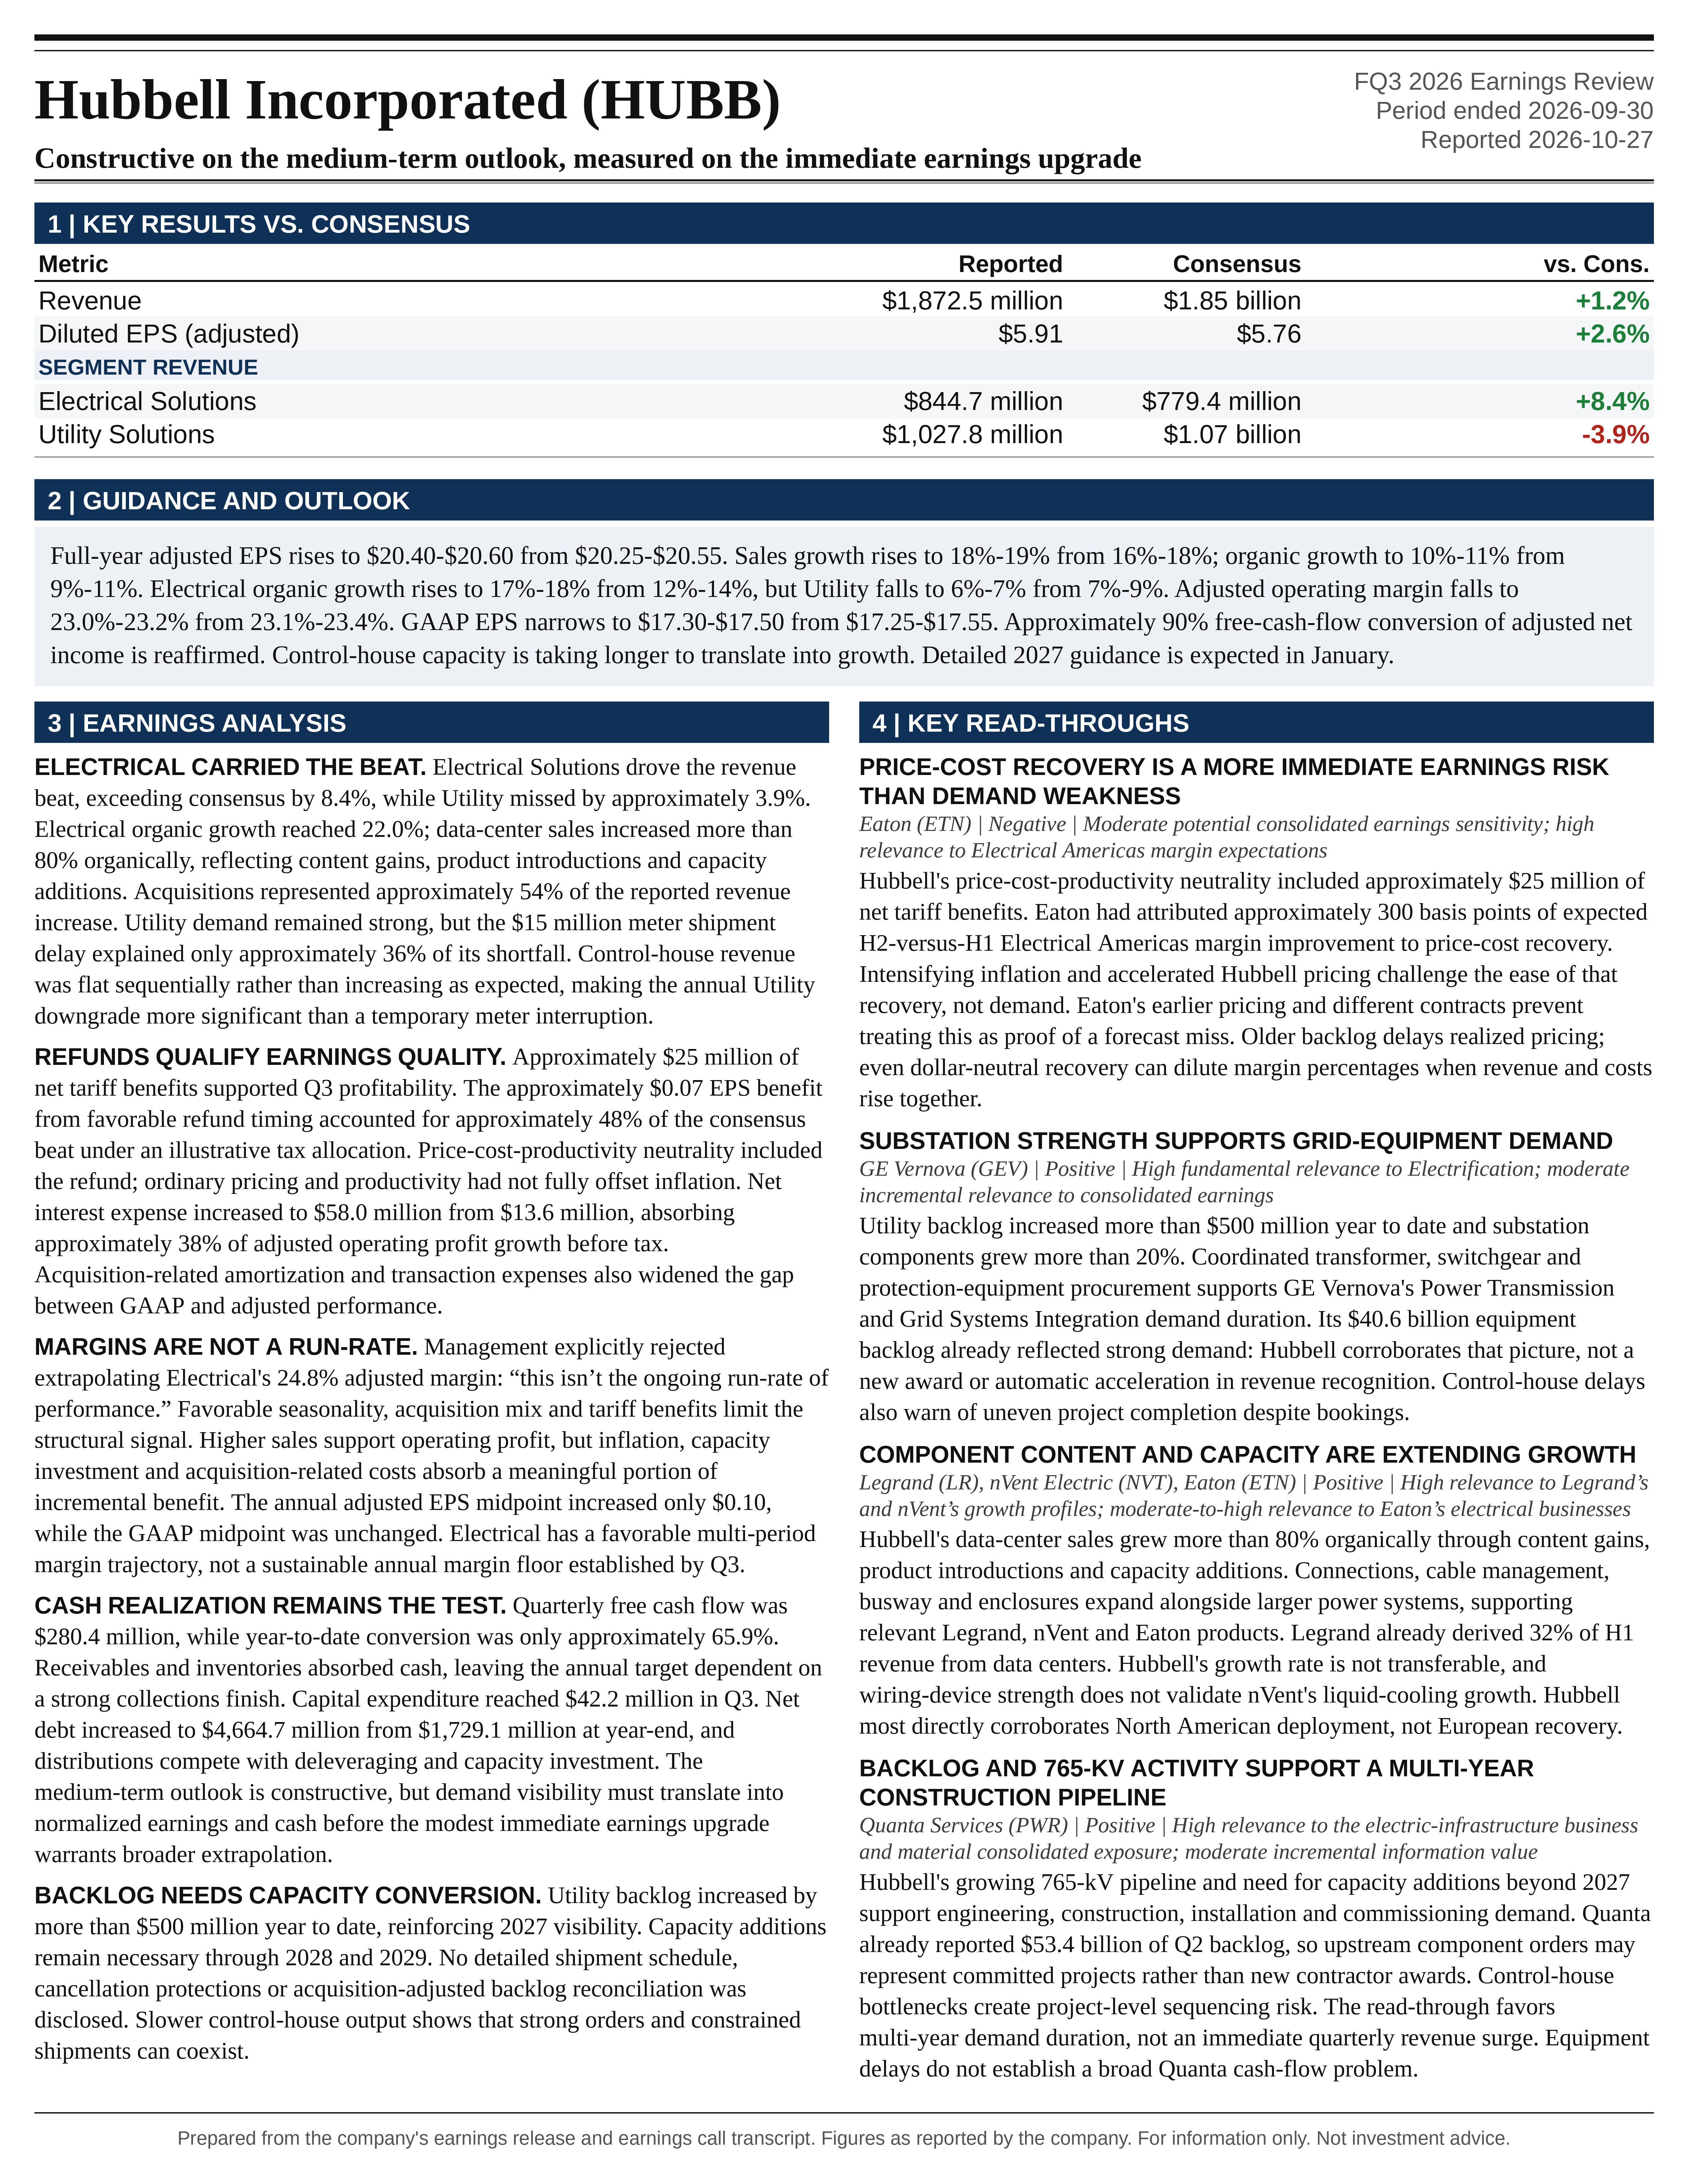
Hubbell Incorporated FQ3 2026 Earnings Report
Hubbell Incorporated (HUBB) FQ3 2026 earnings: Constructive on the medium-term outlook, measured on the immediate earnings upgrade. Full earnings analysis, key read-throughs, and the one-page exhibit from Atlas Peak Research.
Hubbell Incorporated (HUBB)
Sector: Industrials · FQ3 2026 · Period end September 30, 2026 · Reported October 27, 2026
Hubbell’s Q3 2026 results strengthened the medium-term growth thesis but provided a more qualified near-term earnings signal than the headline results suggest. Electrical Solutions delivered exceptional organic growth, accelerating data-center penetration and substantial adjusted margin expansion.
Download the one-page report (PDF)
View one-page exhibit
Download analysis (.md)
Download read-throughs (.md)
Post to X
One-Page Exhibit
Earnings Analysis
EXECUTIVE CALL SUMMARY: Hubbell Incorporated (10/27/26)
Hubbell’s Q3 2026 results strengthened the medium-term growth thesis but provided a more qualified near-term earnings signal than the headline results suggest. Electrical Solutions delivered exceptional organic growth, accelerating data-center penetration and substantial adjusted margin expansion. Utility demand remained strong, with backlog increasing by more than $500 million year to date, but capacity constraints and a meter-component shortage prevented demand from translating fully into revenue. The central investment distinction is between increasingly attractive demand visibility and less consistent execution, underlying margin conversion and cash realization.
Revenue of $1,872.5 million increased 24.6%, adjusted operating profit of $476.8 million increased 33.0%, and adjusted EPS of $5.91 increased 14.3%. Against the supplied Bloomberg consensus, revenue exceeded expectations by approximately 1.2% and adjusted EPS by 2.6%. However, the revenue beat was concentrated in Electrical Solutions, which exceeded consensus by 8.4%, while Utility Solutions missed by approximately 3.9%. A favorable tariff-refund timing difference contributed an estimated $0.07 to Q3 EPS, accounting for approximately 48% of the $0.15 consensus beat under an illustrative tax allocation. The quarter was operationally strong, but the magnitude of sustainable earnings outperformance was smaller than the headline surprise.
The full-year outlook also requires qualification. Adjusted EPS guidance increased from $20.25-$20.55 to $20.40-$20.60, lifting the midpoint by only $0.10, or 0.5%. The new $20.50 midpoint was essentially aligned with Bloomberg consensus of $20.48. Meanwhile, the adjusted operating margin outlook declined from 23.1%-23.4% to 23.0%-23.2%, and the GAAP EPS midpoint remained unchanged at $17.40. Higher sales are producing higher operating profit, but inflation, investment spending and acquisition-related costs are absorbing a meaningful portion of the incremental benefit.
The most favorable development was the combination of stronger Electrical Solutions execution and improving 2027 visibility across transmission, substations and data centers. The principal caution is that Q3 profitability benefited from favorable seasonality, acquisition mix and approximately $25 million of net tariff-related benefits. Management explicitly rejected annualizing the Electrical Solutions margin: “this isn’t the ongoing run-rate of performance.” The appropriate investment interpretation is a constructive medium-term operating outlook, accompanied by restraint in extrapolating Q3 margins or treating the modest annual EPS increase as a broad earnings upgrade.
QUARTERLY PERFORMANCE AND HISTORICAL CONTEXT
Hubbell’s reported revenue increase of $370.1 million comprised $169.3 million of organic growth, $198.8 million from acquisitions and $2.0 million from currency. Organic growth was 11.3%, acquisition contribution was 13.2 percentage points, and currency contributed approximately 0.1 percentage point. Acquisitions therefore represented approximately 54% of the reported revenue increase. The distinction matters because the 25% headline growth rate materially overstates the growth rate of the established business, although underlying organic performance was independently strong.
Organic growth accelerated from approximately 10% in Q2 2026 and 3.2% in Q3 2025. Electrical Solutions organic growth increased from approximately 18% in Q2 to 22.0% in Q3, versus 8.3% in Q3 2025. Utility Solutions organic growth was 4.9%, versus approximately 6% in Q2 and 0.5% in Q3 2025. Consequently, the year-over-year recovery remained broad, but sequential momentum diverged between the segments. Electrical Solutions supplied approximately 73% of consolidated organic revenue growth and 79% of the increase in adjusted operating profit.
Adjusted operating profit increased by $118.4 million on $370.1 million of additional revenue, producing a reported incremental operating margin of approximately 32.0%. That exceeded management’s standing 25%-30% incremental-margin framework. However, acquisitions and the tariff-refund benefit materially affected the comparison, making it inappropriate to interpret the 32.0% figure as a clean measure of organic factory leverage.
The year-to-date results corroborate the broader improvement. Revenue increased to $5,101.0 million from $4,351.9 million, adjusted operating profit increased to $1,186.0 million from $976.1 million, and adjusted EPS increased to $15.37 from $13.48. Adjusted operating margin expanded to 23.3% from 22.4%. Organic revenue growth was approximately 9.9%, with Electrical Solutions growing 17.2% and Utility Solutions 5.7%. These results establish that Q3 strength was not isolated, while also showing that Electrical Solutions increasingly carries the consolidated growth acceleration.
The distinction between GAAP and adjusted performance widened substantially. GAAP operating profit increased 23.6%, but GAAP operating margin declined to 21.8% from 22.0%. GAAP EPS increased only 3.6%, to $4.94 from $4.77, compared with 14.3% adjusted EPS growth. Acquisition-related amortization and transaction expenses explain the divergence. This is consistent with the accounting effects of the acquisition strategy, but it reinforces the need to evaluate returns on acquired capital rather than relying exclusively on adjusted EPS accretion.
EARNINGS QUALITY, TARIFF REFUNDS AND THE EPS BRIDGE
The tariff discussion was among the most consequential parts of the call. Hubbell received approximately $30 million of IEEPA tariff refunds in Q3. Management had expected approximately $10 million of customer considerations and related offsets in the same quarter, but only approximately $5 million was recognized, with the remaining $5 million moving into Q4. The resulting Q3 net benefit was approximately $25 million rather than the previously anticipated $20 million.
Removing that $25 million benefit from reported adjusted operating profit produces an analytical Q3 operating profit of approximately $451.8 million and an operating margin of approximately 24.1%. This compares with the prior-year reported adjusted margin of approximately 23.9%. Accordingly, the net tariff benefit represented approximately 134 basis points of the reported 160-basis-point margin expansion. This calculation is not a company-reported measure or a comprehensive tariff-neutral restatement. It isolates the disclosed benefit while leaving other pricing, tariff costs, mix and acquisition effects unchanged.
On the same basis, the incremental operating margin falls from approximately 32.0% to 25.2%, close to the lower end of management’s long-term framework. That remains respectable operating conversion, but it is materially different from interpreting Q3 as a structural step-up to incremental margins above 30%. Restructuring and related costs also declined to $2.7 million from $6.7 million, providing another $4.0 million of comparative benefit. The combination of refunds and lower restructuring spending explains much of the apparent margin acceleration, although the underlying contribution from higher volumes and favorable product mix remained positive.
Using the quarter’s approximately 23.5% adjusted effective tax rate and 53.1 million diluted shares, the $25 million net benefit equates to approximately $0.36 per share. Removing it would reduce adjusted EPS from $5.91 to approximately $5.55, still approximately 7% above the prior-year reported $5.17. This is an illustrative normalization, not a revised reported result. Importantly, the entire $0.36 should not be deducted when evaluating the consensus surprise because the anticipated $20 million benefit had already been discussed on the Q2 call.
The more relevant surprise adjustment is the $5 million timing benefit, worth approximately $0.07 per share under the same assumptions. This explains approximately 48% of the $0.15 EPS beat without implying that all remaining outperformance was operational. The actual adjusted tax rate of approximately 23.5% was also modestly below management’s prior expectation of approximately 24% for Q3. The supplied consensus does not disclose its tax assumptions, preventing a precise attribution of the remaining EPS surprise.
Management’s statement that price-cost-productivity was approximately neutral in Q3 expressly included the net tariff benefit. On a simple subtraction basis, the underlying equation excluding that benefit was therefore approximately $25 million negative. This does not mean pricing initiatives failed, since the company faced continuing inflation and timing lags. It does mean that Q3 did not demonstrate fully self-sustaining price-cost-productivity neutrality without the refund.
Higher financing costs and taxes explain why adjusted EPS growth lagged adjusted operating profit growth so sharply. Net interest expense increased to $58.0 million from $13.6 million. The $44.4 million increase absorbed approximately 38% of the $118.4 million increase in adjusted operating profit before tax. The adjusted effective tax rate increased from approximately 18.0% to 23.5%, further reducing earnings conversion. Diluted shares declined from 53.4 million to 53.1 million, providing only a modest offset.
FULL-YEAR GUIDANCE: STRONGER SALES, LOWER MARGIN EXPECTATIONS
The October outlook increased total sales growth to 18%-19% from 16%-18% in July. Organic sales growth increased to 10%-11% from 9%-11%. The consolidated organic midpoint therefore increased by 0.5 percentage point, while the reported sales-growth midpoint increased by 1.5 percentage points. Both stronger underlying demand and acquisition contribution supported the revision.
The segment changes were considerably larger than the consolidated adjustment. Electrical Solutions organic growth guidance increased from 12%-14% to 17%-18%, lifting the midpoint by 4.5 percentage points. Utility Solutions guidance declined from 7%-9% to 6%-7%, reducing the midpoint by 1.5 percentage points. Characterizing the utility revision as merely “slight” understates its significance relative to the previous expected growth rate. Electrical strength more than offset the reduction, but the consolidated raise concealed a meaningful deterioration in expected utility revenue conversion.
The margin revision is equally important. The full-year adjusted operating margin midpoint declined by 15 basis points, from 23.25% to 23.10%. Applying the growth and margin midpoints to 2025 revenue of $5,844.6 million produces an illustrative increase in expected 2026 revenue from approximately $6,838 million to $6,926 million, while expected adjusted operating profit increases from approximately $1,590 million to $1,600 million. Thus, approximately $88 million of additional revenue translates into only approximately $10 million of additional operating profit.
That approximately 11.4% incremental margin applies to the revision between the July and October forecasts, not to year-over-year business growth. It is well below the 25%-30% long-term incremental framework and demonstrates how inflation and investment spending are absorbing the benefit of the stronger sales outlook. Because the calculations use rounded guidance midpoints, they should be treated as directional reconciliations rather than precise internal forecasts.
Adjusted EPS guidance increased by $0.15 at the low end and $0.05 at the high end, narrowing the range to $20.40-$20.60. Relative to 2025 adjusted EPS of $18.21, the new range implies approximately 12.0%-13.1% growth. The $20.50 midpoint is only $0.02 above the supplied $20.48 consensus, making the guidance broadly consistent with expectations rather than a material positive surprise.
GAAP EPS guidance moved from $17.25-$17.55 to $17.30-$17.50, leaving the midpoint unchanged. Expected acquisition-related amortization remained approximately $2.50 per share, while expected transaction, integration and separation costs increased from approximately $0.50 to $0.60 per share. The additional $0.10 of excluded costs offsets the $0.10 increase in adjusted EPS at the midpoint. Accordingly, the annual upgrade is an improvement in adjusted profitability, not an increase in the central GAAP earnings forecast.
The adjusted tax-rate outlook remained 22.0%-22.5%, and free-cash-flow conversion remained approximately 90% of adjusted net income. Management also stated that below-the-line assumptions were unchanged. These unchanged assumptions support attributing the adjusted EPS increase primarily to the operating outlook rather than a newly favorable financing or tax forecast.
Compared with the initial February outlook, organic growth has improved substantially from 5%-7% to 10%-11%, and the adjusted EPS midpoint has increased from $19.50 to $20.50. However, the NSI acquisition was not included in the initial outlook, so the full-year guidance progression is not entirely like-for-like. The improvement reflects a combination of stronger established-business performance and a larger acquired earnings base.
WHAT THE GUIDANCE IMPLIES FOR Q4
The updated annual revenue outlook implies approximately $1,796-$1,854 million of Q4 revenue after subtracting the reported $5,101 million of year-to-date sales. This represents approximately 20%-24% growth from Q4 2025 revenue of $1,492.7 million. At the midpoint, revenue would be approximately $1,825 million, below Q3 sequentially but materially higher year over year.
Combining the annual revenue and margin midpoints implies approximately $414 million of Q4 adjusted operating profit and an adjusted operating margin of approximately 22.7%. That compares with 23.4% in Q4 2025 and 25.5% in Q3 2026. These are mechanical implications rather than separately issued quarterly guidance. They nevertheless confirm that the forecast embeds meaningful year-over-year margin pressure despite strong sales growth.
The EPS arithmetic gives a similar signal. Subtracting year-to-date adjusted EPS of $15.37 from annual guidance implies approximately $5.03-$5.23 for Q4, compared with $4.73 in Q4 2025. The midpoint implies approximately 8.5% growth, below Q3’s 14.3% growth rate. Quarterly and annual EPS do not reconcile perfectly because of weighted-average share-count differences, but the approximation is sufficiently close to establish the directional deceleration.
If the supplied annual and quarterly Bloomberg estimates are treated as a consistent pre-release snapshot, they imply approximately $5.26 of Q4 EPS: $20.48 annual consensus less $9.46 of reported H1 EPS and $5.76 of Q3 consensus. The new mechanically implied Q4 midpoint of $5.13 is approximately 2.5% below that figure. This is not a separately verified Q4 consensus estimate, but it indicates that the annual guidance increase does not fully carry forward the Q3 earnings beat.
Management identified several reasons for the Q4 margin pressure, particularly in Utility Solutions: inflation, the margin-rate dilution associated with dollar-neutral price-cost recovery, capacity and product-development spending, and the deferred $5 million of customer considerations. Dollar-neutral recovery protects operating profit dollars but does not necessarily preserve the operating margin percentage when price increases enlarge the revenue denominator.
ELECTRICAL SOLUTIONS: THE STRONGEST OPERATING SIGNAL
Electrical Solutions generated $844.7 million of revenue, increasing 51.2% from $558.6 million. Organic growth contributed 22.0 percentage points, while acquisitions contributed 29.1 percentage points. Against Bloomberg consensus of $779.4 million, the segment exceeded expectations by $65.3 million. The established business was independently strong, while NSI substantially enlarged the revenue and profit base.
Adjusted operating profit increased 80.4%, to $209.5 million from $116.1 million, and adjusted operating margin expanded to 24.8% from 20.8%. Electrical Solutions now represented approximately 45% of consolidated revenue and 44% of adjusted operating profit. The segment is increasingly important to consolidated earnings, reducing historical dependence on Utility Solutions while increasing exposure to data-center, industrial and distribution-channel dynamics.
Data-center sales increased more than 80% organically, following approximately 65% growth in Q2. Management attributed the acceleration to content gains, new product introductions and capacity additions, particularly in wiring devices and Pin & Sleeve products. This is stronger evidence of company-specific execution than a statement that data-center construction alone is expanding. Hubbell appears to be capturing more component opportunities within its addressable applications while removing production bottlenecks.
However, the call did not disclose an independent market-growth benchmark, revenue per megawatt, customer concentration or a quantified share-gain bridge. Consequently, the precise division between end-market growth, greater content per installation and competitive share gains remains unresolved. The evidence supports outperformance, but not a precise estimate of its sources or durability.
Management expects data centers to represent approximately 15% of Electrical Solutions revenue exiting 2026. The initial reference to 30% was immediately corrected and should not be retained. The 15% figure is an exit-period segment exposure, not a consolidated revenue percentage or a full-year recognized revenue share. Applying the current segment weight solely as an illustration would translate into approximately 7% of consolidated revenue, although the actual exit-period consolidated mix was not disclosed.
That direct exposure understates Hubbell’s broader economic sensitivity to data-center investment because Utility Solutions also benefits from transmission, substations and interconnections required to serve new loads. Conversely, the direct and indirect exposures should not be treated as independent sources of diversification. A substantial slowdown in data-center development could affect both segments through different channels and timing.
The margin opportunity extends beyond data centers. Management described segment unification, a broader commercial organization, cross-selling, channel conversions, portfolio management, business simplification, management delayering and new products as continuing drivers. The description of the program as being in the “middle innings” indicates that management does not view the benefits as exhausted. NSI expands the product set available for these initiatives.
Nevertheless, Q3 is seasonally the strongest revenue and margin quarter, and NSI changes the mix of the segment. The 24.8% adjusted margin also includes an undisclosed allocation of the net tariff benefit. The more defensible conclusion is that Electrical Solutions has a favorable multi-period margin trajectory, not that 25% has become a sustainable annual margin floor.
Outside data centers, light industrial demand remained strong, electrical T&D and renewables grew strongly, and nonresidential demand was solid. Heavy industrial demand remained relatively soft. The strength is therefore broader than a single end market, but it is not evidence of a uniform industrial recovery.
UTILITY SOLUTIONS: DEMAND REMAINS STRONG, CONVERSION DISAPPOINTS
Utility Solutions revenue increased 8.9%, to $1,027.8 million from $943.8 million. Organic growth was 4.9%, acquisitions contributed 3.8 percentage points, and currency contributed approximately 0.2 percentage point. Adjusted operating profit increased 10.3%, to $267.3 million, with margin expanding to 26.0% from 25.7%.
The segment missed the supplied $1.07 billion consensus by approximately $42.2 million. The $15 million meter-revenue shift explains approximately 36% of that shortfall. Adding the delayed revenue back would produce approximately $1,042.8 million of sales, still approximately 2.5% below consensus. The shortage was material, but it was not a complete explanation for the revenue disappointment.
On an approximate same-base calculation, restoring the delayed $15 million would lift utility organic growth from 4.9% to approximately 6.5%. This supports the interpretation that the quarter’s underlying demand was stronger than the reported growth rate, while also indicating that performance would not have been extraordinary without the interruption.
Grid Infrastructure grew 8% organically, with strength across distribution and transmission. The earnings release’s approximately 13% Grid Infrastructure growth figure is a reported-sales measure that includes acquisition effects and should not be confused with the call’s organic growth rate. Protection and Controls delivered growth above 10%, led by substation switching products and supported by recent capacity additions.
Substation performance was more nuanced. Management indicated that the substation portfolio represents approximately 20% of Utility Solutions, divided approximately equally between components and modular control houses. Components such as connectors, bushings, arresters and switches grew more than 20%, supported by successful capacity expansion. Control-house revenue, by contrast, was flat sequentially from Q2 to Q3 rather than increasing as previously expected.
That difference is operationally significant. Adding machines to produce standardized components is not equivalent to expanding the output of engineered modular control houses. The latter can require additional space, labor coordination, systems integration and project-specific execution. Strong bookings do not automatically become shipments at the intended pace when a production system is being scaled.
Management presented the control-house issue as a delayed ramp rather than lost demand. That interpretation is supported by the backlog commentary, but it remains dependent on subsequent execution. If utilities require delivery within a fixed project schedule, extended capacity delays could eventually affect customer confidence or competitive positioning. No quantified lost-order evidence was disclosed, so the risk should not be treated as an observed outcome.
The annual guidance reduction also cannot be explained solely by a meter shipment moving from Q3 to Q4. A complete within-year recovery would be neutral to full-year revenue. The utility downgrade therefore makes the slower control-house capacity ramp, and any other execution or timing differences, more important than the temporary meter interruption alone.
METERS AND GRID AUTOMATION: RECOVERY SHOULD NOT BE CONFUSED WITH STRUCTURAL ACCELERATION
Grid Automation revenue declined 4% organically. Management attributed the weakness primarily to a component unavailable to its meter contract manufacturer, describing the event as “a very discrete and unforeseen situation.” Production had returned to normal by the call, and management expected the delayed approximately $15 million of revenue to be recovered in Q4.
The expected Q4 growth above 10% in Grid Automation is therefore partly a shipment-timing effect. It should not be interpreted automatically as evidence of a sustained acceleration in the underlying meter and AMI business. The appropriate assessment is the combined H2 trajectory after neutralizing the Q3-to-Q4 movement.
Management described a narrower strategic focus on electric meters, municipal utilities, cooperatives and the existing AMI installed base, together with structural cost reduction. The objective is modest growth and improved margins rather than a return to rapid expansion. The meters and AMI exposure discussed in this context is expected to represent less than 10% of Utility Solutions revenue exiting 2026 and a substantially smaller percentage of operating profit.
That diminishing weight reduces the business’s capacity to destabilize consolidated earnings. However, it does not eliminate supplier concentration, product availability or competitive risks. The broader Grid Automation category should also not be treated as synonymous with meters, since Protection and Controls was a distinct source of strength.
BACKLOG, CAPACITY AND THE 2027 REVENUE OPPORTUNITY
Utility backlog increased by more than $500 million year to date and was approximately 30% above the beginning-of-year level. Management clarified that the increase extended across both Grid Infrastructure and Grid Automation. This is a stronger forward indicator than general commentary about attractive markets because it reflects orders already entering the business.
The backlog evidence is consistent with the Q2 disclosure of an approximately 1.2x H1 Utility Solutions book-to-bill ratio. At that time, management also indicated that transmission and substation orders were extending into 2027. Q3 therefore reinforced an existing visibility trend rather than introducing an entirely new backlog thesis.
Nevertheless, backlog is not equivalent to guaranteed near-term revenue. The call did not provide a detailed shipment schedule, cancellation protections, customer concentration, pricing-reset provisions or an acquisition-adjusted backlog reconciliation. Backlog can increase because orders are strong, because shipments are constrained, or because both are occurring simultaneously. Hubbell’s control-house commentary indicates that both factors matter.
Management described capacity coming online at approximately $25 million per quarter in 2026, increasing to approximately $50 million per quarter in 2027. In context, these figures appear to describe revenue-enabling capacity rather than capital-expenditure spending. However, the draft does not fully define whether the figures represent newly commissioned run-rate capacity, actual quarterly revenue enabled, or another convention. A precise 2027 revenue forecast should not be constructed by mechanically annualizing them.
The distinction between capacity and capital spending is important because actual Q3 capital expenditures were $42.2 million and year-to-date expenditures were $119.8 million. Management’s capacity discussion is not evidence that capital expenditure itself will double in 2027.
Most capacity additions involve incremental machines and assembly lines within existing facilities, with selected building extensions when existing space is exhausted. This staged approach can reduce the risk of committing to a large facility before demand is sufficiently established. It also means the company must execute continuously rather than complete a single expansion that satisfies several years of demand.
Management explicitly indicated that capacity added in 2027 would not solve the entire multi-year requirement, with further investment needed for 2028 and 2029. This supports a durable opportunity but also means elevated investment and execution demands are likely to persist. High demand visibility does not remove the need for working capital, engineering expenditure, labor development and disciplined production scheduling.
The assertion that these projects offer the company’s highest investment returns is directionally credible given their incremental nature and placement in high-margin product categories. However, project-level capital requirements, utilization assumptions, payback periods and realized returns were not disclosed. Accretion to overall ROIC remains a management expectation rather than a quantitatively demonstrated result.
765-KV TRANSMISSION: A LONGER-DURATION OPPORTUNITY
The 765-kV discussion provided a credible longer-term growth avenue. Management indicated that an initial project would begin shipping around the end of 2026 and into 2027, with a growing pipeline behind it. Hubbell’s existing positions in transmission and substation components provide a relevant technological and commercial starting point.
The near-term financial effect includes engineering, testing and product-qualification spending before meaningful revenue recognition. Some testing can be performed internally, while other requirements involve external providers. These expenditures help explain why current margins can face pressure even as future opportunities improve.
Management did not claim that 765-kV systems would produce materially higher market share than Hubbell’s existing transmission and substation businesses. The opportunity is therefore better framed as participation in a larger and more technically demanding investment cycle, rather than an established step-change in competitive share. Qualification progress, actual project releases and shipment timing will determine the earnings contribution.
NSI AND DMC POWER: STRATEGIC FIT VERSUS FINANCIAL RETURN
NSI is central to the stronger Electrical Solutions results. The acquisition closed on 06/09/26 for approximately $3.0 billion and was financed through a $900 million term loan, $1.9 billion of senior notes and commercial paper. Its fittings, connectors, components and wire-management products complement Hubbell’s existing portfolio and distribution relationships.
The original acquisition announcement anticipated approximately $570 million of 2026 revenue and valued the transaction at approximately 15.5x anticipated 2026 EBITDA. Those figures imply approximately $194 million of anticipated EBITDA and an approximately 34% EBITDA margin. The financial profile explains why NSI can be accretive to Hubbell’s adjusted operating margins, but an acquired EBITDA margin is not equivalent to a post-financing return on invested capital.
The Q2 call established expected adjusted EPS accretion of approximately $0.20 in 2026 and $0.80 in 2027, together with targeted sales synergies of 2%-3% and cost synergies of 3%-5% over approximately 3 years. Q3’s statement that performance and integration are ahead of initial expectations is encouraging, but the call did not provide a revised quantified synergy schedule or acquisition-specific EPS forecast.
The $0.80 of previously expected 2027 accretion should not simply be added to the 2026 EPS base. Relative to the original $0.20 contribution expected in 2026, the year-over-year increase would be approximately $0.60, before any revisions. Financing and deleveraging assumptions embedded in those forecasts must also be considered before adding separate interest savings.
DMC Power strengthens Hubbell’s connector and tooling position in high-voltage substations and transmission. The original $825 million transaction announcement anticipated approximately $130 million of 2026 revenue and $60 million of EBITDA, implying an approximately 46% EBITDA margin and a purchase multiple of approximately 13.8x anticipated EBITDA. These were transaction-date forecasts, not current realized standalone results.
DMC’s results enter the organic comparison beginning in Q4 2026. Management expects its underlying growth to raise the Utility Solutions organic growth rate. This is a reporting-perimeter transition, not an additional revenue event. Once the acquisition anniversaries, DMC’s own comparable-period growth enters the organic calculation; the acquisition contribution should not also be added separately.
The strategic fit of both acquisitions is strong. The more demanding investment test is whether organic growth, synergies and cash generation produce adequate returns after financing costs and the capital deployed. Q3 supports operating-margin accretion but also demonstrates how acquisition debt can materially dilute the translation of operating profit growth into EPS.
CASH FLOW, WORKING CAPITAL AND DELEVERAGING
Q3 operating cash flow increased to $322.6 million from $284.3 million. Capital expenditure increased to $42.2 million from $30.5 million, leaving free cash flow of $280.4 million versus $253.8 million. Free cash flow increased approximately 10.5%, below adjusted net income growth of approximately 13.6%. Quarterly cash conversion declined to approximately 89.2% from 91.8%.
Year-to-date free cash flow increased to $539.2 million from $485.9 million, but conversion against adjusted net income was only approximately 65.9%, versus 67.2% in the prior-year period. The annual 90% target therefore requires a substantial Q4 cash contribution.
Using the $20.50 EPS midpoint and approximately 53.1 million diluted shares gives an illustrative annual adjusted earnings base of approximately $1.09 billion. Applying 90% conversion implies approximately $980 million of annual free cash flow and roughly $440 million in Q4. The estimate excludes minor share-allocation differences, but it captures the scale of the remaining requirement.
That approximately $440 million Q4 requirement would be around 13% above Q4 2025 free cash flow of $388.8 million. It would also exceed implied Q4 adjusted earnings substantially. Historical seasonality makes this less alarming than the year-to-date conversion rate alone suggests: Q4 2025 represented approximately 44% of full-year free cash flow. Nevertheless, achieving the target depends on a strong finish in collections and working-capital conversion while capital investment remains elevated.
The cash-flow statement identifies meaningful working-capital absorption. Year-to-date receivables consumed $253.1 million and inventories consumed $148.4 million, partly offset by $79.5 million from payables. The combined trade-working-capital outflow was approximately $322 million, compared with $196.5 million a year earlier. Other liability movements provided offsets, but the increased investment in receivables and inventory is economically significant. These cash-flow changes are presented net of acquisitions and cannot be dismissed solely as acquired balance-sheet additions.
The tariff refund also complicates the interpretation of cash growth. Gross refund receipts of approximately $30 million exceeded the $26.6 million year-over-year increase in Q3 free cash flow. This does not justify mechanically subtracting $30 million to create a fully normalized measure, because tax effects and customer-consideration cash timing were not reconciled. It does establish that reported cash-flow growth is not a clean measure of recurring operating improvement.
Net debt increased to $4,664.7 million at September 30 from $1,729.1 million at December 31, primarily reflecting NSI financing. Total debt was $5,120.2 million, and net debt to total capital increased to approximately 51% from 28%. The business has substantial earnings and cash-generation capacity, but the balance sheet is materially more leveraged than before the acquisition.
Management reiterated a commitment to deleveraging over approximately 2 years. The opportunity for EPS improvement is meaningful: retiring $500 million of debt at an illustrative 5% borrowing cost would save approximately $25 million of annual pretax interest, or approximately $0.37 per share after a 22.25% tax rate. Actual benefits depend on financing terms and repayment timing and would be lower during a gradual repayment year.
Year-to-date dividends of $225.4 million and repurchases of $203.5 million absorbed approximately $429 million of the $539 million of free cash flow. Consequently, future debt reduction competes with shareholder distributions and capacity investment for cash. The modest share-count decline in Q3 suggests that deleveraging, rather than aggressive repurchases, is the more relevant potential earnings support from capital allocation.
2027 OUTLOOK: ATTRACTIVE, BUT NOT FORMAL NUMERICAL GUIDANCE
Management’s preliminary framework called for organic growth at least consistent with its standing mid-single-digit objective, price-cost-productivity “neutral to dollar positive,” and incremental margins of 25%-30%. This is a constructive setup rather than formal 2027 guidance. A detailed outlook is expected in January.
Pricing execution is a central condition. Electrical price increases are being accelerated into November 2026, while utility pricing is planned around year-end and the beginning of 2027. Management identified both normal annual pricing and higher inflation as reasons for the actions. The explicit need for additional pricing indicates that the 2027 margin framework is not already secured by measures fully realized in Q3.
Utility price realization is also delayed by backlog conversion. July pricing actions were still flowing through the business during H2. Strong backlog improves revenue visibility but can slow the benefit of repricing if older orders carry earlier commercial terms. The resulting lag between cost inflation and price realization is an important source of quarterly volatility.
Electrical pricing ahead of the usual annual cycle creates a separate monitoring issue. Distributor purchases could be accelerated ahead of increases, potentially supporting Q4 orders or shipments while creating a more difficult Q1 comparison. The call did not establish that such advance purchasing had occurred. It is a risk to monitor rather than a conclusion about current demand quality.
The principal positive 2027 drivers are backlog conversion, additional capacity, continued data-center content gains, NSI’s full-year contribution, segment-unification benefits and debt reduction. Offsets include the absence of the disclosed 2026 net tariff benefit, ongoing inflation, investment spending and more difficult growth comparisons.
Assuming the full-year disclosed refund-related benefit is approximately $20 million after customer considerations, its absence would create an approximately $0.29 EPS comparison headwind at the current annual tax and share assumptions. That is manageable against the growth opportunities but should be explicitly incorporated rather than treating all 2026 adjusted earnings as recurring.
ILLUSTRATIVE EARNINGS SCENARIOS AND SENSITIVITIES
A base case with a 55% probability assumes 2027 organic growth of approximately 6%-8%, incremental margins of 25%-30%, continued but moderating data-center growth, gradual improvement in control-house output, and price-cost-productivity around neutrality. Allowing for NSI’s incremental contribution and the tariff-benefit comparison produces an illustrative adjusted EPS range of approximately $22.30-$23.50. Confidence is moderate, with capacity conversion and pricing realization the most important variables.
A bull case with a 25% probability assumes approximately 10%-12% organic growth, faster deployment of transmission and substation capacity, sustained data-center content gains, NSI synergy delivery above the original trajectory and incremental margins around 30%-35%. An illustrative adjusted EPS range of approximately $24.00-$25.50 is plausible under those conditions. This case requires both strong demand and execution; backlog growth alone is insufficient.
A bear case with a 20% probability assumes approximately 0%-3% organic growth, further project delays, slower data-center investment, persistent control-house constraints or weaker pricing recovery. Reduced operating leverage, adverse mix and slower deleveraging could constrain adjusted EPS to approximately $19.50-$21.50 despite acquisition carryover benefits. This outcome does not require a collapse in utility investment. Modest shipment growth combined with margin pressure would be sufficient.
These are analytical scenarios, not company guidance. Their midpoint-weighted EPS is approximately $22.90, around 12% above the 2026 guidance midpoint. The probability-weighted result supports continued earnings growth, but it does not establish a stock-return expectation without a verified valuation.
At approximately $6.93 billion of revenue, a 100-basis-point change in operating margin is worth roughly $69 million of operating profit, or approximately $1.01 per share after tax using the current share base. An additional $100 million of revenue converted at 25%-30% incremental margins is worth approximately $0.37-$0.44 per share. These sensitivities explain why a relatively modest margin disappointment can offset a substantial revenue beat.
INVESTMENT IMPLICATIONS, CATALYSTS AND THESIS INVALIDATION
The quarter supports Hubbell’s position as a critical-component supplier benefiting from infrastructure replacement, grid investment, electrification and data-center expansion. Specification requirements, established brands, installed relationships and product reliability can support durable customer positions. The strongest evidence of incremental value creation is the combination of organic Electrical Solutions growth, successful capacity additions in selected product categories and the widening set of commercial opportunities from NSI.
The earnings event does not support treating Hubbell as a direct proxy for aggregate AI capital expenditure. Its exposure spans smaller electrical components, industrial channels, utility projects and grid infrastructure, each with different revenue timing and constraints. Data-center growth can improve the opportunity set without translating proportionately or immediately into Hubbell revenue.
Portfolio diversification should also be evaluated carefully. Hubbell may diversify product exposure relative to semiconductor, server, cooling or large electrical-equipment holdings, but it retains common economic exposure to data-center spending, utility capital budgets and the electrification investment cycle. Direct data-center sales and utility interconnection demand are partially correlated rather than independent growth engines.
The near-term catalyst sequence is clear. Q4 results will test recovery of the $15 million meter shipment, initial realization of November Electrical pricing, the remaining customer-consideration expense and the approximately $440 million free-cash-flow requirement. January guidance will establish whether backlog visibility and capacity additions support growth meaningfully above the standing framework. During H1 2027, control-house throughput, pricing recovery and actual debt repayment should become more visible. Initial 765-kV shipments provide a longer-duration catalyst extending into 2027 and beyond.
The most important negative review triggers are continued control-house ramp delays, backlog growth accompanied by weak shipments and rising inventory, persistent price-cost-productivity losses after the new pricing actions, and cash conversion that fails to support the announced deleveraging trajectory. A slowdown in Electrical Solutions before incremental utility capacity contributes would weaken the segment-diversification argument. NSI integration costs increasing without corresponding cash synergies would reduce confidence in acquisition returns.
A more favorable assessment would be supported by stronger utility shipment conversion, sustained Electrical margin improvement after removing refund and seasonal effects, and free cash flow sufficient to reduce debt while maintaining capacity investment. Those developments would demonstrate that demand visibility is becoming economically valuable earnings and cash rather than merely a larger order book.
The investment conclusion is constructive on the medium-term business outlook but measured on the immediate earnings upgrade. The quarter’s strongest signal was organic growth and future demand visibility, not the apparent magnitude of reported margin expansion. A valuation-driven upgrade requires evidence that normalized earnings and cash generation can sustain the expected growth. Even 10% EPS growth can be offset by approximately 9% valuation-multiple compression, making entry valuation consequential. A specific price target, position size or stop-loss cannot be supported without verified contemporaneous valuation and portfolio-exposure data.
SOURCE AND TRANSCRIPT QUALIFICATIONS
The principal evidence consists of the supplied Q3 2026 call and Bloomberg earnings notice, Hubbell’s 10/27/26 earnings release and financial reconciliations, its 07/28/26 release and call, the 02/03/26 full-year 2025 release, and the original NSI and DMC acquisition disclosures. Consensus comparisons use the supplied Bloomberg notice. Derived figures are analytical calculations rather than additional management guidance.
The draft transcript attributes approximately 7.5 percentage points of full-year sales-growth contribution to NSI. That standalone attribution was not reconciled against the annual acquisition bridge and should not be combined mechanically with a separate DMC contribution. The consolidated growth outlook implies approximately 8 percentage points between organic and total growth at the midpoint, before resolving currency and other perimeter effects. The 7.5-point statement therefore warrants confirmation before being used as an NSI-only model input.
The Bloomberg notice repeats the $20.48 consensus beside GAAP EPS guidance, despite also identifying it as adjusted EPS consensus. It is not a valid GAAP comparison. The draft also contains inconsistent speaker labels in Q&A, including the JPMorgan exchange. Management quotes are consequently attributed to management where individual speaker identification is uncertain.
COMPANY EMPLOYEES ON THE CALL
• Daniel Innamorato, Director of Investor Relations. • Gerben W. Bakker, Chairman, President and Chief Executive Officer. • Joseph A. Capozzoli, Senior Vice President and Chief Financial Officer.
RESEARCH ANALYST PARTICIPANTS
• Alexander Virgo, Evercore ISI. • Charles Albert “Chad” Dillard, Bernstein. • Christopher Glynn, Oppenheimer. • Julian Mitchell, JPMorgan, as listed in the participant roster. The spoken introduction indicates an unidentified colleague participated on his behalf. • Steve Tusa, Wells Fargo. • Thomas “Tommy” Moll, Stephens.
Key Read-Throughs
KEY READ-THROUGHS FROM HUBBELL’S Q3 2026 EARNINGS CALL
Hubbell’s results reinforce a durable North American electrical-infrastructure investment cycle, but the most actionable implications concern the divergence between demand, shipment capacity and earnings conversion. Utility backlog increased by more than $500 million year to date, data-center sales grew more than 80% organically, and substation components grew more than 20%. Conversely, control-house capacity expanded more slowly than expected, inflation required additional pricing actions, and tariff refunds materially supported reported margins. The strongest positive read-throughs favor qualified grid-equipment suppliers, electrical balance-of-system vendors and transmission contractors. The clearest negative read-through concerns expectations for rapid margin recovery despite persistent cost inflation. Country designations below identify primary listing markets, not corporate domicile. Impact assessments describe fundamental exposure and incremental information value, not predicted share-price returns.
ELECTRICAL EQUIPMENT
PRICE-COST RECOVERY IS A MORE IMMEDIATE EARNINGS RISK THAN DEMAND WEAKNESS (READ-THROUGH 1)
Affected company: Eaton (ETN: United States). Direction: Negative for near-term margin-recovery confidence, despite a positive demand backdrop. Magnitude: Moderate potential consolidated earnings sensitivity; high relevance to Electrical Americas margin expectations.
The critical commentary was that Hubbell’s Q3 price-cost-productivity equation was approximately neutral only “including the net impact of IEEPA tariff refunds.” Approximately $30 million of refunds, less approximately $5 million of customer considerations, produced a $25 million net benefit. Removing that benefit analytically reduces Hubbell’s adjusted operating margin from 25.5% to approximately 24.1%, compared with approximately 23.9% a year earlier. Thus, most of the headline margin expansion was not evidence that ordinary pricing and productivity had decisively overtaken inflation.
This matters particularly for Eaton because its previously disclosed Electrical Americas margin recovery depends heavily on precisely that equation. On its Q2 call, Eaton attributed approximately 300 basis points of expected H2-versus-H1 margin improvement to price-cost recovery, supplemented by output and productivity. Eaton also expected negative price-cost to become approximately neutral during H2. Hubbell’s October disclosure that inflation had intensified and that Electrical pricing was being accelerated into November is therefore incrementally adverse evidence for the ease of achieving that recovery, rather than evidence of weaker electrical demand.
The transmission mechanism is a lag between higher material, purchased-component and labor costs and their recovery through realized selling prices. Backlog can extend that lag when older orders retain earlier pricing. Even complete dollar recovery can dilute margin percentages because revenue and costs rise without a corresponding increase in operating profit. Higher volume therefore does not guarantee the anticipated margin progression.
The immediate trading catalyst is Eaton’s 11/03/26 earnings release, particularly Electrical Americas price-cost realization, factory productivity and the Q4 margin bridge. Hubbell does not establish that Eaton will miss its forecast: Eaton implemented pricing earlier, has different contracts and retains company-specific productivity opportunities. The high-conviction conclusion is narrower but important: a demand-led revenue beat should not automatically be interpreted as validation of the margin-recovery thesis. Over 2027, successful repricing could reverse this pressure, making the issue one of earnings timing and execution rather than a broken electrical-investment cycle.
SUBSTATION STRENGTH SUPPORTS GRID-EQUIPMENT DEMAND MORE DIRECTLY THAN GENERAL AI SPENDING (READ-THROUGH 2)
Affected company: GE Vernova (GEV: United States). Direction: Positive. Magnitude: High fundamental relevance to Electrification; moderate incremental relevance to consolidated earnings because Power and Wind have separate drivers.
Hubbell reported more than $500 million of year-to-date utility backlog growth, approximately 30% above the beginning-of-year level, with particular strength in transmission and substation projects. Substation components, including connectors, bushings, arresters and switches, grew more than 20%. Management also described a growing 765-kV project pipeline, with an initial project beginning shipments around year-end 2026 and into 2027.
These are physical grid-development signals rather than indirect inferences from hyperscaler capital budgets. Substations require coordinated procurement of transformers, switchgear, protection equipment, connections and control systems. Hubbell’s order and component-shipment strength therefore supports the duration of the addressable market for GE Vernova’s Power Transmission and Grid Systems Integration businesses. The economic channel is stronger equipment demand, improved capacity utilization and a longer period over which manufacturing investment can earn returns.
GE Vernova had already reported $6.3 billion of Q2 Electrification orders, approximately 1.7x segment revenue, and $40.6 billion of equipment backlog. Hubbell’s disclosure corroborates that established demand picture; it is not a newly identified GE Vernova award. The incremental information is that demand remained strong into Q3 and that constraints extended beyond the most widely discussed large equipment categories into smaller components and integrated substation systems.
The immediate catalyst is GE Vernova’s 10/28/26 earnings release. The relevant tests are Electrification orders, shipment capacity, delivery schedules and margins, rather than gas-turbine reservations alone. The longer-duration implication extends through 2027 and subsequent transmission investment cycles, including higher-voltage infrastructure.
The important limitation is project sequencing. Strong component orders may accompany transformer or switchgear orders already placed, so the same project should not be counted again as entirely new future equipment demand. Hubbell’s control-house delays also warn that excellent equipment bookings can coexist with uneven project completion. The strongest positive conclusion concerns demand duration and backlog quality, not an automatic acceleration of near-term revenue recognition.
ENGINEERED ELECTRICAL HOUSES ARE A CAPACITY BOTTLENECK, NOT AN UNDIFFERENTIATED FABRICATION MARKET (READ-THROUGH 3)
Affected company: Powell Industries (POWL: United States). Direction: Positive for the value of qualified engineering and manufacturing capacity. Magnitude: Moderate incremental information value, with potentially high longer-duration relevance to Powell’s relatively concentrated business.
Hubbell disclosed that its substation portfolio represents approximately 20% of Utility Solutions, divided roughly equally between components and modular control houses. Components grew more than 20%, but control-house revenue was flat sequentially from Q2 to Q3 because capacity proved harder to ramp than expected. Management stated that expansion had “just proved a little harder” and would take longer to translate into growth.
The implication is that component availability alone does not resolve the substation bottleneck. Engineering, systems integration, fabrication space, skilled labor, testing and delivery coordination can constrain the output of complete electrical assemblies. Those capabilities create economic value for established suppliers able to deliver qualified, project-specific systems.
Powell’s engineered electrical distribution equipment and power control rooms provide relevant exposure. Its fiscal Q3 disclosures already showed approximately $2.4 billion of backlog and $934 million of quarterly orders, including substantial utility and data-center activity. Hubbell therefore provides independent confirmation of the demanding industry backdrop in which Powell is expanding capacity.
The transmission mechanism is sustained demand for engineering-intensive assemblies, utilization of qualified manufacturing space and the ability to compete on delivery reliability rather than component price alone. However, Hubbell’s utility control houses and Powell’s various power control rooms are not universally interchangeable products. No transfer of a Hubbell customer order to Powell was disclosed, and market-share gains should not be assumed.
The longer-duration catalyst is Powell’s manufacturing expansion, including a planned approximately 300,000-square-foot facility expected to become available late in fiscal Q2 or early in fiscal Q3 2027. Its Jacintoport expansion initially targets LNG-related power control rooms, so that capacity should not be modeled immediately as dedicated utility or data-center capacity.
Near-term results remain dependent on Powell’s own project milestones and staffing. The actionable distinction is between a favorable market for qualified capacity and the ability to commission that capacity successfully. Hubbell strengthens the former thesis while simultaneously highlighting the execution risk embedded in the latter.
DATA-CENTER ELECTRICAL INFRASTRUCTURE
COMPONENT CONTENT AND CAPACITY ARE EXTENDING GROWTH BEYOND THE LARGEST POWER SYSTEMS (READ-THROUGH 4)
Affected companies: Legrand (LR: France), nVent Electric (NVT: United States), and Eaton (ETN: United States). Direction: Positive for relevant data-center electrical products. Magnitude: High relevance to Legrand’s and nVent’s growth profiles; moderate-to-high relevance to Eaton’s electrical businesses, with less direct applicability to their unrelated operations.
Hubbell’s data-center sales increased more than 80% organically. Management explicitly attributed the performance to “content gains, new product introductions and capacity additions,” highlighting wiring devices and Pin & Sleeve products. This is important because the growth was not described merely as more data centers being constructed. Hubbell was supplying more of the available electrical component opportunity while removing production constraints.
The precise transmission mechanism is greater revenue opportunity within each installation, combined with rising facility deployment. Power-distribution connections, cable management, busway, enclosures and other supporting electrical products can expand alongside larger UPS, switchgear and transformer systems. Manufacturers with broad product portfolios, specification relationships and sufficient capacity can participate in more categories within the same project.
Legrand offers particularly direct exposure through critical power, busway, electrical distribution and related data-center infrastructure. Its H1 disclosure placed data centers at 32% of group revenue, with organic growth above 30%. nVent had already reported strong growth in cable management and engineered buildings, alongside liquid cooling, and expected more than $2 billion of 2026 data-center sales. Eaton’s electrical businesses also address the broader power-distribution requirements of these facilities.
Hubbell strengthens the electrical-component demand case, but its 80% growth rate cannot be transferred to these peers. Some of that growth reflects Hubbell-specific penetration and capacity additions, potentially including competitive gains. Its wiring-device results do not directly validate nVent’s liquid-cooling growth rate, and the call does not establish the eventual winners from changes in data-center power architecture.
Near-term catalysts are nVent’s 10/30/26 results, Eaton’s 11/03/26 results and Legrand’s 11/05/26 results. The critical disclosures are electrical-product orders, capacity conversion and customer deployment schedules. These peers had already disclosed strong data-center activity, so the new signal is continued strength into Q3, not discovery of an unrecognized end market.
The longer-duration opportunity extends into 2027 as new capacity and broader product offerings support additional content capture. Geographic interpretation is important: Hubbell most directly corroborates North American deployment. It does not establish a comparable recovery in European construction or Chinese industrial demand.
TRANSMISSION ENGINEERING AND CONSTRUCTION
BACKLOG AND 765-KV ACTIVITY SUPPORT A MULTI-YEAR CONSTRUCTION PIPELINE, NOT NECESSARILY AN IMMEDIATE REVENUE SURGE (READ-THROUGH 5)
Affected company: Quanta Services (PWR: United States). Direction: Positive for transmission and substation activity. Magnitude: High relevance to the electric-infrastructure business and material consolidated exposure; moderate incremental information value because Quanta already has substantial committed work.
Hubbell’s utility orders continued to exceed expectations, its backlog increased by more than $500 million year to date, and management described transmission and substation investment as being in the early stages of a multi-year cycle. It also indicated that capacity additions would need to continue beyond 2027 to serve subsequent years. The developing 765-kV pipeline provides a more specific signal of large, technically demanding transmission projects.
The transmission mechanism runs from approved utility investment and equipment procurement into engineering, site preparation, line construction, substation installation, testing and commissioning. Quanta participates directly in those execution activities. A longer and broader pipeline can support engineering utilization, specialized labor deployment and multi-year customer programs rather than reliance on isolated construction awards.
Quanta had already reported $53.4 billion of total backlog in Q2. Hubbell’s evidence strengthens the durability of that opportunity set but does not establish additional Quanta bookings. Some of the component orders may support projects already included in Quanta’s backlog or work already underway. Treating every upstream order increase as a new contractor award would double-count portions of the same investment cycle.
The immediate catalyst is Quanta’s 10/29/26 results, with emphasis on electric-infrastructure bookings, project starts, workforce utilization and 2027 visibility. The more substantial fundamental effect lies in 2027-2029, as higher-voltage networks and associated substations progress through construction.
The negative qualification is delivery sequencing. Hubbell’s control-house constraints can leave individual projects waiting for essential assemblies even when engineering and other equipment are ready. That creates schedule risk, but not a sufficient basis to infer a broad Quanta cash-flow problem. Quanta’s own Q2 release reported approximately $0.9 billion of free cash flow, providing clear counterevidence to any automatic transfer of Hubbell’s working-capital pressure. The preferred read-through is stronger demand duration with project-level timing risk, not an indiscriminate acceleration of quarterly revenue estimates.
ELECTRICAL AND UTILITY DISTRIBUTION
SUPPLY COMPLEXITY INCREASES THE VALUE OF PROCUREMENT AND LOGISTICS, BUT ALSO THE CAPITAL REQUIRED TO DELIVER GROWTH (READ-THROUGH 6)
Affected company: Wesco International (WCC: United States). Direction: Positive for demand and service relevance, with a negative working-capital qualification. Magnitude: Moderate-to-high revenue relevance because Wesco participates in both data-center infrastructure and utility supply chains; cash-flow implications depend on inventory and customer-payment execution.
Hubbell reported strong data-center, transmission and substation demand, while describing component shortages, uneven capacity availability and continuing inflation. It also cited constructive distributor discussions around large projects and ongoing success in cross-selling and channel conversions.
For a distributor and supply-chain services provider, these conditions create value beyond simply reselling equipment. Coordinating specifications, sourcing multiple product categories, staging inventory and sequencing delivery can reduce the risk that a small missing component delays a much larger project. The economic channel is higher addressable project spending and greater demand for procurement, logistics and inventory-management services.
Wesco’s own Q2 results already showed approximately $1.5 billion of data-center sales, growth of approximately 45%, and total backlog growth of approximately 60%. The company also disclosed a significant multi-year Grid Services award from a hyperscale customer. Hubbell therefore corroborates both sides of Wesco’s exposure: electrical infrastructure inside the data center and the utility infrastructure required to serve it.
The positive read-through is not that Hubbell’s share gains automatically accrue to Wesco. Distributor allocation, project awards and commercial terms were not identified on the Hubbell call. Rather, strong demand across multiple constrained product categories increases the relevance of Wesco’s established distribution and service capabilities.
The negative channel is cash intensity. Higher unit costs, larger projects and uneven equipment delivery can require more inventory and receivables before cash is collected. Wesco’s Q2 free cash flow was positive at $32 million but modest relative to its $6.7 billion revenue base, illustrating why revenue growth and cash realization must be evaluated separately. Hubbell’s experience reinforces this monitoring requirement without proving deterioration at Wesco.
The near-term catalyst is Wesco’s Q3 reporting cycle in late October, particularly backlog conversion, inventory, receivables and supplier-price recovery. Hubbell’s November pricing action also creates a possible distortion from purchasing ahead of price increases, although the call did not establish that such behavior had occurred. The longer-duration benefit is a larger role for integrated procurement and project logistics; the investment condition is that service value and earnings growth translate into acceptable returns on the additional working capital.
REGULATED UTILITIES
GRID INVESTMENT IS WELL SUPPORTED, BUT CONTRACTED LOAD SHOULD NOT BE EQUATED WITH IMMEDIATE CASH EARNINGS (READ-THROUGH 7)
Affected company: American Electric Power (AEP: United States). Direction: Positive for the duration of transmission and distribution investment; negative for assuming rapid, frictionless monetization of large-load commitments. Magnitude: Material long-term capital-allocation relevance, but limited evidence for an immediate EPS revision.
Hubbell’s backlog growth and strong transmission and substation orders support the need for substantial utility investment. However, the same call showed that modular control-house output failed to ramp as expected, despite strong demand. Management also indicated that capacity additions would need to continue across several years.
The positive transmission mechanism is additional investment in infrastructure needed to connect and reliably serve load, supporting regulated asset growth where projects receive appropriate approval and cost recovery. AEP has particularly relevant exposure through its transmission footprint and large-load development. Its Q2 disclosures outlined a $78 billion 2026-2030 capital plan and 69 GW of contracted load additions through 2030.
The negative mechanism is the gap between customer commitments, construction spending and operational readiness. A substation cannot necessarily be commissioned merely because the line, transformer or other major components have arrived. Missing control and protection assemblies can defer energization. Depending on the regulatory framework, accounting earnings may receive support during construction, while cash recovery and customer electricity consumption occur later. Strong project demand can therefore coexist with elevated funding requirements.
This is an industry execution read-through, not evidence that a named AEP project has been delayed by Hubbell. No specific supplier allocation was disclosed. AEP also has important protections that limit the bearish interpretation: its own commentary described long-term customer commitments, large-load tariffs and take-or-pay arrangements intended to mitigate development-timing risk. Those protections vary by project and should not be assumed to cover every commitment identically.
The near-term catalysts are AEP’s fall 2026 capital-plan update and subsequent disclosures on energization milestones, customer contributions and financing. The longer-duration effect extends through the 2026-2030 investment program. The high-conviction portfolio implication is that grid-equipment demand and regulated-utility growth can both be attractive, but their cash-flow timing is different. Equipment bookings provide evidence of investment activity; they do not by themselves establish when the utility will begin collecting the associated operating cash flows.
Report record
- Sector
- Industrials
- Industry
- Electrical Equipment
- Fiscal period end
- September 30, 2026
- Report date
- October 27, 2026
- Analysis
- 6166 words
- Read-throughs
- 2718 words
- Content fingerprint (PDF)
765e3cb89d44- Content fingerprint (analysis)
9a7d0bc62dba- Content fingerprint (read-throughs)
626741d40b59
Prepared from the company's earnings release and earnings call transcript. Figures as reported by the company. For information only. Not investment advice.
More from Hubbell Incorporated
No other reports yet.
All Hubbell Incorporated reports
More in Industrials
Earnings Expansion Durable, but the Beat Was Not Unequivocal
Improved visibility into 2027 rather than a substantial upgrade to 2026 earnings
Follow @AtlasPeakRes on X for new earnings reports as they publish.