The business outlook improved more clearly than the prospective risk-adjusted stock return.
Earnings Reports
Celestica Inc. FQ3 2026 Earnings Report
Celestica Inc. (CLS) FQ3 2026 earnings: Earnings opportunity has expanded faster than its demonstrated ability to self-fund. Full earnings analysis, key read-throughs, and the one-page exhibit from Atlas Peak Research.
Celestica Inc. (CLS)
Sector: Information Technology · FQ3 2026 · Period end September 30, 2026 · Reported October 26, 2026
Celestica’s Q3 2026 earnings call materially strengthened the case that the company is becoming a strategically important designer and manufacturer of customized AI infrastructure, rather than simply an electronics manufacturing beneficiary of rising capital expenditure.
Download the one-page report (PDF)
View one-page exhibit
Download analysis (.md)
Download read-throughs (.md)
Post to X
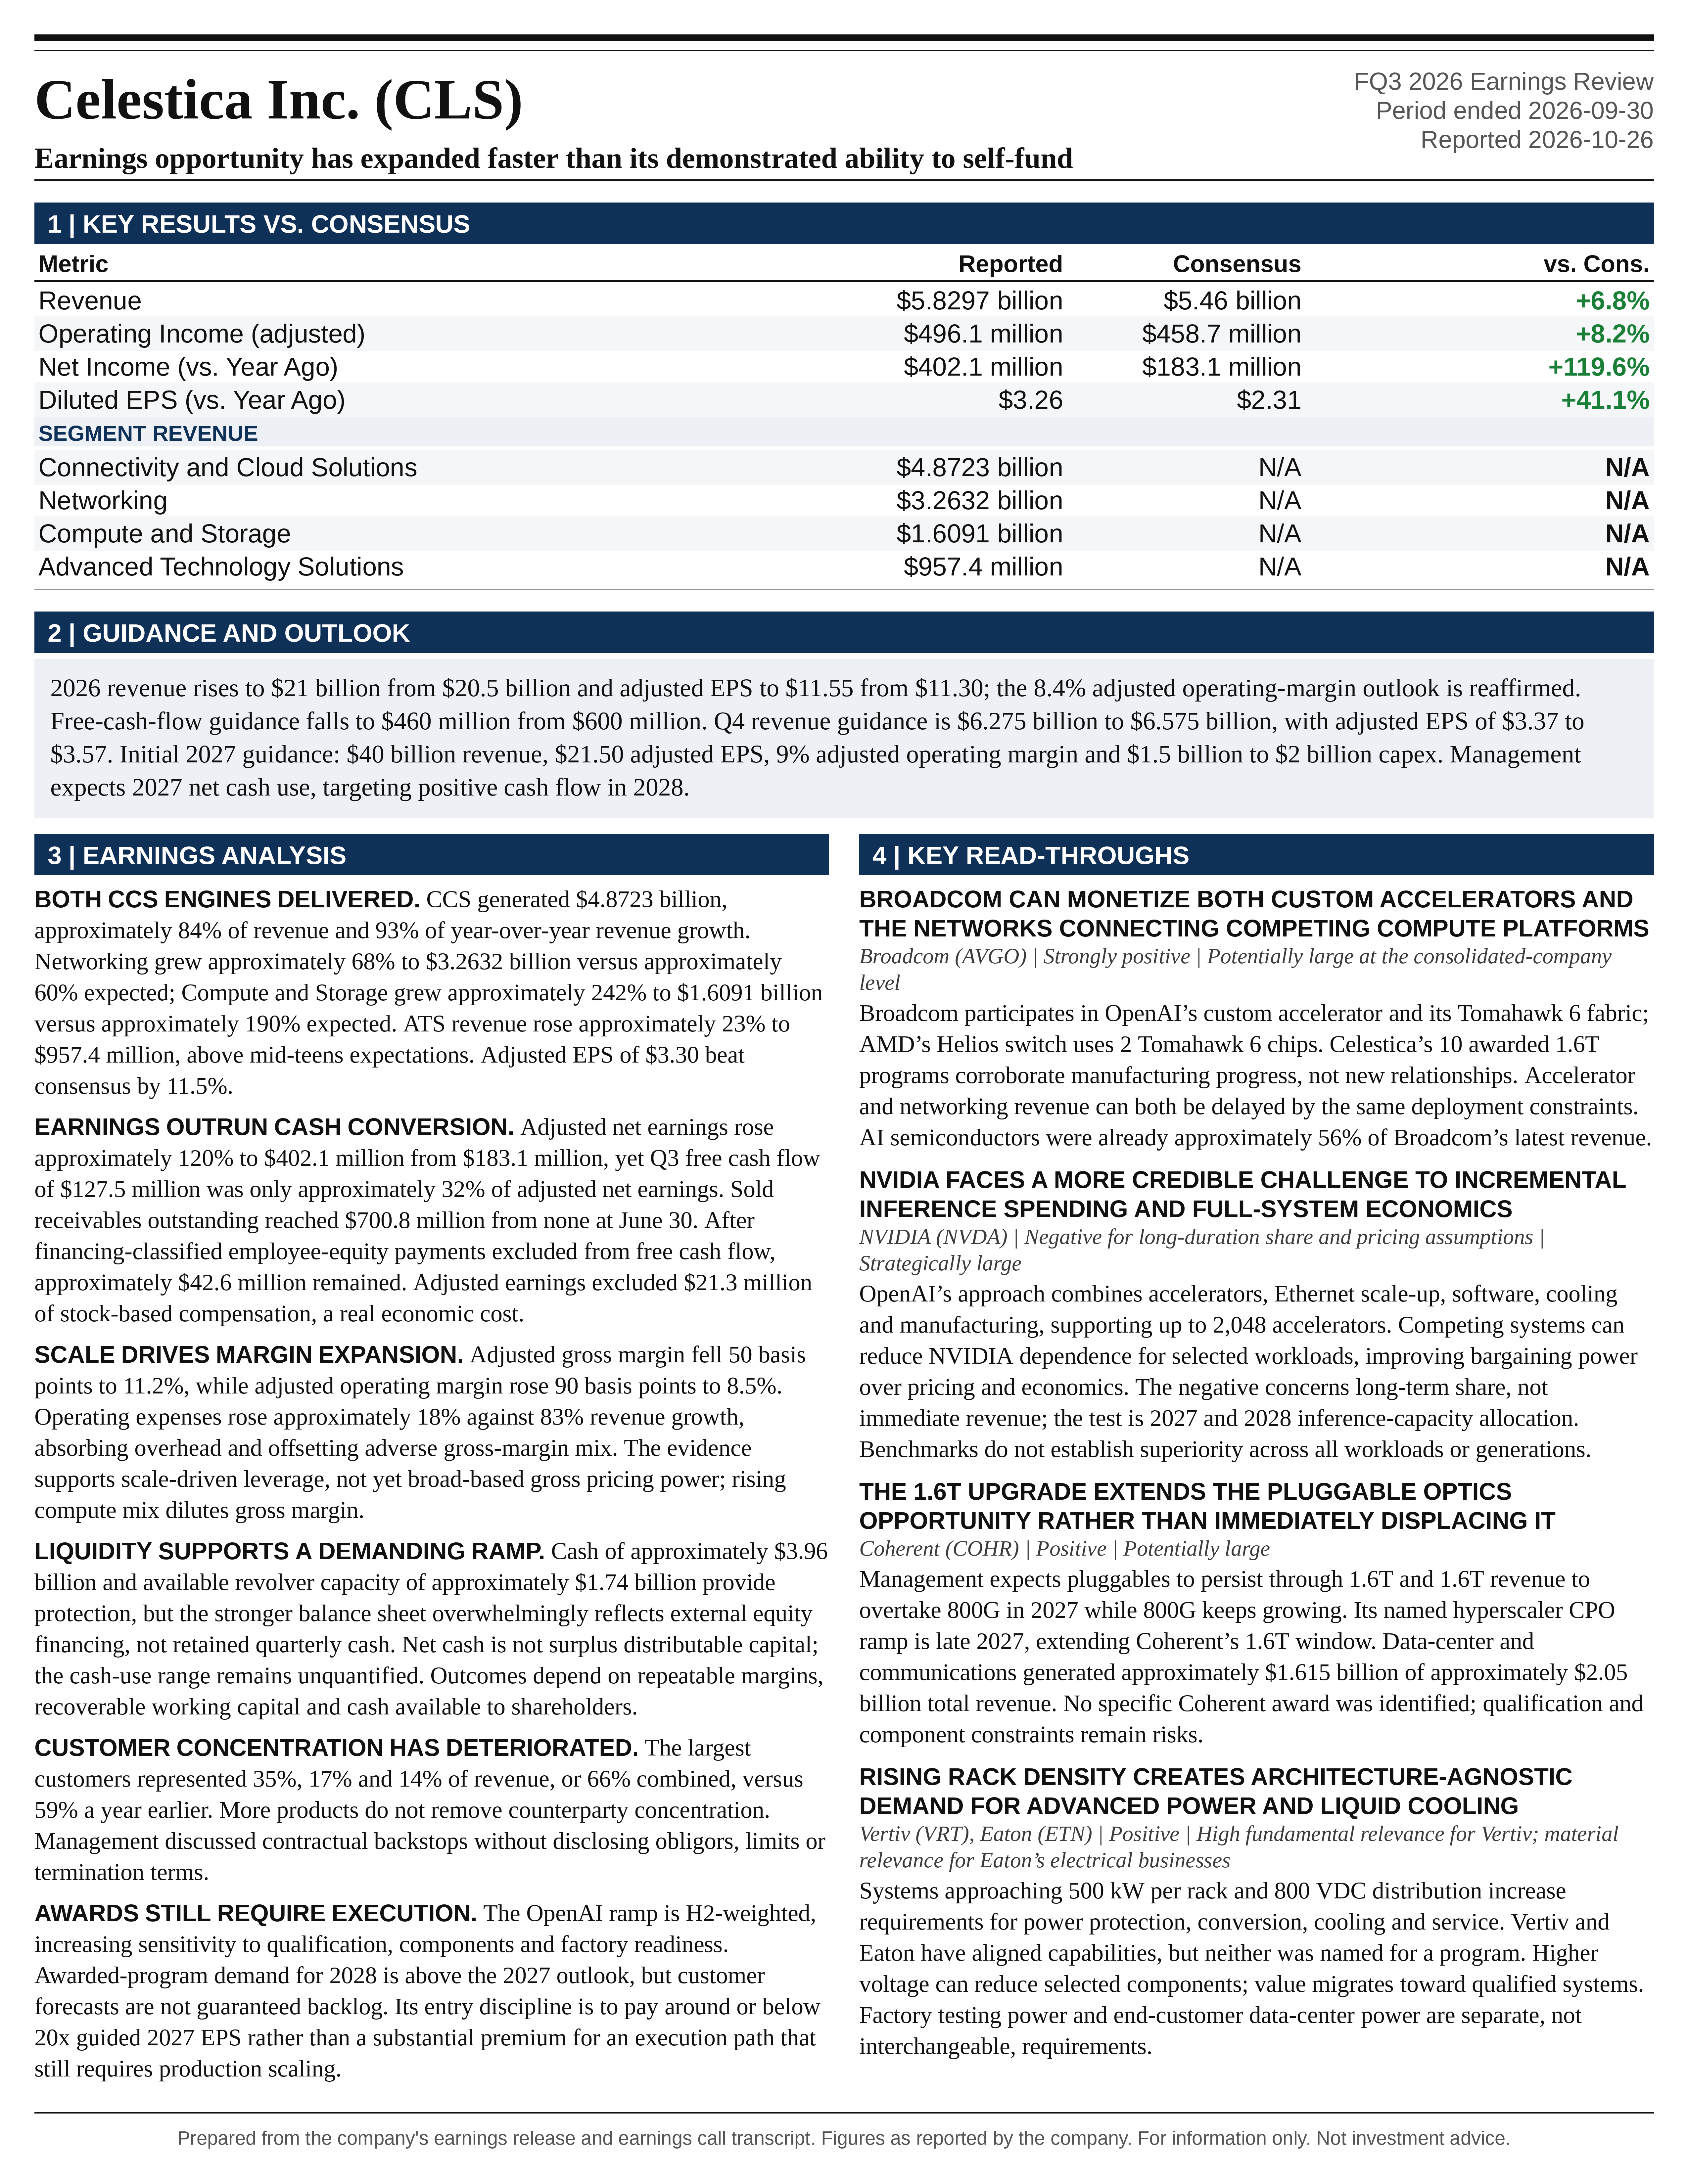
One-Page Exhibit
Earnings Analysis
EXECUTIVE CALL SUMMARY: Celestica Inc. (10/27/26)
Celestica’s Q3 2026 earnings call materially strengthened the case that the company is becoming a strategically important designer and manufacturer of customized AI infrastructure, rather than simply an electronics manufacturing beneficiary of rising capital expenditure. The principal investment development was the initial 2027 outlook for $40 billion of revenue, $21.50 of adjusted EPS, and a 9% adjusted operating margin. These targets imply approximately 90% revenue growth, 86% EPS growth, and 60 basis points of operating-margin expansion against the updated 2026 outlook. The opportunity is substantial, but the investment profile is also changing: increasingly concentrated customer exposure, larger working-capital commitments, more complex manufacturing ramps, and negative expected cash generation in 2027 require greater scrutiny than the headline earnings growth alone suggests.
The quarter itself was strong across revenue, operating execution, and earnings. Revenue of $5.83 billion exceeded the supplied Bloomberg consensus by 6.8%, adjusted operating earnings of $496.1 million exceeded consensus by 8.2%, and adjusted EPS of $3.30 exceeded consensus by 11.5%. Revenue increased 83% year over year and approximately 24% sequentially. However, Q4 guidance was essentially consistent with existing expectations: the $6.425 billion revenue midpoint was approximately 0.5% above consensus, while the $3.47 adjusted EPS midpoint was approximately 0.6% below consensus. The most consequential forward-looking information therefore concerned the scale, profitability, financing, and execution requirements of 2027, not a major incremental Q4 earnings upgrade.
The central financial qualification is that reported earnings and reported free cash flow do not fully describe the underlying funding requirements. The accompanying quarterly filing disclosed $700.8 million of sold receivables outstanding at September 30, compared with none at June 30, alongside substantial increases in accounts payable. These financing mechanisms supported operating cash flow and the improvement in reported cash-cycle days. In addition, company-defined free cash flow excludes significant financing-classified cash payments associated with employee equity awards. These disclosures do not invalidate the operating performance, but they materially qualify the characterization of the business as increasingly self-funding.
The appropriate investment stance is selectively constructive rather than price-insensitive. The call supports a higher medium-term earnings assessment and a stronger competitive-position assessment. It does not justify treating $40 billion as a guaranteed revenue floor, assuming that every awarded program represents an irrevocable purchase commitment, or valuing 2027 adjusted EPS as though it were already distributable cash. A favorable risk-adjusted entry requires compensation for the possibility that program delays, working-capital absorption, or margin shortfalls arrive before the anticipated return to positive cash flow in 2028.
QUARTERLY PERFORMANCE AND THE QUALITY OF THE BEAT
The detailed earnings release reported Q3 revenue of $5.8297 billion, compared with $3.194 billion in Q3 2025. Revenue exceeded the prior $5.25 billion to $5.55 billion guidance range by $279.7 million at the high end and $429.7 million at the midpoint. Those differences represent approximately 5.0% and 8.0%, respectively. Adjusted EPS of $3.30 exceeded the prior $2.88 to $3.08 range by $0.22 at the high end and $0.32 at the midpoint. The performance was therefore stronger than both management’s forecast and the supplied external consensus.
The sequential comparison reinforces the evidence of accelerating activity. Q2 revenue was approximately $4.70 billion, adjusted EPS was $2.54, and adjusted operating margin was 8.2%. Q3 delivered approximately 24% sequential revenue growth, 30% sequential adjusted EPS growth, and 30 basis points of margin expansion. These results are consistent with meaningful production scaling rather than merely favorable comparisons against a weak prior-year period.
Adjusted operating earnings increased from $242.2 million to $496.1 million, approximately 105%, on incremental revenue of $2.636 billion. The resulting year-over-year incremental operating margin was approximately 9.6%, above the prior-year operating margin and above the current consolidated margin. This is a substantive indication that additional volume is generating operating leverage. It also provides an empirical reference point for the approximately 9.7% incremental operating margin embedded in the 2027 outlook.
The EPS beat was not entirely operational. The adjusted effective tax rate was approximately 18%, compared with the prior guidance assumption of approximately 20%. The earnings release attributed the lower rate to favorable profit mix and a discrete tax benefit. Applying a 20% tax rate to reported adjusted pretax income produces adjusted EPS of approximately $3.23, rather than $3.30. Approximately $0.07 of quarterly EPS therefore reflected the benefit relative to the prior tax assumption. Even after this normalization, EPS remained above the high end of management’s previous range.
Financing income also became more meaningful following the equity offering. Interest income increased to $19.7 million from $1 million a year earlier, while finance costs increased to $24.1 million from $13.8 million. Net finance expense consequently declined to $4.4 million from $12.8 million. This supported earnings, although the benefit should not be extrapolated indefinitely because cash is being reserved for deployment into working capital and manufacturing capacity.
Adjusted net earnings increased approximately 120%, from $183.1 million to $402.1 million, faster than adjusted EPS growth of 109%. The difference reflects dilution: diluted weighted-average shares increased from 115.9 million to 121.8 million. The quarter therefore demonstrated substantial underlying earnings growth despite the partial-period impact of the August equity issuance.
GAAP RESULTS AND NON-GAAP COMPARABILITY
GAAP diluted EPS increased from $2.31 to $3.26, approximately 41%, while GAAP operating margin declined from 10.2% to 7.9%. These figures appear weaker than the adjusted results, but the divergence is substantially explained by total return swap valuation effects rather than deterioration in the underlying manufacturing business.
Q3 2025 included a $113.3 million favorable total return swap fair-value adjustment, whereas Q3 2026 included a $3.9 million unfavorable adjustment. The company uses this instrument to manage share-price exposure associated with certain employee equity awards. The prior-year gain materially elevated GAAP operating income and makes the unadjusted margin comparison an unreliable indicator of underlying operating progress.
Nevertheless, adjusted earnings should not be treated as identical to economic earnings available to shareholders. Q3 adjustments included $21.3 million of employee stock-based compensation and $10 million of intangible-asset amortization, excluding software. The company’s adjustments provide a useful operating comparison, particularly by removing volatile swap valuation effects, but employee compensation remains an economic cost whether ultimately settled through dilution, treasury-share purchases, or cash withholding payments.
The distinction is especially relevant because the company is expanding its engineering workforce and because financing-classified employee equity cash requirements have become material. A comprehensive valuation should incorporate both adjusted operating performance and the eventual cash or dilution cost of delivering that performance.
MARGIN EXPANSION IS BEING DRIVEN BY SCALE MORE THAN GROSS-MARGIN IMPROVEMENT
Adjusted gross margin declined 50 basis points year over year to 11.2%, despite adjusted operating margin increasing 90 basis points to 8.5%. Adjusted gross profit increased approximately 74%, from $374.4 million to $652.4 million, slower than revenue growth. The implied incremental gross margin was approximately 10.5%, below the prior-year gross margin.
The improvement occurred below gross profit. Adjusted operating expenses implied by gross profit less operating earnings increased approximately 18%, from $132.2 million to $156.3 million, while revenue increased 83%. Adjusted SG&A increased approximately 11%, and reported R&D expense increased approximately 41%. Operating expenses consequently declined from approximately 4.1% of revenue to 2.7%. This overhead absorption more than offset the adverse gross-margin mix.
This distinction changes the interpretation of the competitive thesis. The financial evidence supports stronger earnings leverage from scale, efficient overhead growth, and favorable program economics. It does not yet demonstrate broad-based expansion in gross pricing power. More sophisticated designs may improve customer relevance and protect margins, but the consolidated results still reflect dilution from the growing compute mix.
Management’s 2027 commentary was consistent with this interpretation. Gross margins were expected to remain around 11% or in the low-11% range, while operating margin was expected to rise to 9%. At $40 billion of revenue, an 11% gross margin would generate approximately $4.4 billion of gross profit, leaving approximately $800 million of adjusted operating expenses to achieve the $3.6 billion operating-profit target.
That framework appears arithmetically plausible relative to the current cost base, but it leaves limited room for simultaneous deterioration in gross margin and unexpectedly rapid overhead growth. A 50-basis-point operating-margin shortfall on $40 billion of revenue would reduce pretax earnings by $200 million and adjusted EPS by approximately $1.24, assuming a 21% tax rate and 127 million diluted shares. Margin execution is therefore economically significant even when the percentage changes appear small.
CCS: BOTH NETWORKING AND COMPUTE CONTRIBUTED MATERIAL ABSOLUTE GROWTH
Connectivity and Cloud Solutions generated $4.8723 billion of revenue, compared with $2.413 billion a year earlier. CCS accounted for approximately 84% of consolidated revenue and approximately 93% of the company’s year-over-year revenue increase. Segment income increased from $199.4 million to $433.2 million, and segment margin increased from 8.3% to 8.9%.
Networking revenue increased from $1.9429 billion to $3.2632 billion, approximately 68%, compared with management’s expectation of approximately 60% growth. The $1.3203 billion increase accounted for approximately 50% of total company revenue growth. Demand remained broad across 800G, early 1.6T production, and continuing 400G programs. The networking business is therefore not yet exhibiting a simple substitution pattern in which each new bandwidth generation immediately displaces the preceding generation.
Compute and Storage revenue increased from $470.1 million to $1.6091 billion, approximately 242%, compared with the previous expectation of approximately 190% growth. Its $1.139 billion increase accounted for approximately 43% of consolidated revenue growth. Although the growth rate was much higher than networking’s, the absolute incremental revenue contributions were relatively close. The quarter was not solely a compute-driven event.
Management attributed compute outperformance to hyperscaler AI programs and stronger storage demand. That distinction matters because the end-market category does not provide a clean measure of custom accelerator revenue. No detailed revenue split was provided among TPU systems, other AI compute, conventional servers, and storage. Treating the full $1.6091 billion as custom ASIC revenue would overstate the precision of the disclosure.
Hardware Platform Solutions revenue increased 70% to approximately $2.3 billion. HPS is a cross-cutting design-led offering within CCS, not an additional reportable segment. It should not be added to networking and compute revenue. Its share of consolidated revenue was approximately 39.5%, compared with roughly 42% a year earlier using the disclosed growth rate. HPS is expanding rapidly, but faster growth elsewhere in CCS means that its consolidated revenue mix did not increase this quarter.
The renaming of Communications to Networking and Enterprise to Compute and Storage does not change the business perimeter or historical comparability. It improves the descriptive accuracy of the categories but should not be interpreted as a reporting reorganization or a source of incremental growth.
ATS: BETTER PERFORMANCE, BUT DECLINING PORTFOLIO DIVERSIFICATION
Advanced Technology Solutions revenue increased approximately 23% to $957.4 million, above the prior mid-teens growth expectation. Segment income increased approximately 47% to $62.9 million, and margin increased 110 basis points to 6.6%. This represents a meaningful improvement in an operation that had previously been reshaped toward higher-margin programs and more durable customer relationships.
Capital equipment was the principal growth driver, with additional demand across industrial, aerospace and defense, and HealthTech. Management also highlighted engineering services, where revenue has grown at a CAGR above 30% since 2023 and approximately 50% of new wins include an engineering-services component. This supports the argument that ATS is pursuing a more differentiated mix rather than relying exclusively on a cyclical recovery in outsourced manufacturing.
The 2026 outlook calls for approximately $3.6 billion of ATS revenue, 13% growth, and a 6.4% segment margin. The approximately 10% revenue-growth outlook for 2027 is healthy but materially below the current quarterly growth rate. The appropriate base case is continued expansion, not extrapolation of Q3’s 23% growth indefinitely.
ATS is also becoming a smaller source of portfolio diversification. Approximately 10% growth from a $3.6 billion base would produce approximately $4 billion of 2027 revenue, or roughly 10% of the consolidated outlook. Moreover, the strongest ATS driver is semiconductor capital equipment, which shares exposure to the broader AI investment cycle. Its economic correlation with CCS is therefore higher than the segment labels alone might imply.
Management cited market forecasts for wafer-fab-equipment spending growth above 40% in 2027. That is a management-referenced industry forecast, not a guarantee of Celestica growth. Customer allocation, product exposure, manufacturing content, and timing determine the eventual transmission into ATS revenue.
2026 GUIDANCE: A SOLID RAISE, BUT MOST OF THE REVENUE INCREASE WAS ALREADY DELIVERED
Full-year revenue guidance increased from $20.5 billion to $21 billion, a 2.4% increase. Adjusted EPS guidance increased from $11.30 to $11.55, a 2.2% increase. Adjusted operating-margin guidance remained unchanged at 8.4%. Relative to the supplied Bloomberg consensus, the updated revenue outlook was approximately 2.0% higher and adjusted EPS approximately 3.5% higher.
The revenue bridge is important. Q3 exceeded the previous revenue-guidance midpoint by approximately $430 million, while full-year guidance increased by $500 million. Approximately 86% of the annual increase was therefore already represented by Q3 outperformance. On a mechanically comparable basis, the residual implied improvement in Q4 revenue expectations was approximately $70 million.
This does not diminish the quarter’s execution, but it prevents the annual raise from being misinterpreted as a $500 million upgrade to future demand. Most of the additional revenue had already been recognized.
A comparable EPS bridge cannot be constructed by simply subtracting the quarterly EPS beat from the annual EPS increase. The August equity issuance changed weighted-average share counts, and quarterly EPS does not sum precisely to annual EPS when the denominator changes. The prior Q2 outlook explicitly assumed no additional share issuance. The updated guidance incorporates the larger capital base.
The broader sequence remains favorable for earnings but less favorable for cash. At Q2, management had increased 2026 revenue guidance from $19 billion to $20.5 billion, adjusted EPS from $10.15 to $11.30, operating margin from 8.1% to 8.4%, and free cash flow from $500 million to $600 million. The current update increases revenue and EPS again but reduces free cash flow to $460 million. The business is outperforming earlier revenue expectations while requiring more external and working-capital financing than previously anticipated.
Q4 GUIDANCE: CONTINUED GROWTH, WITH TAX AND DILUTION LIMITING EPS ACCELERATION
Q4 revenue guidance of $6.275 billion to $6.575 billion implies approximately 76% year-over-year growth and approximately 10% sequential growth at the midpoint. Adjusted EPS guidance of $3.37 to $3.57 implies approximately 84% year-over-year growth and approximately 5% sequential growth at the midpoint. Adjusted operating margin is expected to reach 8.7%.
The slower sequential EPS increase does not imply weaker operating profitability. At the revenue midpoint, an 8.7% margin implies approximately $559 million of adjusted operating earnings, approximately 13% above Q3. However, the tax-rate assumption increases to approximately 20%, and diluted weighted-average shares increase to approximately 127 million from 121.8 million. These factors absorb part of the operating improvement.
Applying Q3 adjusted net earnings to the Q4 share count would produce EPS of approximately $3.17 rather than $3.30. The full-period dilution effect is therefore material. Comparisons that ignore the share-count change will understate the underlying improvement in Q4 earnings generation.
Networking revenue is expected to grow approximately 65%, Compute and Storage approximately 160%, and ATS in the low-20% range. The deceleration in reported compute growth from 242% should not automatically be interpreted as deteriorating demand, since the comparison base is changing and absolute revenue remains on an expanding trajectory. Nevertheless, Q4 provides no basis for assuming that the Q3 compute growth rate is sustainable.
The supplied Bloomberg notice reported a 7.1% share-price increase following the results. The operating beat supports a positive reaction, but the near-consensus Q4 outlook indicates that the more important valuation debate concerns 2027 and beyond. The notice’s 27 buy ratings, 1 hold, and 0 sells also indicate a strongly favorable sell-side stance, although ratings alone do not establish actual investor positioning.
2027 GUIDANCE: A MAJOR SCALE CHANGE, NOT A SIMPLE EXTENSION OF THE CURRENT RUN RATE
The $40 billion revenue outlook represents approximately $19 billion of incremental revenue over the updated 2026 forecast. At a 9% operating margin, adjusted operating earnings would reach approximately $3.6 billion, compared with approximately $1.764 billion implied by the 2026 outlook. Operating earnings would therefore increase approximately 104%.
The revenue requirement remains demanding even after accounting for the strong Q4 exit rate. Annualizing the Q4 revenue midpoint produces approximately $25.7 billion. The 2027 outlook is approximately 56% above that annualized level and requires average quarterly revenue of $10 billion. Delivery depends on substantial additional production ramps, not merely maintaining the anticipated year-end operating pace.
Management explicitly expects sequential growth and materially greater revenue in H2 than H1. The OpenAI program is expected to be H2-weighted, while networking and existing custom compute programs provide other sources of growth. The back-end loading increases sensitivity to qualification schedules, component availability, factory readiness, and customer deployment dates. A delayed program may remain commercially attractive while still creating a substantial shortfall against the calendar-year forecast.
The approximately 110% CCS growth and approximately 10% ATS growth assumptions are rounded directional inputs. Applying them literally to the rounded 2026 segment forecasts produces a total slightly above $40 billion. The consolidated $40 billion outlook should remain the controlling forecast rather than treating that rounding difference as additional guidance.
The comparison with prior guidance contains an important change. At Q2, management expected 2027 revenue growth to exceed the approximately 65% growth then anticipated for 2026 and expected EPS to grow faster than revenue. The current forecast specifies approximately 90% revenue growth but approximately 86% EPS growth. The stronger operating outlook is therefore accompanied by a less favorable per-share growth relationship.
Dilution and taxes provide substantial explanations. The 2027 share-count assumption of 127 million is approximately 5.7% above the full-year 2026 weighted-average count implied by the disclosed year-to-date shares and Q4 assumption. The 2027 tax-rate assumption is approximately 21%, above the 2026 year-to-date rate of approximately 19%. Operating leverage remains strong, but not all of it accrues to EPS.
The current outlook is the first numerical 2027 annual forecast in the reviewed source set. It should not be described as a percentage increase over an earlier formal $33 billion or $34 billion forecast. Prior commentary established a growth-rate expectation, not a precise annual revenue target. A matched pre-release 2027 consensus was not available in the supplied notice, so the exact 2027 consensus surprise remains unquantified.
VISIBILITY HAS IMPROVED, BUT AWARDED PROGRAMS ARE NOT EQUIVALENT TO GUARANTEED REVENUE
Management’s most consequential statement on forecast construction was: “Our financial outlook factors in our best assessment of dynamics, including the impact of supply constraints and timing of capacity ramps against a backdrop of higher customer demand.”
This frames $40 billion as an execution- and supply-constrained forecast rather than a full measure of indicated customer demand. Better component availability or faster production ramps could create upside. Conversely, management’s incorporation of risk does not eliminate the possibility that actual constraints prove more severe than assumed.
The company described design engagements beginning as much as 24 months before mass production and customer discussions extending into 2029 and 2030. Gavin Cato indicated that approximately 60 to 70 programs are under active engagement, with much of the 2027 work already in testing and engineering resources increasingly focused on 2028. These disclosures support improved visibility into product roadmaps and manufacturing requirements.
They do not establish an equivalent number of committed revenue-producing programs. Active engagements can differ substantially in maturity, scale, economics, and probability of commercialization. Neither a program count nor a design award provides a reliable revenue forecast without corresponding volume, pricing, allocation, and recognition assumptions.
Mandeep Chawla stated: “We are being awarded programs right now where the silicon has not yet been developed, but programs are expected to begin in 2028.” This is strong evidence of early customer integration, but also evidence that commercial visibility can precede technical completion by a considerable period.
Management stated that 2028 customer demand forecasts based solely on awarded programs are meaningfully higher than the 2027 revenue outlook. This is an important positive signal. However, customer forecasts, awarded design positions, manufacturing allocations, purchase orders, and legally enforceable minimum-volume commitments are different forms of evidence. The call did not disclose sufficient contractual detail to treat the 2028 demand statement as guaranteed backlog.
NETWORKING: THE 1.6T CYCLE EXPANDS BOTH BANDWIDTH AND ADDRESSABLE CONTENT
The networking outlook contains more than a bandwidth upgrade. Management expects 800G revenue to continue growing while 1.6T revenue overtakes it in 2027. The statement that “our 1.6T revenue will surpass 800G revenue next year” implies a rapid transition across a growing base of programs without requiring immediate contraction of the preceding generation.
The incremental opportunity comes partly from Ethernet entering scale-up connectivity, rather than remaining concentrated in scale-out networking between accelerator systems. Celestica disclosed 10 awarded 1.6T programs, including 4 scale-up and 6 scale-out programs. These counts demonstrate breadth but should not be interpreted as a revenue allocation because individual programs can differ greatly in size.
The strategic significance is that Celestica can gain additional content within the same customer’s AI architecture. Scale-up designs require high bandwidth, low latency, dense interconnects, specialized cooling, and customized physical integration. This creates opportunities for system-level engineering beyond the manufacture of conventional front-panel switches.
The AMD Helios collaboration is a tangible example. The DS6010 uses 2 Broadcom Tomahawk 6 chips to provide aggregate switching capacity of 204.8 Tbps in a 1OU chassis and supports connectivity for 72 GPUs within the Helios rack architecture. Celestica’s product documentation corroborates the dual-chip design, cabled backplane, and liquid-cooling requirements. Aggregate switching capacity should not be confused with individual port speed.
The initial production ramp is expected by the end of 2026. The investment significance is not that Helios guarantees immediate large revenue, but that the program demonstrates qualification for a demanding scale-up architecture that can expand Celestica’s customer relevance and manufacturing content.
Management cited 31% revenue share and 44% port share in 800G-and-higher Ethernet networking, alongside 58% share of custom Ethernet switch revenue. These are management-referenced external market estimates. They support the claimed leadership position but do not independently establish pricing power. The difference between port and revenue share also illustrates why unit leadership cannot be translated directly into branded-OEM economics.
OPTICS: A STRATEGIC CAPABILITY, NOT THE PRIMARY EXPLANATION FOR NEAR-TERM GROWTH
The discussion of co-packaged optics was constructive but more measured than a simple replacement narrative. Management expects pluggable optics to remain prevalent during the 1.6T generation and sees CPO becoming more important as architectures migrate toward 3.2T and 400G SerDes.
This distinction matters for the timing of investment returns. Celestica’s near-term growth does not require an immediate industry-wide shift away from pluggable transceivers. Existing pluggable technologies, new high-density form factors, near-packaged optics, and CPO can coexist across different architectures and serviceability requirements.
The DS6005 and the awarded hyperscaler rack-scale CPO program demonstrate progress beyond conceptual R&D. Management described a functional platform using Broadcom Tomahawk 6 Davisson silicon and ongoing testing. Nevertheless, production for the named hyperscaler CPO program is scheduled to ramp in late 2027. Its larger economic significance is therefore more likely to emerge in 2028 and subsequent periods than in current-quarter earnings.
The manufacturing challenges are consequential. Optical assembly requires cleanliness, precision alignment, reliable fiber insertion, inspection, thermal integration, and manufacturing yields that are commercially acceptable at scale. A functioning prototype is not equivalent to a high-yield production process. These challenges can create barriers to entry, but they can also create launch expense, scrap, rework, and warranty exposure.
Celestica’s strategy of supporting multiple optical architectures reduces the risk of committing exclusively to a premature technology transition. It also increases the number of development and qualification paths that must be funded. The value of the strategy depends on reusable engineering and manufacturing capabilities, not simply on participating in every emerging standard.
CUSTOM COMPUTE AND OPENAI: GREATER SYSTEM CONTENT, WITH TECHNICAL AND CREDIT CONCENTRATION
The custom compute opportunity is strategically important because it extends Celestica’s role from networking platforms into more comprehensive rack-scale systems. Management identified Google TPU programs and OpenAI’s Jalapeño platform as major 2027 growth drivers. These named relationships provide more concrete support than general commentary about hyperscaler capital spending.
The OpenAI engagement reportedly includes co-design, engineering, software, testing, and manufacturing, following more than 2 years of development. The architecture combines high-density accelerator racks, a cabled backplane, liquid cooling, and Ethernet scale-up connectivity extending across multiple racks. This is materially broader than contract assembly of a customer-specified server.
The economic benefit is the possibility of more content per deployment, deeper integration into successive generations, and higher switching costs associated with validated system designs. The corresponding risks are greater design responsibility, more complex acceptance criteria, potential customer-specific assets, and larger working-capital exposure during production ramps.
OpenAI’s August 25, 2026 benchmark disclosure supports the technical rationale but requires careful interpretation. OpenAI reported approximately 1.5x to 1.9x higher peak throughput per watt across 3 tested open models against the selected comparison systems. The comparisons normalized power using published accelerator package ratings rather than measured whole-facility electricity consumption.
These are customer-reported benchmark results, not independent proof of superior economics across every workload. They do not establish full-system acquisition cost, production yield, software portability, utilization, or performance against subsequent competing hardware. They also do not establish the commercial margin Celestica will earn.
OpenAI’s earlier plan to begin deployment by the end of 2026 and Celestica’s H2-weighted 2027 manufacturing ramp are not necessarily inconsistent. Initial deployment, qualification systems, and large-scale revenue production can occur at different times. The available disclosures do not by themselves establish a schedule delay.
Management’s industry forecasts for a custom accelerator market exceeding $430 billion by 2030 should not be treated as Celestica’s directly addressable revenue. Accelerator silicon value, networking content, rack integration, customer-owned components, and Celestica-recognized revenue have different boundaries. The call does not disclose enough procurement and consignment detail to convert accelerator-market spending into a reliable Celestica revenue-per-system model.
COMPETITIVE POSITION: DESIGN AND MANUFACTURING ARE MUTUALLY REINFORCING
The strongest element of the competitive argument is the integration of system design with manufacturing industrialization. Early collaboration between engineering and factory teams can reduce redesigns, improve first-pass yields, and shorten the transition from prototypes to volume production. Those advantages become more valuable when customers are attempting simultaneous transitions in silicon, networking, power delivery, cooling, and rack architecture.
Management also emphasized that high-speed networking expertise can be transferred into broader system design. This is plausible because signal integrity, board materials, thermal management, optics, testing, and software integration are increasingly interconnected at the rack level. However, the claim that moving from networking into compute is easier than the reverse remains a management assessment, not a universal competitive law.
The company’s model can create customer switching costs without creating permanent exclusivity. Customers have incentives to maximize returns on co-investment, but they also have incentives to maintain supply-chain alternatives, negotiate pricing, and move mature products to other manufacturers. Management explicitly acknowledged that older products can be transferred away to preserve Celestica capacity for newer generations.
The competitive position therefore rests on repeated execution and continued technical relevance. Open architectures and SONiC can expand the addressable market for Celestica while also limiting proprietary software lock-in. The company is attempting to capture value through engineering, validation, customization, and manufacturing capability rather than ownership of a closed software ecosystem.
Direct read-throughs are strongest for the explicitly named relationships. The call corroborates demand for Broadcom networking silicon and custom accelerator ecosystems and provides evidence of progress in AMD’s Helios supply chain. It does not independently quantify incremental revenue for those suppliers or prove market-share losses at competing networking and compute vendors.
CAPACITY, POWER, AND EXECUTION RISK
The expansion plan is substantial. Celestica is increasing capacity in Texas, Thailand, Mexico, Malaysia, and Japan, while expanding power availability and automation. The geographic strategy supports customer requirements for domestic manufacturing, nearshoring, regional diversification, and supply-chain resilience.
Power availability is becoming part of manufacturing competitiveness. High-density rack validation, burn-in, and liquid-cooling infrastructure require more than additional floor space. Management indicated that the combination of power and manufacturing capability has helped win programs that competitors could not support on the required schedule.
Factory power should nevertheless be distinguished from end-customer data-center power. Celestica can successfully commission manufacturing capacity while a customer’s deployment is delayed by utility interconnection, cooling infrastructure, or site readiness. These are separate constraints that can affect revenue and inventory timing differently.
Capital expenditure is expected to increase from approximately $1 billion in 2026 to $1.5 billion to $2 billion in 2027. As a percentage of forecast revenue, this represents approximately 3.8% to 5.0% in 2027, compared with approximately 4.8% in 2026. The business is becoming much larger in absolute capital requirements, although the forecast does not require a dramatic further increase in capital intensity relative to revenue.
Management stated that the planned spending supports programs already awarded and capacity needs extending into 2028. This reduces speculative capacity risk, but it also means additional wins may require further investment. The current financing plan should not automatically be assumed to cover every opportunity in the sales pipeline.
The quarterly cash-flow statement also disclosed $238.3 million of unpaid property, plant, and equipment purchases at September 30, compared with $24.4 million a year earlier. These obligations matter for future liquidity, although they should not be added mechanically to the stated capital-expenditure outlook because they may already be included in planned cash payments.
Automation across tray production and rack assembly could improve labor productivity and quality, particularly in higher-cost locations. The principal uncertainty is whether those processes remain flexible enough to accommodate rapid architecture changes. Automation that performs well on a stable design can become less valuable if customer specifications change before investment recovery.
CASH FLOW: THE MOST IMPORTANT QUALIFICATION TO THE EARNINGS NARRATIVE
Reported Q3 free cash flow was $127.5 million, up from $88.9 million a year earlier. Year-to-date free cash flow was $412.5 million, up from $302.4 million. However, Q3 free cash flow represented only approximately 32% of adjusted net earnings, compared with approximately 49% a year earlier. Earnings growth is substantially outpacing free-cash-flow growth.
The company’s definition includes proceeds from certain asset sales. Q3 operating cash flow was $389.7 million, cash capital expenditures were $274.1 million, and asset-sale proceeds were $11.9 million. Operating cash flow less gross capital spending was therefore $115.6 million, compared with company-defined free cash flow of $127.5 million. The corresponding year-to-date measure excluding asset-sale proceeds was $389.5 million rather than $412.5 million.
More importantly, the filing disclosed a substantial increase in receivables monetization. Celestica sold approximately $1.2975 billion of receivables during Q3, and $700.8 million remained outstanding under its receivables-sale program at quarter-end. The comparable outstanding balance was zero at June 30. Proceeds from these sales are included in operating cash flow, and the sold receivables are removed from the balance sheet.
The $700.8 million outstanding balance was approximately 5.5x reported quarterly free cash flow. This does not make the reported cash flow incorrect, and the gross quarterly sales amount should not be subtracted mechanically because receivables can turn over within the period. It does mean that the headline free-cash-flow figure benefited materially from earlier monetization of customer receivables rather than solely from cash collection on the original payment schedule.
The program’s limit increased from $450 million to $1 billion in September. It is uncommitted, subject to customer limits, and may be terminated by the bank or the company on specified notice. The facility is consequently useful liquidity support, but it is not equivalent to permanently committed equity capital. It also introduces dependence on bank appetite and the creditworthiness of the underlying customers.
Supplier funding was another important source of support. During Q3, accounts receivable and inventory absorbed approximately $425 million and $1.108 billion, respectively, while accounts payable, accrued liabilities, provisions, and taxes payable provided approximately $1.494 billion. Reported net working-capital outflow was therefore only $62 million despite the inventory build.
For the year to date, working-capital changes were a $133.6 million cash source. This was possible because the $3.5905 billion increase in the relevant liability categories more than offset substantial growth in receivables and inventory. The cash-flow performance therefore reflects significant operating scale and effective funding management, but not a reduction in the absolute amount of capital required to support the business.
CASH-CYCLE IMPROVEMENT DOES NOT MEAN INVENTORY RISK HAS DECLINED
Cash-cycle days improved to 42 from 65 a year earlier and 47 in Q2. The components provide a more nuanced picture. Receivable days declined from 68 to 56 year over year, inventory days increased from 65 to 70, payable days increased from 54 to 74, and customer-deposit days declined from 14 to 10.
The improvement was therefore driven by lower reported receivable days and substantially longer payable days, not faster inventory turnover. Receivables sales also affect the receivable balance used in the calculation. The improvement should not be attributed entirely to faster underlying customer payments.
Inventory reached $4.5097 billion, increasing approximately $1.108 billion sequentially. Inventory turns declined to 5.2x from 5.6x a year earlier and 5.4x in Q2. This is consistent with preparation for major ramps, but it also increases exposure to schedule changes, component obsolescence, and customer-specific configurations.
Customer cash deposits for inventory increased to $560.7 million from $481.4 million in Q2. These deposits provide real protection and financing support, but they covered only approximately 12% of the quarter-end inventory balance. That does not imply the remainder is unprotected, since contractual purchase commitments and other arrangements may apply. It does establish that deposits alone do not fund or insure the entire inventory position.
At the 2027 revenue target, 1 additional receivable day would represent approximately $110 million of cash. Assuming an approximately 89% cost-of-sales ratio, 1 additional inventory day or 1 fewer payable day would represent approximately $98 million. A relatively modest deterioration in payment or inventory terms can therefore consume liquidity approaching $1 billion.
As an illustrative sensitivity, holding the current receivable, inventory, payable, and deposit-day relationships constant while revenue increases from $21 billion to $40 billion would require approximately $2.3 billion of additional operating working capital. This is not management guidance and does not incorporate the actual quarterly ramp profile, but it demonstrates why high profitability can coexist with negative cash generation.
EMPLOYEE EQUITY CASH REQUIREMENTS FURTHER REDUCE CASH AVAILABLE TO SHAREHOLDERS
The quarterly filing disclosed $47.3 million of Q3 cash payments for withholding taxes associated with vested employee equity awards and $37.6 million of treasury-share purchases for employee compensation delivery. Both are classified within financing activities and are outside company-defined free cash flow.
After these payments, Q3 free cash flow of $127.5 million left approximately $42.6 million before other financing items. For the year to date, withholding-related payments were $373.6 million and treasury-share purchases were $37.6 million. Together, those payments nearly equaled the $412.5 million of reported free cash flow.
These amounts are not an additional current-period compensation expense and should not be double-counted in an earnings model. They relate to settlement and withholding obligations associated with awards that can span multiple periods. They are nevertheless actual cash uses and materially affect the relationship between reported free cash flow and cash retained for shareholders.
This also qualifies the statement that no shares were repurchased during Q3. No shares were repurchased for cancellation under the normal course issuer bid, but shares were purchased for employee compensation delivery. The distinction is economically relevant.
The cash balance increased by $3.4256 billion during Q3, while net equity-offering proceeds were $3.3913 billion. Only approximately $34 million of the increase came from all other net cash movements. The stronger balance sheet was overwhelmingly created through external equity financing rather than retained quarterly cash generation.
2027 CASH USE AND THE CONDITIONAL 2028 RECOVERY
Full-year 2026 free-cash-flow guidance was reduced from $600 million to $460 million, a 23% reduction. With $412.5 million generated through Q3, the updated outlook implies approximately $47.5 million in Q4, equivalent to less than 1% of the revenue midpoint. This is a clear indication that the financing requirements of the next growth phase are already increasing.
Management stated that 2027 would involve a net use of cash and that “the level of net cash usage will be a function of the sheer magnitude and velocity of our revenue ramp.” This is a plausible explanation, but the absence of a quantified cash-use range remains a significant disclosure gap.
The CFO subsequently indicated a target to “return to positive cash flow in 2028.” The wording is appropriately conditional. It should not be converted into a firm free-cash-flow commitment or an assumption that all growth investment normalizes after 2027. Demand forecasts meaningfully above 2027 could sustain working-capital requirements and require further capacity.
The balance sheet currently provides substantial protection. Cash was approximately $3.96 billion, borrowings under the credit facility were approximately $736 million, and available revolver capacity was approximately $1.74 billion. Reported gross leverage of 0.4x indicates limited conventional debt exposure. There is no evidence in the reviewed disclosures of immediate financing distress.
However, the approximately $3.2 billion reported net-cash position is not equivalent to surplus distributable capital. It supports planned growth, excludes certain lease obligations from the debt comparison, and coexists with receivables monetization and significant future cash commitments. Geographic restrictions and tax considerations can also affect the speed at which cash can be redeployed across operating entities.
RETURN ON CAPITAL: STRONG, BUT DEFINITION AND TIMING MATTER
Adjusted ROIC increased to 64.7% from 37.5% a year earlier, while the year-to-date measure reached 56.7%. These are impressive company-defined operating returns and support the view that the existing asset base is being used productively.
The measure is not conventional after-tax ROIC. Celestica annualizes adjusted operating earnings and divides them by average net invested capital. Cash, right-of-use assets, and specified operating liabilities are excluded from invested capital. The metric therefore benefits from supplier funding, customer deposits, and reduced recognized receivables.
The newly raised cash is excluded from the denominator until deployed. Consequently, the current ROIC does not establish the return that shareholders will ultimately earn on the full equity issuance. Returns on the incremental capital will depend on the conversion of cash into working capital and fixed assets, followed by successful production and collection.
The quarter’s high earnings run rate is also annualized against an average capital base that precedes much of the planned expansion. A lower ROIC during capacity commissioning would not necessarily indicate a broken strategy, while an elevated current ROIC should not be interpreted as proof that every incremental project will earn comparable returns.
CAPITAL ALLOCATION AND THE BUYBACK QUESTION
The August offering issued approximately 11.1 million shares for $3.45 billion of gross proceeds and approximately $3.39 billion of net proceeds. It reduced financing risk and created capacity to fund growth, but permanently increased the share base unless subsequently offset.
The proposed normal course issuer bid should be interpreted as an authorization mechanism, not a commitment to meaningful capital return. The written earnings release described an intention to seek permission to repurchase up to 2.5% of the public float, subject to TSX acceptance. That status is more precise than treating the program as an already executed buyback plan.
Management appropriately identified organic growth as the priority. Repurchasing a substantial amount of stock immediately after raising equity would require a strong valuation justification and confidence that operating liquidity remained ample. No such quantified repurchase commitment was provided.
Capability-oriented acquisitions could be strategically sensible where they accelerate engineering, optical manufacturing, power, cooling, or other bottleneck capabilities. However, the call did not provide a defined acquisition budget. The claim that the company can support both growth and acquisitions remains dependent on transaction size, funding terms, and actual cash absorption.
CUSTOMER CONCENTRATION AND COUNTERPARTY CREDIT
The 3 largest customers represented 35%, 17%, and 14% of quarterly revenue, or 66% in aggregate. The comparable concentration was 59% a year earlier. The top 10 customers represented 85% of revenue, compared with 80% a year earlier. Revenue diversification has therefore deteriorated despite a broader program portfolio.
The largest customer alone represented approximately $2 billion of quarterly revenue. The disclosures do not identify which named customer corresponds to each percentage, and assigning those shares to Google, OpenAI, or another company would be unsupported.
More products within the same customer can reduce dependence on a single architecture while leaving counterparty and capital-budget concentration largely unchanged. Similarly, exposure to multiple hyperscalers can still remain highly correlated through power constraints, accelerator supply, AI monetization, and investor willingness to fund infrastructure.
Management stated that customers are well funded and that liquidity, third-party support, and contractual backstops are reviewed. That is reassuring but not equivalent to public disclosure of enforceable guarantees. The call did not specify obligors, guarantee limits, termination provisions, reimbursement rights, or the priority of Celestica’s claims.
The distinction is particularly important for rapidly expanding frontier AI labs. Strong access to funding today does not ensure that every future hardware commitment is fully financed or protected against cancellation. Credit monitoring should focus on the entity responsible for payment and the recoverability of customer-specific inventory and assets, not simply on the strategic importance of the end platform.
INVESTMENT SCENARIOS AND VALUATION DISCIPLINE
Confidence is high that Q3 demonstrated genuine operating growth and stronger manufacturing execution. Confidence is moderate that the awarded program portfolio can support the broad direction of the 2027 expansion. Confidence is lower in the precise timing of revenue conversion, the magnitude of cash use, and the valuation multiple that the market will assign during a negative-free-cash-flow investment phase.
An illustrative base case, assigned a 50% probability, assumes $40 billion of 2027 revenue, a 9% adjusted operating margin, a 21% tax rate, and 127 million diluted shares. A balancing net non-operating expense assumption of approximately $144 million reconciles those inputs to management’s $21.50 EPS outlook. Successful execution would validate the larger earnings base, while the principal remaining debate would concern 2028 cash conversion and growth durability.
An illustrative bull case, assigned a 25% probability, assumes $45 billion of revenue and a 9.5% operating margin, with the same tax, share-count, and net non-operating expense assumptions. Adjusted EPS would be approximately $25.70. This outcome requires stronger throughput on existing awards, better supply availability, favorable mix, and limited launch inefficiencies. It does not require assigning revenue to unidentified speculative wins.
An illustrative bear case, assigned a 25% probability, assumes $32 billion of revenue and a 7.5% operating margin. Under the same remaining assumptions, adjusted EPS would be approximately $14.04. Revenue would still grow approximately 52% over the 2026 outlook, demonstrating that a large earnings disappointment can occur without a collapse in AI infrastructure demand. Delayed ramps, underabsorbed capacity, and unfavorable mix would be sufficient.
For an illustrative 12- to 18-month valuation framework, 25x base-case EPS implies approximately $538 per U.S.-listed share, 30x bull-case EPS implies approximately $771, and 18x bear-case EPS implies approximately $253. The probability-weighted value is approximately $525. These multiples and probabilities are analytical assumptions, not management guidance, verified peer-derived targets, or statistically calibrated forecasts.
At an entry price of $430, equivalent to 20x guided 2027 EPS, that framework implies approximately 22% probability-weighted upside but approximately 41% downside in the bear case. The asymmetry supports valuation discipline and restrained sizing rather than a conclusion that rapid earnings growth automatically creates an attractive investment at any price. A contemporaneous share price was not established in the reviewed source set, so this is a conditional entry framework rather than a claim about current trading value.
RECOMMENDATION, CATALYSTS, AND THESIS INVALIDATION
The recommended stance is to retain a positive fundamental bias while making additional purchases conditional on valuation and cash-flow evidence. Entry around or below 20x guided 2027 EPS provides a more defensible margin of safety than paying a substantial premium for an execution path that still requires extraordinary production scaling. A materially higher valuation would require stronger evidence of cash conversion, contractual protection, and sustained earnings beyond the initial 2027 forecast.
For a diversified portfolio, an illustrative initial allocation of 0.5% of NAV, with a maximum of 1% before stronger ramp and cash-flow confirmation, is consistent with the concentration and execution risks. A 15% price stop would imply planned losses of approximately 7.5 to 15 basis points of NAV, although gaps can exceed that amount. The approximately 41% bear-case decline from the illustrative entry would imply roughly 21 to 41 basis points of NAV exposure at those position sizes.
The position should be counted as additional AI infrastructure and hyperscaler capital-spending exposure, not as diversification simply because Celestica is classified as a manufacturing company. Correlation is likely to be meaningful with custom semiconductor, networking, optical, power, and data-center infrastructure holdings. Exact portfolio concentration cannot be assessed without the holdings and factor exposures.
The next major catalyst is Q4 delivery and the associated update on the opening 2027 production trajectory. Subsequent catalysts include evidence that 1.6T revenue is scaling alongside continued 800G growth, successful commissioning of manufacturing and power capacity, the H2 OpenAI production ramp, and late-2027 CPO qualification and manufacturing progress. The critical financial catalyst is a quantified route to positive cash generation in 2028.
The thesis would require immediate reassessment following a material reduction in awarded-program volumes, a major ramp slipping beyond its expected year, declining gross margins without compensating operating leverage, or a deterioration in customer credit protection. A reduction exceeding approximately 10% in the 2027 revenue outlook, persistent operating margins below approximately 8.5% despite higher volume, or unexpected equity issuance to fund operating shortfalls would be particularly significant warning signs.
A return to positive company-defined free cash flow would be necessary but not sufficient confirmation. The stronger validation would be positive cash generation with stable receivables-sale balances, sustainable supplier terms, manageable employee equity cash requirements, and no deterioration in customer-payment quality.
The decisive conclusion is that Celestica’s earnings opportunity has expanded faster than its demonstrated ability to self-fund that opportunity. The call provides credible evidence of differentiated capabilities and a substantially larger addressable production base. The investment outcome will depend on converting that technical and commercial position into repeatable margins, recoverable working capital, and cash available to shareholders.
SOURCE AND TRANSCRIPT QUALIFICATIONS
Sources include the October 27, 2026 earnings and investor-day transcript; Celestica’s October 26, 2026 earnings release and financial reconciliations; the Form 10-Q for the quarter ended September 30, 2026; the Q2 2026 earnings announcement reproduced by EMSNow; Celestica’s DS6010 product documentation; OpenAI’s August 25, 2026 Jalapeño benchmark disclosure; and the supplied Bloomberg earnings notice. Dollar amounts are in U.S. dollars unless otherwise indicated. Financial forecasts and market-size estimates remain management or third-party projections. Scenario probabilities, valuation multiples, and risk limits are analytical assumptions.
The transcript contains technical interruptions, a truncated response to David Vogt, and an unidentified transition into a question addressed to “Kevin.” Missing content has not been reconstructed. The Wolfe Research question was asked by a speaker identified as “Taron,” on behalf of George Notter. Full identities not established by the transcript are identified accordingly below.
COMPANY EMPLOYEES ON THE CALL
• Matthew Pallotta, Head of Investor Relations. • Rob Mionis, Chair of the Board and Chief Executive Officer. • Todd Ankenmann, Chief Financial Officer. • Mandeep Chawla, Group President, Global Markets. • Steven Dorwart, President, Connectivity and Cloud Solutions. • Todd Cooper, President, Advanced Technology Solutions. • Gavin Cato, Senior Vice President, CCS Engineering.
RESEARCH ANALYSTS ON THE CALL
• David Vogt, UBS. • Kevin, surname and firm not established in the available transcript. • Joseph Cardoso, JPMorgan. • Karl Ackerman, BNP Paribas. • Mehdi Hosseini, Susquehanna International Group. • John Shao, TD Cowen. • Daniel Zhu, Bernstein. • Michael Ng, Goldman Sachs. • Ruben Roy, Stifel. • Thanos Moschopoulos, BMO Capital Markets. • Taron, surname not established, Wolfe Research, speaking on behalf of George Notter. • Steven Fox, Fox Advisors LLC. • Ruplu Bhattacharya, Bank of America. • Todd Coupland, CIBC. • Robert Young, Canaccord Genuity. • Paul Treiber, RBC Capital Markets.
Key Read-Throughs
KEY READ-THROUGHS FROM CELESTICA’S Q3 2026 EARNINGS CALL AND INVESTOR DAY
Celestica’s call strengthens the outlook for AI infrastructure spending while providing more differentiated signals about where economic value will accrue. The most important developments are Ethernet’s expansion into scale-up networking, commercially meaningful alternatives to proprietary GPU systems, continued growth in pluggable optics, and rising requirements for liquid cooling and power infrastructure. The principal negative implications concern incumbent suppliers’ share of incremental spending and the cash required to finance extraordinary hardware growth. The $40 billion 2027 revenue outlook is evidence of substantial awarded manufacturing activity, not an equivalent increase in industry capital expenditure or a guarantee of revenue for every associated supplier. The highest-conviction conclusions favor companies with identifiable product exposure, while distinguishing established relationships from unallocated market opportunities. Country labels below indicate corporate domicile. Impact assessments describe fundamental exposure, not assumed share-price reactions.
AI SEMICONDUCTORS AND ACCELERATED COMPUTE
BROADCOM CAN MONETIZE BOTH CUSTOM ACCELERATORS AND THE NETWORKS CONNECTING COMPETING COMPUTE PLATFORMS (READ-THROUGH 1)
Affected company: Broadcom (AVGO: United States). Direction: strongly positive. Magnitude: potentially large at the consolidated-company level, with high confidence in the commercial transmission mechanism but no defensible incremental revenue estimate from this call alone.
Celestica identified Broadcom silicon in several distinct architectures. OpenAI’s Jalapeño accelerator was co-developed with Broadcom, its scale-up fabric uses Tomahawk 6 switches, and AMD’s Helios scale-up switch incorporates 2 Tomahawk 6 chips. Celestica also disclosed 10 awarded 1.6T programs, including 4 scale-up and 6 scale-out programs, and expects 1.6T revenue to exceed 800G revenue in 2027 while 800G continues growing.
The critical implication is that Broadcom’s opportunity is broader than custom accelerators replacing merchant GPUs. Broadcom can capture accelerator revenue where it participates in custom silicon and networking revenue where the compute platform belongs to another supplier. AMD’s success can therefore benefit Broadcom rather than simply redistribute spending away from it. Ethernet entering scale-up adds another addressable network layer beyond conventional scale-out fabrics.
This matters financially because AI semiconductor revenue already represented approximately 56% of Broadcom’s latest reported quarterly revenue: $16.7 billion out of $29.6 billion. Celestica’s disclosure is therefore relevant to a major earnings driver, not a peripheral product category. However, Broadcom had already disclosed exceptional AI growth and substantial forward demand. The new information is additional evidence that downstream systems and manufacturing capacity are progressing toward deployment, not the discovery of previously unknown customer relationships.
Near-term trading relevance centers on Broadcom’s next guidance update and evidence that system production schedules support semiconductor shipment assumptions. The larger fundamental benefit falls in 2027 and 2028 as Ethernet scale-up and successive custom accelerator generations expand. The principal risk is correlated dependence on the same deployment schedules: accelerator silicon and networking content are separate revenue opportunities, but they are not independent demand exposures. They can both be delayed by customer power, financing, or system-qualification constraints.
NVIDIA FACES A MORE CREDIBLE CHALLENGE TO INCREMENTAL INFERENCE SPENDING AND FULL-SYSTEM ECONOMICS (READ-THROUGH 2)
Affected company: NVIDIA (NVDA: United States). Direction: negative for long-duration share and pricing assumptions, not evidence of an immediate revenue contraction. Magnitude: strategically large, but the near-term earnings impact is unquantified.
Celestica described an OpenAI system combining custom accelerators, Ethernet scale-up, software, liquid cooling, and rack-scale manufacturing. The network can support a scale-up domain of up to 2,048 accelerators. Management also identified Google TPU programs as a major growth driver and characterized Jalapeño as its most comprehensive and complex design engagement.
The important competitive development is not simply another accelerator chip. It is the emergence of a more complete alternative system capable of addressing the integration challenges that historically reinforced NVIDIA’s position. Commercially useful alternatives require networking, thermal management, software, validation, and reliable volume manufacturing in addition to silicon performance. Celestica’s expanded role provides evidence that these complementary capabilities are becoming available outside NVIDIA’s integrated architecture.
The transmission mechanism is reduced dependence on NVIDIA for selected incremental workloads. Successful alternatives can improve customer bargaining power over accelerator pricing and the associated networking and system package. The potential pressure is greatest where workloads are sufficiently predictable and deployment volumes sufficiently large to justify custom designs. It does not imply equivalent competitive pressure across training, general-purpose acceleration, and every inference workload.
The benchmark evidence must remain narrowly interpreted. OpenAI’s published Jalapeño results showed favorable performance across specified models against selected comparison systems, using accelerator package-power normalization. They did not establish superiority across all workloads or against every subsequent NVIDIA generation. NVIDIA’s latest reported data-center revenue was still growing exceptionally rapidly, and its product roadmap continues to advance.
Near-term catalysts are additional alternative-platform qualification and deployment disclosures, which can affect expectations for NVIDIA’s terminal share before materially affecting current earnings. The substantive earnings test is the 2027 and 2028 allocation of incremental inference capacity. The high-conviction negative conclusion concerns the credibility of competing systems, not a near-term NVIDIA earnings miss or a blanket short thesis.
AMD’S HELIOS EXECUTION RISK IS DECLINING AS THE NETWORKING SUPPLY CHAIN BECOMES MORE CONCRETE (READ-THROUGH 3)
Affected company: Advanced Micro Devices (AMD: United States). Direction: positive. Magnitude: material to the credibility of the data-center accelerator growth trajectory, with limited evidence for changing the immediately upcoming quarter’s estimates.
Celestica’s DS6010 was co-engineered for AMD’s Helios architecture and supports connectivity among 72 MI455X GPUs within a rack. The switch combines 204.8 Tbps of aggregate switching capacity, a high-density cabled backplane, liquid cooling, and SONiC integration. Celestica stated: “We expect to begin ramping by the end of the year.”
This is valuable because competitive accelerator silicon is insufficient if complete systems cannot be qualified, produced, and deployed reliably. Celestica’s disclosure provides evidence of progress in a critical complementary subsystem and its manufacturing process. Successful switch production reduces a potential bottleneck between AMD’s product roadmap and customer deployments.
The longer-duration benefit is an increasingly capable open ecosystem around AMD’s accelerators. Customers gain a more credible alternative to buying an entirely proprietary system, while AMD can rely on specialist partners for selected networking and rack-integration functions. The same disclosure also makes clear that AMD does not capture all system value: Broadcom supplies the switch silicon, and Celestica supplies substantial engineering and manufacturing content.
AMD’s November 3 results are a near-term catalyst for confirming Helios production timing, customer acceptance, and the relationship between initial shipments and meaningful revenue. Celestica’s anticipated year-end switch ramp should not be translated automatically into a large December-quarter AMD revenue contribution. The greater fundamental effect is in 2027.
The key invalidation risk is that networking readiness proves insufficient to overcome constraints elsewhere, including software, accelerator qualification, memory, cooling, or customer-site readiness. The call supports reduced integration risk, not a conclusion that every element of the deployment path is complete.
OPTICAL COMMUNICATIONS
THE 1.6T UPGRADE EXTENDS THE PLUGGABLE OPTICS OPPORTUNITY RATHER THAN IMMEDIATELY DISPLACING IT (READ-THROUGH 4)
Affected company: Coherent (COHR: United States). Direction: positive. Magnitude: potentially large because data-center and communications products constitute the majority of company revenue. Confidence is high in the technology-cycle implication, but Celestica did not identify Coherent as the supplier to a specific awarded program.
The most actionable optical commentary was that “pluggables remain in the 1.6 timeframe,” with CPO expected to become more prominent at 3.2T and 400G SerDes. Celestica simultaneously expects continued 800G growth and 1.6T revenue to overtake 800G in 2027. Its named hyperscaler CPO program is scheduled to ramp only in late 2027.
The implication is a longer and potentially larger commercial window for high-speed pluggable transceivers than a rapid-displacement narrative would suggest. Coherent has identifiable exposure through its 1.6T optical-module portfolio, including 8x200G products. Continued shipments across multiple speed generations can support production scale, manufacturing utilization, and investment recovery before integrated optics becomes more prevalent.
The exposure is financially meaningful. Coherent’s latest reported quarterly data-center and communications revenue was approximately $1.615 billion out of approximately $2.05 billion of total revenue. Celestica’s commentary therefore corroborates an important demand driver rather than merely validating a small development program.
The November 4 earnings report is the next trading catalyst, particularly commentary on 1.6T shipments, manufacturing capacity, yields, and the continuation of 800G demand. This is not a new program award for Coherent and does not establish a specific revenue beat. Optical-port counts, copper connections, supplier allocations, and realized prices are not disclosed sufficiently to construct that bridge.
The longer-duration implication is coexistence rather than an abrupt technology substitution. CPO changes where optical functions reside; it does not eliminate the need for photonics. The risk is that supplier-specific qualification, yield, or component constraints prevent Coherent from converting industry demand into shipments. A favorable market transition cannot compensate automatically for poor execution.
NETWORKING SYSTEMS AND SOFTWARE
CUSTOM SCALE-UP DESIGNS CHALLENGE AUTOMATIC OEM SHARE ASSUMPTIONS, BUT DO NOT ESTABLISH ARISTA DISPLACEMENT (READ-THROUGH 5)
Affected company: Arista Networks (ANET: United States). Direction: negative for assumptions of automatic share capture and proprietary software attachment in the fastest-growing network layers. Magnitude: moderate strategic risk to the AI growth opportunity; no high-conviction near-term earnings reduction follows from this call.
Celestica described its joint design and manufacturing model as an increasingly “preferred approach to product development” for hyperscalers and frontier AI labs. It cited 58% share of custom Ethernet switch revenue and emphasized customized SONiC software across its networking platforms. The Helios and Jalapeño programs demonstrate that sophisticated scale-up systems can be delivered through direct customer, semiconductor, and manufacturing partnerships.
The transmission mechanism is customer procurement shifting toward designs that do not require a conventional branded network-system sale with a proprietary software stack. Ethernet adoption can therefore increase semiconductor and manufacturing revenue without producing equivalent revenue for branded networking vendors. Market growth and vendor share must be modeled separately.
The important counterevidence is Arista’s own October 7 announcement of rack-scale scale-up and scale-out architectures. Its SU-144 offering, cross-rack designs, liquid-cooling capabilities, and support for either EOS or an open network operating system demonstrate an active competitive response. Arista is not confined to traditional front-panel switching or excluded from open architectures.
Accordingly, the high-conviction negative is a limitation on aggressive market-share and software-attachment assumptions, not proof that Arista is losing existing accounts. The upcoming earnings and product-ramp updates are the near-term catalysts for determining which architecture announcements are converting into commercial deployments.
Over 2027 through 2029, the key issue is whether Arista earns differentiated economics from software, operational reliability, and system integration when customers have credible custom alternatives. The competitive concern would weaken if Arista demonstrates substantial scale-up wins with attractive economics. Celestica’s success alone is insufficient evidence for an Arista short position.
POWER DISTRIBUTION AND THERMAL MANAGEMENT
RISING RACK DENSITY CREATES ARCHITECTURE-AGNOSTIC DEMAND FOR ADVANCED POWER AND LIQUID COOLING (READ-THROUGH 6)
Affected companies: Vertiv (VRT: United States) and Eaton (ETN: Ireland). Direction: positive. Magnitude: high fundamental relevance for Vertiv and material relevance for Eaton’s electrical businesses, with a smaller proportional effect on Eaton’s diversified consolidated portfolio.
Celestica is engineering systems approaching 500 kW or more per rack, supporting a transition toward 800 VDC distribution, and evaluating liquid cooling beyond accelerator and switch chips to include memory and optics. Management also described adding hundreds of megawatts of power availability across its manufacturing network.
The important implication is that infrastructure complexity rises across competing compute architectures. These requirements are not dependent on NVIDIA retaining every accelerator sale. AMD, Google TPU, and OpenAI custom systems also require power conversion, protection, distribution, cooling, commissioning, and service. This makes advanced electrical and thermal infrastructure a less architecture-specific exposure than individual accelerator suppliers.
Vertiv’s published 800 VDC work emphasizes new requirements for DC protection, fault management, grounding, maintenance, and service capability. Eaton’s architecture materials similarly address higher-voltage distribution, modular power systems, and cooling integration. These are identifiable capabilities aligned with the requirements Celestica described. Neither company was named as the supplier to a particular Celestica program.
Vertiv’s October 28 earnings report is an immediate trading catalyst for orders, backlog conversion, manufacturing capacity, and cooling-related margins. The longer-duration opportunity lies in 2027 and 2028 deployments and the associated service requirements. Celestica’s production plans support the demand direction but do not establish a specific order award or quarterly earnings surprise.
The economic model should not assume that every component gains content per megawatt. Higher-voltage architectures can reduce current, conductor requirements, and selected conversion stages. Value is likely to migrate toward qualified system solutions, protection, controls, cooling, and service rather than rise uniformly across all legacy products.
Geographically, Celestica’s investment in Texas and Thailand reinforces demand for infrastructure support across both North American and Asian production networks. Factory testing power and end-customer data-center power remain separate requirements. Conflating them would overstate downstream deployment capacity.
CLOUD PLATFORMS AND AI CAPITAL SPENDING
GOOGLE’S TPU ROADMAP GAINS SUPPLY-SIDE VALIDATION, WHILE THE CASH-REINVESTMENT BURDEN REMAINS SUBSTANTIAL (READ-THROUGH 7)
Affected company: Alphabet (GOOGL: United States). Direction: positive for long-term compute availability and strategic control; negative for assumptions of rapid capital-spending normalization and near-term free-cash-flow recovery. Magnitude: material to Google Cloud and consolidated capital allocation.
Celestica identified its “multi-generational relationship with Google in support of their TPU platform” as a major driver of expected custom compute growth. It also stated that awarded-program demand for 2028 is meaningfully above the 2027 revenue outlook. This provides supply-chain corroboration that custom compute investment extends beyond the current product cycle.
The positive transmission mechanism is greater access to workload-optimized infrastructure under Google’s control. Successful TPU production can increase available capacity for internal AI services and external cloud customers while reducing dependence on the commercial terms and deployment schedules of merchant accelerators. More control over hardware, software, and workload optimization can improve long-term unit economics.
The financial timing is less favorable. Hardware delivery generally requires capital spending before the associated cloud revenue and utilization fully mature. Depreciation begins as assets enter service, while power, networking, and operating expenses also increase. Lower cost per unit of computation does not necessarily reduce aggregate spending when usage expands faster than efficiency improves.
Alphabet’s already-reported Q2 results illustrate this distinction. Google Cloud revenue increased 82% to approximately $24.8 billion, with approximately $8.8 billion of operating income. Nevertheless, consolidated capital spending of approximately $44.9 billion exceeded operating cash flow of approximately $39.1 billion, producing approximately $5.9 billion of negative quarterly free cash flow. Celestica’s call corroborates an extended investment cycle; it does not newly reveal those previously reported cash pressures.
The upcoming Alphabet earnings update is the near-term catalyst for capacity availability, capital commitments, utilization, and cash conversion. The longer-duration benefit depends on whether deployed TPU capacity earns adequate returns rather than merely increasing supply. No conclusion follows from this call that Google has raised its formal capital budget by a specific amount.
SEMICONDUCTOR CAPITAL EQUIPMENT
THE ATS ACCELERATION CORROBORATES EQUIPMENT-DEMAND DURABILITY, BUT IS NOT A NEW 40% GROWTH FORECAST FOR EQUIPMENT SUPPLIERS (READ-THROUGH 8)
Affected company: Lam Research (LRCX: United States). Direction: positive. Magnitude: meaningful support for the durability of the equipment cycle, but modest incremental information for near-term estimates because Lam has already reported strong results.
Celestica’s ATS revenue increased 23%, exceeding its mid-teens expectation, primarily because capital equipment accelerated. Management cited forecasts for wafer-fab-equipment spending to grow by more than 40% in 2027, with continued strength in 2028, and described strong relationships with leading equipment OEMs.
The mechanism is straightforward but sequential. More accelerator and memory capacity requires semiconductor manufacturing investment. Greater process complexity also increases the importance of deposition, etch, and other manufacturing steps. Equipment makers then require more components, assemblies, and manufacturing capacity from their supply chains. Celestica’s capital-equipment activity provides corroboration that the investment cycle is reaching manufacturing orders rather than remaining only a demand forecast.
Lam’s October 21 report had already disclosed record quarterly revenue of approximately $8.22 billion and a 40.2% non-GAAP operating margin. Celestica’s call therefore cannot be treated as a prediction of that completed earnings beat. Its incremental relevance is confidence in the persistence of demand into 2027 and 2028.
The quoted industry-growth forecast should not be transferred directly to Lam’s revenue model. Equipment-category exposure, customer geography, service revenue, export controls, manufacturing constraints, and recognition timing determine company performance. Celestica did not identify the OEMs responsible for its specific acceleration, so this is not evidence of a new Lam contract.
The near-term catalyst is subsequent equipment-order and shipment guidance rather than the already-reported September quarter. The longer-duration positive is sustained investment in advanced semiconductor capacity. The principal risk is timing: supplier activity can support equipment already ordered, while cleanroom availability, installation, and customer commissioning still constrain later revenue conversion.
ELECTRONICS MANUFACTURING AND CAPITAL ALLOCATION
AI MANUFACTURING GROWTH SHOULD BE VALUED BY CASH CONVERSION, NOT BY APPLYING A COMMON MULTIPLE TO REVENUE ACCELERATION (READ-THROUGH 9)
Affected companies: Jabil (JBL: United States) and Celestica (CLS: Canada). Direction: positive relative support for Jabil’s cash-generation profile; negative for treating Celestica’s earnings expansion as immediately distributable cash. Magnitude: material to valuation, financing risk, and portfolio construction.
Celestica expects approximately $19 billion of incremental revenue in 2027, $1.5 billion to $2 billion of capital expenditure, and additional working-capital investment. Management stated: “The combination of these investments will result in a net use of cash in 2027.” The target to return to positive cash flow in 2028 remains conditional.
The accompanying filing strengthens the distinction between earnings and internally generated funding. Celestica had $700.8 million of sold receivables outstanding at September 30, while reported Q3 free cash flow was $127.5 million. Supplier liabilities also provided substantial funding. These are legitimate financing mechanisms, but they show that rapid earnings growth does not eliminate reliance on external capital and favorable working-capital terms.
Jabil’s already-published fiscal 2027 outlook presents a different profile: approximately $44.5 billion of revenue, 24% growth, and approximately $1.6 billion of adjusted free cash flow. Jabil is therefore also participating in substantial infrastructure growth while forecasting continued cash generation. Celestica’s cash-use outlook should not be generalized into a conclusion that every AI manufacturing supplier must become cash-flow negative.
The comparison is not perfectly like-for-like. Fiscal periods, product mix, customer terms, capital ownership, growth rates, and free-cash-flow definitions differ. Jabil’s lower growth rate also imposes a smaller incremental funding requirement. The valid implication is that capital efficiency and contract structure deserve a separate valuation assessment from revenue growth and adjusted operating margin.
Near-term catalysts are working-capital movements, receivables-sale balances, customer deposits, and revised capital-spending forecasts at both companies. The longer-duration test is cash retained after growth investment and employee-equity obligations. Celestica could ultimately justify superior economics if its design-led investments generate durable returns, but current ROIC and EPS growth do not establish that outcome in advance.
The geographic read-through is regionalization rather than a wholesale exit from Asia. Celestica is expanding both Texas and its established Asian network. Manufacturing advantage increasingly depends on the ability to combine engineering, available power, regional capacity, and customer qualification. The call does not establish that an unrelated manufacturer will win business simply because it owns facilities in a favored country.
CROSS-PORTFOLIO IMPLICATIONS
The clearest positive read-throughs are Broadcom’s participation across multiple compute ecosystems, Coherent’s extended high-speed pluggable opportunity, and the architecture-independent requirements supporting advanced power and cooling. AMD benefits from more concrete system-readiness evidence. The strongest negative implications concern NVIDIA’s long-term share of incremental inference spending, unearned assumptions of automatic branded-networking participation, and the financing burden of rapid manufacturing expansion.
These exposures remain highly correlated. Broadcom, Coherent, Vertiv, Eaton, Lam, Jabil, and Celestica can all benefit from the same infrastructure cycle, but they can also be affected simultaneously by deployment delays or weaker capital availability. Owning different layers of the supply chain does not necessarily diversify the underlying spending factor. Likewise, stronger supplier revenue can coincide with weaker customer free cash flow before the installed infrastructure produces adequate returns.
No company-specific upgrade is warranted from this call alone for unnamed memory, substrate, connector, automation, defense, or healthcare suppliers. The transcript does not establish the supplier allocations or revenue exposure required for high-conviction conclusions. The retained findings are grounded in the October 27 Celestica call, its accompanying financial disclosures, and the relevant companies’ published earnings and product materials available by that date.
Report record
- Sector
- Information Technology
- Industry
- Electronic Equipment, Instruments & Components
- Fiscal period end
- September 30, 2026
- Report date
- October 26, 2026
- Analysis
- 7900 words
- Read-throughs
- 3308 words
- Content fingerprint (PDF)
dea478167ba9- Content fingerprint (analysis)
25772391b298- Content fingerprint (read-throughs)
8743a6f05cee
Prepared from the company's earnings release and earnings call transcript. Figures as reported by the company. For information only. Not investment advice.
More from Celestica Inc.
No other reports yet.
More in Information Technology
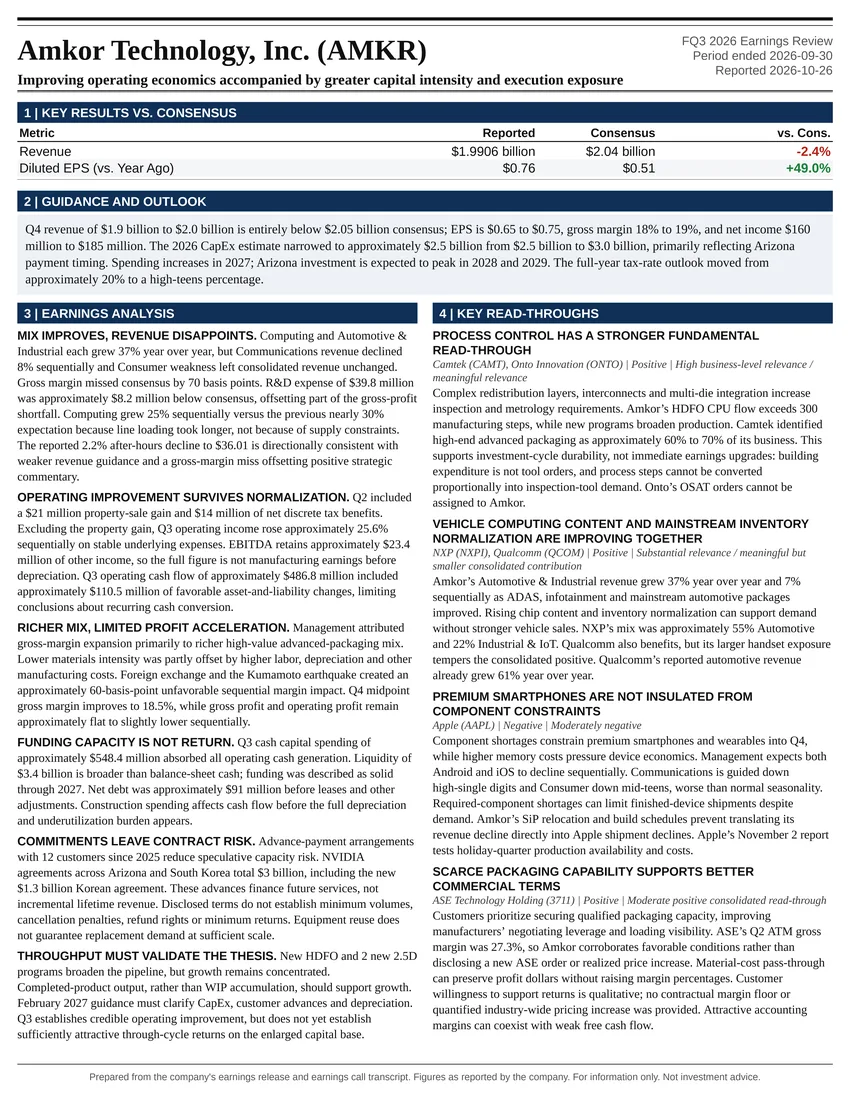
Improving operating economics accompanied by greater capital intensity and execution exposure
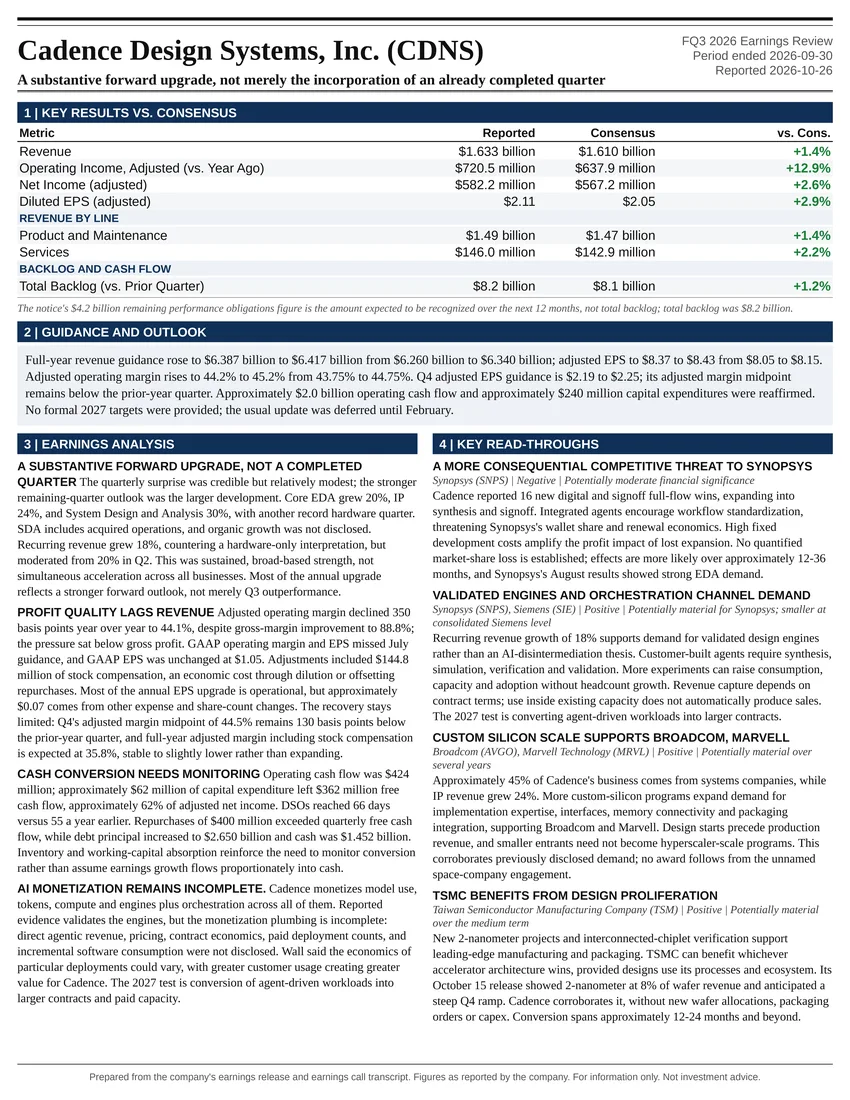
A substantive forward upgrade, not merely the incorporation of an already completed quarter
All Information Technology reports
Follow @AtlasPeakRes on X for new earnings reports as they publish.