AI Participation Is Proven; a Consolidated Growth Inflection Is Not
Earnings Reports
International Business Machines Corporation FQ3 2026 Earnings Report
International Business Machines Corporation (IBM) FQ3 2026 earnings: Software Recovery Cuts Downside Risk, but a Higher Organic Growth Regime Is Not Yet Proven. Full earnings analysis, key read-throughs, and the one-page exhibit from Atlas Peak Research.
International Business Machines Corporation (IBM)
Sector: Information Technology · FQ3 2026 · Period end September 30, 2026 · Reported October 21, 2026
IBM’s Q3 2026 results materially reduce the risk that the Q2 software shortfall represented structural demand deterioration. The quarter supports a more constructive fundamental assessment, but not an unconditional investment upgrade.
Download the one-page report (PDF)
View one-page exhibit
Download analysis (.md)
Download read-throughs (.md)
Post to X
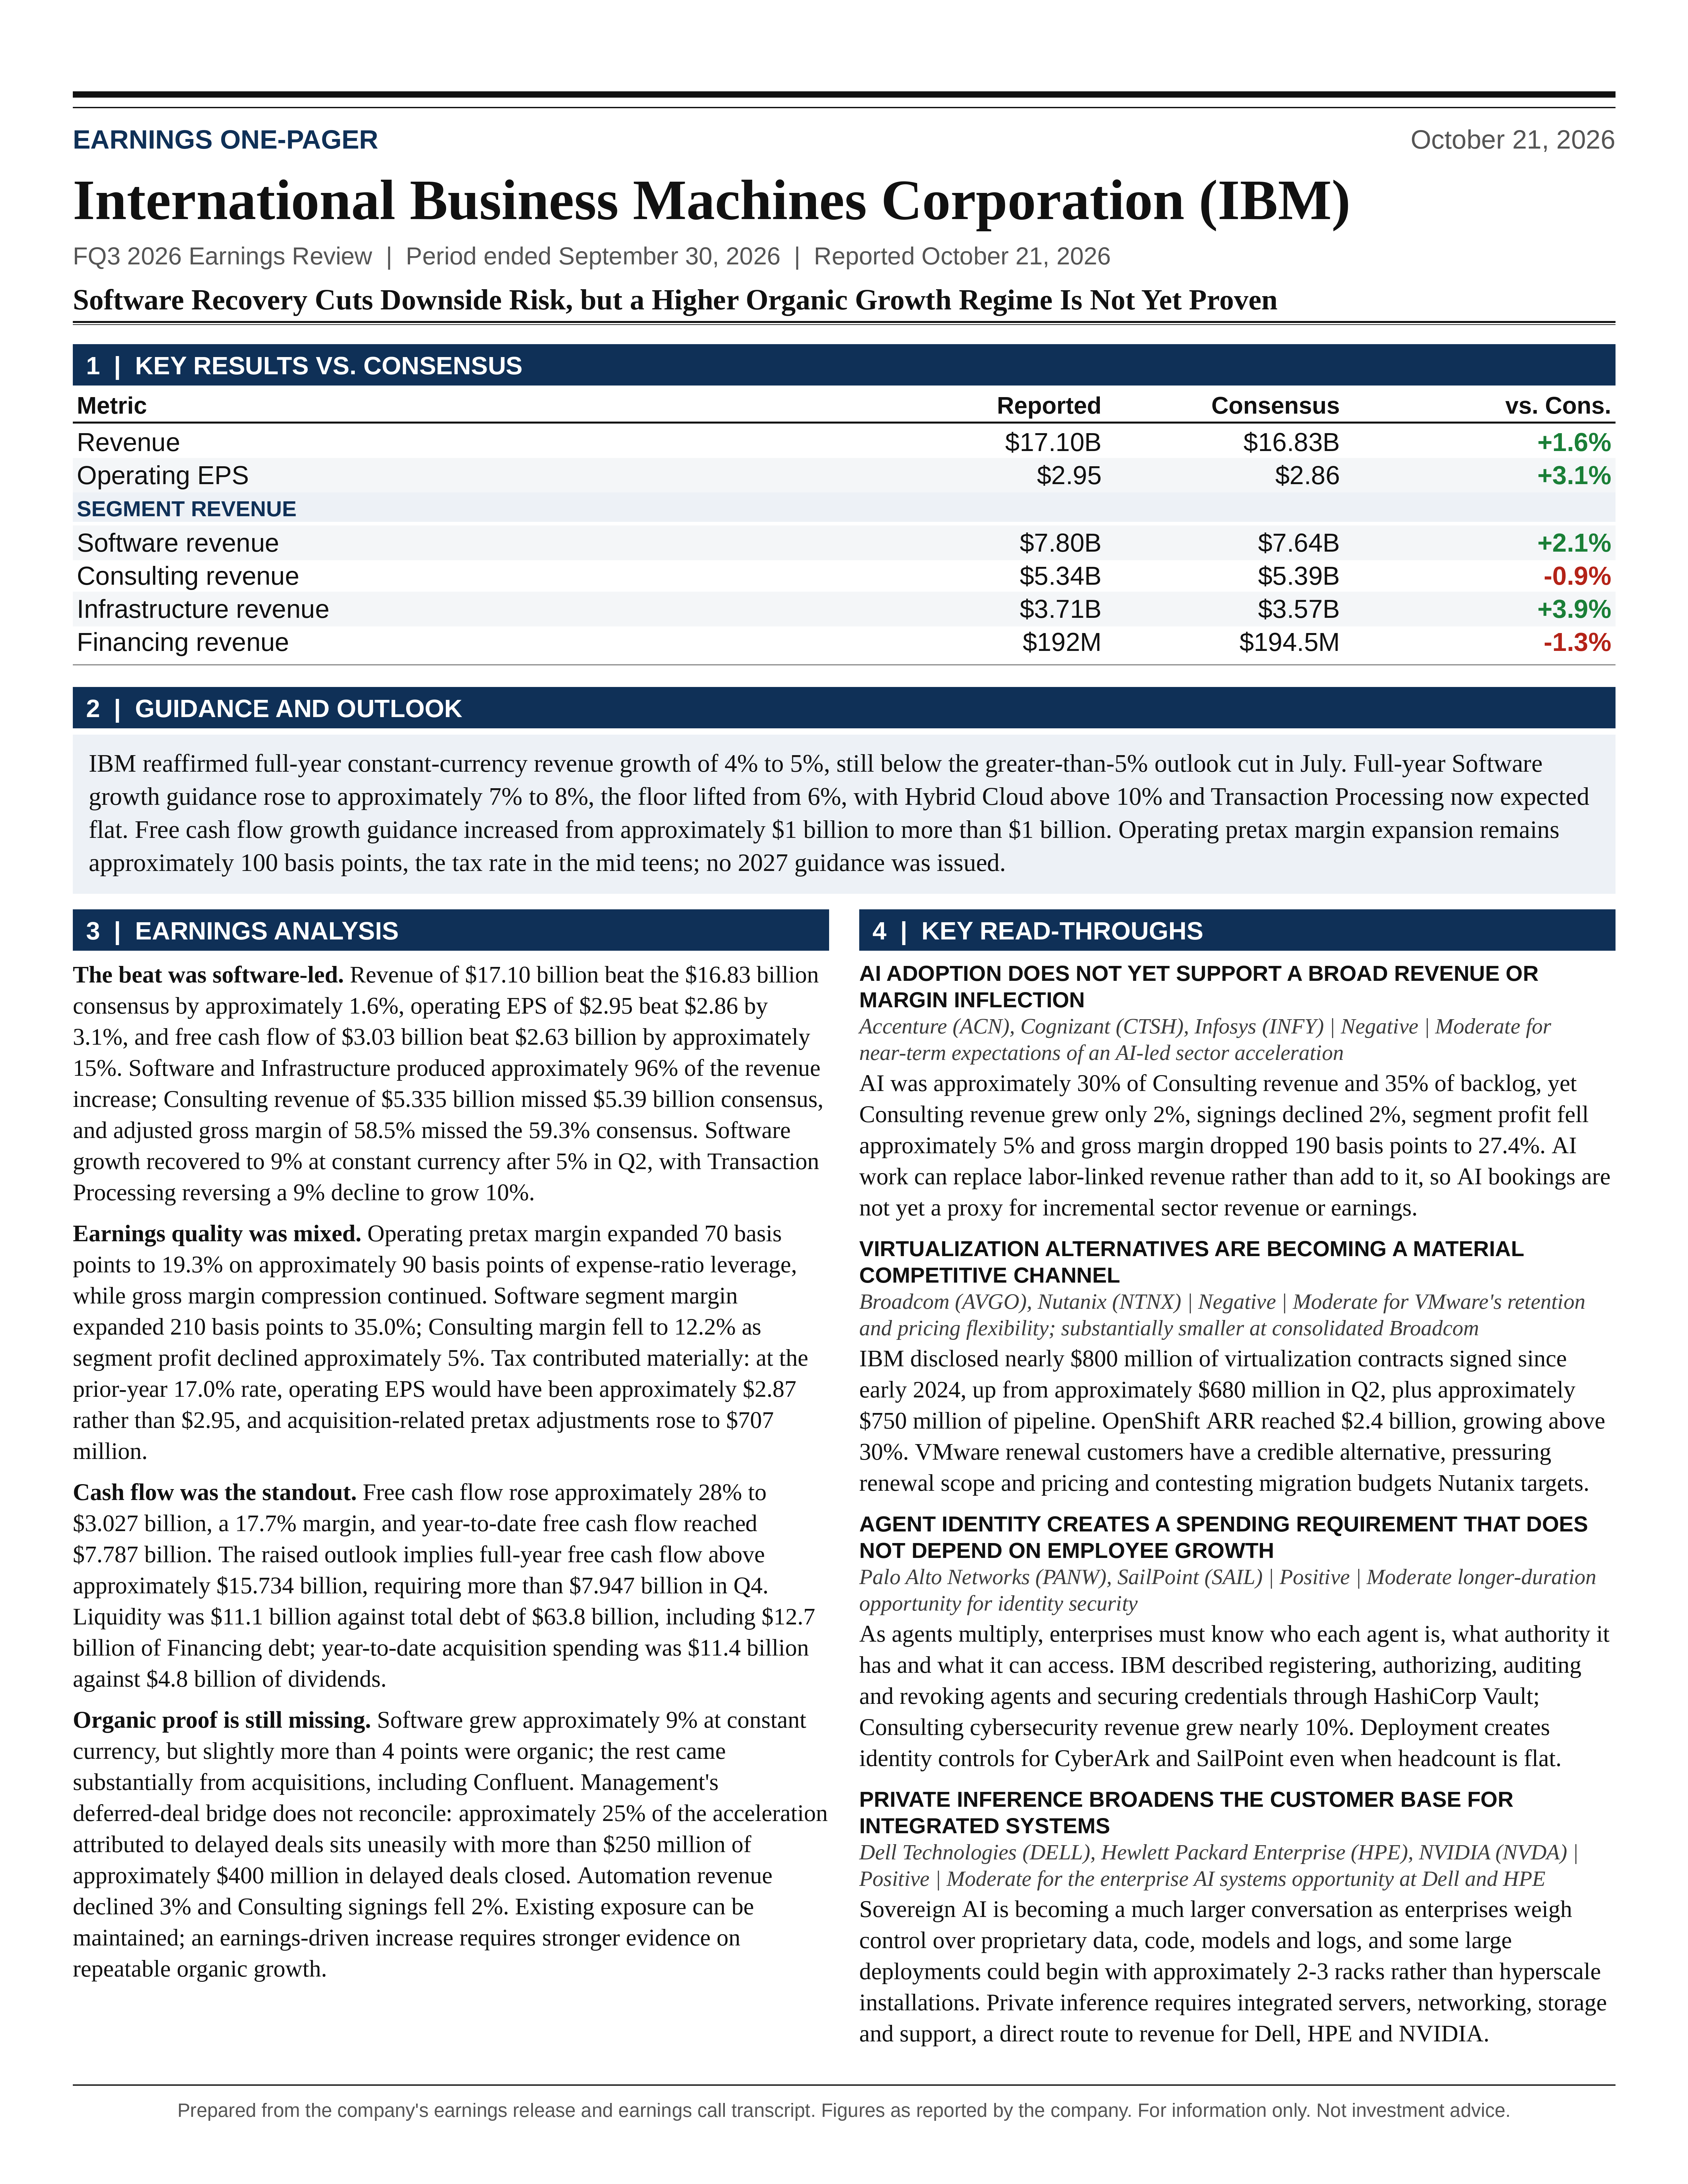
One-Page Exhibit
Earnings Analysis
EXECUTIVE CALL SUMMARY: International Business Machines Corporation (10/21/26)
IBM’s Q3 2026 results materially reduce the risk that the Q2 software shortfall represented structural demand deterioration. The quarter supports a more constructive fundamental assessment, but not an unconditional investment upgrade. Software growth recovered, deferred transactions converted, infrastructure diversification offset declining mainframe hardware revenue, and free cash flow exceeded expectations. However, acquisition contributions remain material, transaction-processing growth benefited from catch-up activity, Consulting remained below consensus, and gross margin missed expectations. The appropriate investment interpretation is improved earnings resilience and reduced downside risk, rather than conclusive evidence that IBM has entered a sustainably higher organic growth regime.
Revenue of $17.10 billion exceeded the supplied Bloomberg consensus of $16.83 billion by approximately 1.6%. Operating EPS of $2.95 exceeded $2.86 consensus by 3.1%, while free cash flow of $3.03 billion exceeded $2.63 billion consensus by approximately 15%. Revenue increased 4.7% as reported and approximately 6% at constant currency. Software and Infrastructure accounted for approximately 96% of the consolidated revenue increase. Consulting contributed little reported growth despite an increasingly prominent AI narrative.
The most important guidance change was the increase in the full-year Software growth floor from 6% to approximately 7%, with the upper bound unchanged at 8%. Consolidated constant-currency revenue guidance remained 4%-5%, still below the greater-than-5% outlook maintained before July’s reduction. Free cash flow growth guidance increased from approximately $1 billion to more than $1 billion. This is an incremental improvement in the expected outcome, not an additional $1 billion increase in the forecast. Management continued to anchor profit and cash flow expectations to the 4% consolidated revenue growth base case.
The strongest leading indicators were Red Hat bookings growth in the high teens, OpenShift ARR growth above 30%, Confluent bookings growth of approximately 20%, and the prospect of additional software monetization from the expanded mainframe installed base. The principal counterweights were Automation revenue declining 3%, Consulting signings declining 2%, Consulting profitability deteriorating, and the absence of quantified 2027 guidance. Management’s characterization of the software rebound as predominantly new business also contains an unresolved numerical inconsistency in the draft transcript.
The central investment question has therefore shifted. Following Q2, the issue was whether spending had been deferred or permanently displaced. Following Q3, the issue is how much of the recovery can persist after deferred deals are absorbed, acquisition comparisons normalize, and productivity savings must coexist with continued investment. Existing exposure supported by an acceptable valuation can be maintained, but an earnings-driven increase in position size requires stronger evidence on repeatable organic growth and the price paid for that growth.
RESULTS AGAINST EXPECTATIONS AND HISTORICAL PERFORMANCE
The official release reports Software revenue of $7.804 billion, approximately 2.1% above the supplied $7.64 billion consensus. Infrastructure revenue of $3.707 billion exceeded $3.57 billion consensus by approximately 3.8%. Consulting revenue of $5.335 billion missed $5.39 billion consensus by approximately 1.0%. Financing revenue of $192 million was slightly below expectations. The consolidated beat was therefore concentrated in the businesses most directly associated with software transactions, storage demand, and IBM’s infrastructure ecosystem.
Software revenue increased approximately $595 million year over year, representing 77% of IBM’s $772 million consolidated revenue increase. Infrastructure contributed another $148 million, or approximately 19%. Software’s share of consolidated revenue increased to 45.6% from 44.1%. This mix shift is strategically favorable because Software carries substantially higher profitability than Consulting and Infrastructure. Nevertheless, the improvement in business mix did not prevent consolidated gross margin from declining.
The constant-currency growth progression shows a recovery from Q2 rather than an entirely new growth trajectory. Consolidated growth increased from approximately 1% in Q2 to 6% in Q3, returning to approximately the rate achieved in Q1. Software growth moved from 8% in Q1 to 5% in Q2 and 9% in Q3. Red Hat growth was 10%, 11%, and 11%, respectively. Data growth was 16%, 18%, and 20%, while Transaction Processing moved from 2% to negative 9% and then positive 10%. Automation moved in the opposite direction, slowing from 7% to 3% and then declining 3%.
The distinction between recovery and structural acceleration matters for valuation. IBM delivered approximately 6% consolidated constant-currency growth and 9% Software growth for full-year 2025. Q3 2026 therefore restores performance broadly consistent with that recent historical benchmark. It does not yet demonstrate that consolidated growth has sustainably moved above the prior-year level, particularly given the contribution from Confluent and other acquired businesses.
Geographic performance was reasonably broad. Revenue grew approximately 5% at constant currency in the Americas, 4% in Europe, the Middle East and Africa, and 10% in Asia Pacific. The acceleration was not confined to a single geographic market, although the presentation does not provide enough detail to separate country-specific demand, acquisition effects, and transaction timing within those regions.
GUIDANCE CHANGES AND THE IMPLIED Q4 REQUIREMENTS
The guidance history establishes the appropriate comparison. On 01/28/26, IBM projected greater-than-5% constant-currency revenue growth and approximately $1 billion of free cash flow growth for 2026. The greater-than-5% revenue outlook was reiterated on 04/22/26. On 07/22/26, revenue guidance was reduced to 4%-5%, while the cash flow growth objective was maintained. The October call preserves that lower revenue range while improving the Software floor and cash flow language. The July reduction has therefore been partially repaired at the segment level, but not reversed at the consolidated level.
Q3 performance exceeded the operating expectations communicated in July. At that time, management expected Q3 constant-currency revenue growth consistent with the 4%-5% full-year range and operating pretax margin performance similar to Q2’s approximately 30-basis-point year-over-year expansion. Actual Q3 growth was approximately 6%, and operating pretax margin expanded 70 basis points. The quarter delivered a meaningful operating beat relative to the prior management framework, not merely relative to consensus.
Software guidance improved from 6%-8% to approximately 7%-8%, with the base case increasing from 6% to approximately 7%. The midpoint increased by only 0.5 percentage points, while the upper bound remained unchanged. This is primarily a reduction in downside uncertainty. Applying the midpoint change to the approximately $30 billion prior-year Software revenue base suggests roughly $150 million of additional annual constant-currency revenue, subject to currency translation and rounding.
Within Software, full-year Hybrid Cloud growth is expected to remain above 10%, Data growth is expected in the mid teens, and Automation growth is expected in the low single digits. Transaction Processing is now expected to be flat for the year. In July, management had incorporated a low- to mid-single-digit Transaction Processing decline into its second-half framework. These are not identical measurement periods, but the direction of revision is clearly favorable. The October outlook assumes that Q3’s recovery offsets earlier weakness, rather than establishing 10% as the new sustainable growth rate.
Infrastructure guidance remains low-single-digit growth for the year. Consulting guidance remains low- to mid-single-digit growth. Operating pretax margin expansion remains approximately 100 basis points, and the operating tax rate remains in the mid teens. No new explicit EPS range or quantified 2027 outlook was issued.
The unchanged consolidated range allows substantially different Q4 outcomes. Using 2025 revenue of $67.535 billion, 2026 year-to-date revenue of $50.182 billion, and management’s approximately neutral full-year currency assumption, 4%-5% annual growth implies roughly $20.1 billion-$20.7 billion of Q4 reported revenue. That represents approximately 1.9%-5.3% reported growth against Q4 2025. With management projecting a Q4 currency headwind of approximately 1-1.5 percentage points, the corresponding constant-currency growth range is roughly 3%-7%. These are derived estimates, not separately issued quarterly guidance.
The margin commitment also retains execution risk. Full-year 2025 operating pretax margin was approximately 18.8%, implying a 2026 target near 19.8%. Applying that margin to the revenue range and subtracting year-to-date operating pretax income of $8.715 billion implies Q4 operating pretax margin of approximately 25.7%-25.9%, compared with approximately 24.1% in Q4 2025. Although sensitive to rounding and currency assumptions, this calculation indicates that the full-year commitment requires stronger Q4 margin expansion than the 70 basis points delivered in Q3.
Currency becomes more relevant to 2027 estimates. At exchange rates assumed in the presentation, IBM anticipates approximately a 1-percentage-point revenue headwind for full-year 2027, including approximately 1.5 percentage points in Q1. Constant-currency acceleration would therefore not translate directly into an equivalent improvement in reported revenue growth.
SOFTWARE: A GENUINE RECOVERY WITH AN UNRESOLVED REVENUE BRIDGE
The most important distinction is between total growth and organic growth. Software grew approximately 9% at constant currency, including slightly more than 4 percentage points of organic growth. In Q2, Software grew approximately 5% with flat organic growth. Accordingly, the approximately 4-percentage-point acceleration was organically driven, but the entire 9% growth rate was not organic. Acquisitions still contributed a substantial portion of total growth.
The recurring base provides meaningful stability. Software ARR reached $24.9 billion, growing 8% at constant currency. Management characterized approximately 80% of the business as high-value recurring revenue and approximately 20% as transactional. That mix helps explain why underlying customer relationships can remain healthy while quarterly reported growth varies materially with enterprise license agreement timing. However, ARR growth is not interchangeable with organic revenue growth, and the call did not provide a complete acquisition-adjusted ARR bridge.
Transactional activity recovered sharply. Management stated that transactional revenue grew above 10%, enterprise license agreements grew more than 20%, and ELA net revenue retention exceeded 130%. These figures are supportive of continued monetization within established accounts. They should not be treated as equivalent to a company-wide subscription net retention metric. Multiyear contract timing, product allocation within ELAs, and transaction size can materially influence these measures.
The deferred-deal explanation is directionally credible but numerically unresolved. Management said approximately 2/3 of the large deals delayed from Q2 had closed. Kavanaugh attributed approximately 25% of the Software acceleration to those delayed deals and approximately 75% to new business. Later, he described approximately $400 million of delayed Q2 deals and more than $250 million subsequently closed.
Those statements cannot be reconciled mechanically if all figures refer to recognized Q3 revenue. Approximately $250 million divided by Q3 2025 Software revenue of $7.209 billion equals roughly 3.5 percentage points of growth. By comparison, 25% of a 4-percentage-point acceleration is approximately 1 percentage point, or about $72 million on that base. Contract value versus revenue recognition, different comparison bases, or draft-transcript errors could explain the discrepancy. The available disclosures do not establish which explanation is correct.
The appropriate conclusion is that both deferred transactions and new business contributed, while the exact allocation remains unverified. This uncertainty matters because a recovery dominated by delayed transactions deserves a lower valuation multiple than an equivalent acceleration driven by repeatable new demand. The official Software revenue figure of $7.804 billion should also take precedence over the approximately $7.6 billion figure cited informally in the Q&A.
RED HAT, OPENSHIFT, VIRTUALIZATION AND LIGHTWELL
Red Hat provides the strongest forward-looking evidence in the quarter. Revenue growth remained 11%, but bookings growth accelerated into the high teens. Bookings are not immediate revenue, and contract duration can affect comparisons, but bookings growth exceeding recognized revenue growth is generally supportive of future revenue conversion if cancellation rates, contract terms, and implementation timing remain stable.
OpenShift ARR increased to $2.4 billion from $2.2 billion disclosed in Q2, with year-over-year growth accelerating above 30%. The approximately $200 million sequential increase in the ARR balance is more decision-useful than the broad AI narrative because it demonstrates expansion in an identifiable recurring product franchise. It should not be interpreted as $200 million of incremental quarterly revenue, since ARR annualizes the recurring revenue base.
The strategic mechanism is credible. AI deployment often requires application modernization, orchestration, access to enterprise data, and consistent operation across heterogeneous infrastructure. These requirements can increase demand for OpenShift even when IBM does not supply the underlying model. Krishna connected the opportunity to the need to “rewrite an application” and “modernize an existing application.” The resulting exposure is to the deployment and management layer of enterprise AI, rather than solely to model training or token consumption.
Virtualization contracts signed since early 2024 approached $800 million, compared with approximately $680 million disclosed in Q2. The pipeline was approximately $750 million. The roughly $120 million increase in cumulative contracts demonstrates commercial progress, but cumulative contract value is neither ARR nor current-period revenue. Contract duration, implementation requirements, and customer migration schedules remain essential to estimating the financial contribution.
Lightwell’s pipeline approached $700 million, and management reported more than 40,000 remediated packages, compared with more than 7,500 patches described in July. This establishes rapid expansion in product activity and prospective demand. It does not establish a similarly sized revenue opportunity within the next 12 months. Pipeline conversion, contract length, pricing, renewal behavior, and potential overlap with existing Red Hat subscriptions were not disclosed.
Management’s reference to a $1 trillion opportunity around open-source vulnerabilities should not be incorporated directly into revenue forecasts. No bridge was supplied between the economic exposure associated with vulnerabilities and the annual software budgets addressable by IBM. The relevant investment evidence is customer adoption, recurring contract formation, and conversion of the $700 million pipeline into recognized revenue.
Management declined to quantify 2027 Red Hat growth. Krishna stated, “Right now, we don’t really want to comment on ’27 growth.” The bookings trajectory improves confidence in continued expansion, but it does not constitute formal guidance for acceleration beyond the current approximately 11% revenue growth rate.
DATA, CONFLUENT AND THE AUTOMATION COUNTERWEIGHT
Data revenue reached approximately $1.7 billion and grew 20% at constant currency, compared with 18% in Q2. Confluent bookings grew approximately 20%. These figures support the strategic relevance of real-time data infrastructure, but the segment’s headline growth cannot be interpreted as an organic growth rate.
IBM completed its approximately $11 billion enterprise-value acquisition of Confluent on 03/17/26. Q3 therefore includes a full quarter of Confluent revenue against a prior-year IBM comparison that did not include the business. Acquisition-related growth support will diminish as the transaction anniversaries are reached, especially from Q2 2027 onward. To sustain high Software growth, IBM will need stronger organic expansion, cross-selling, or additional acquisitions to replace that mechanical contribution.
Management explicitly framed 2026 as the integration year and 2027 as the period for growth synergies. The call provided evidence of healthy Confluent bookings, but not a quantified cross-selling contribution, customer cohort analysis, or revenue synergy target. A favorable strategic fit should therefore be distinguished from demonstrated acquisition returns.
Streamhouse represents a plausible extension of the opportunity. Continuously updated operational data can improve the context supplied to AI systems, and combining streaming infrastructure with governed analytical access can reduce delays between business events and automated responses. However, real-time availability does not itself solve semantic consistency, access control, data quality, model reliability, or application integration. These additional requirements create potential demand for IBM’s broader portfolio, but also increase deployment complexity and competitive exposure.
Automation is the clearest challenge to a uniformly positive software interpretation. Revenue of approximately $1.9 billion declined 3%, versus 3% growth in Q2. Management cited a difficult comparison despite strength in HashiCorp bookings and accelerating HashiCorp revenue. The disclosure does not establish whether weakness was concentrated in legacy products, transaction timing, competitive pressure, or customer spending priorities.
Krishna argued that Automation should benefit as AI applications reach scale and enterprises need to manage larger numbers of deployments. That is a plausible sequencing argument, but it remains prospective. Current results show stronger monetization in hybrid infrastructure and data than in the broader Automation category. Until Automation improves, the thesis that IBM is monetizing the full AI management stack remains incomplete.
MAINFRAME AND TRANSACTION PROCESSING: THE MOST IMPORTANT THESIS REPAIR
Transaction Processing grew 10%, reversing Q2’s 9% decline. Krishna described the prior weakness as “a timing question, not a destruction question.” The Q3 outcome supports that explanation: customers resumed software purchases while mainframe capacity remained substantial and management reported no broad-based deterioration in the platform’s strategic relevance.
The recovery should not be extrapolated at its Q3 rate. Krishna explicitly stated, “I don’t expect double digit performance in TP to keep going.” He attributed the quarter to the combination of delayed Q2 purchases and a normal Q3 buying cycle. This acknowledgment is important because it limits the extent to which the strongest quarterly metric can support higher recurring estimates.
The monetization logic is that installed mainframe capacity creates opportunities for software consumption, pricing, and additional product attachment. Management cited approximately 18% growth in installed MIPS during the z17 program and more than 100% growth in shipped MIPS, while distinguishing installed capacity from future workload opportunity. The draft transcript contains inconsistent wording around these measures, so they should not be treated as a precisely reconciled year-over-year capacity bridge.
The distinction between installed and shipped capacity is economically meaningful. Installed capacity can support current consumption and licensing, whereas shipped capacity may require activation, workload migration, or subsequent contracting before IBM captures the associated software economics. Standard mainframe capacity and specialty capacity supporting Linux or newer workloads can also monetize differently. Capacity growth therefore supports the direction of the thesis without establishing a proportional revenue response.
Management described a $3-$5 software opportunity for every $1 of mainframe placement. That relationship is useful as an ecosystem framework, not as a mechanical multiplier for the next quarter’s hardware revenue. Software monetization spans multiple products and contract periods, and clients can allocate ELA spending among Transaction Processing, Data, and Automation. Red Hat is not included in those ELAs, making Red Hat’s performance a somewhat more independent indicator of software demand.
The platform’s customer concentration creates both resilience and risk. Long-standing relationships with financial institutions and other transaction-intensive enterprises make abrupt displacement difficult. At the same time, the importance of a relatively limited set of large clients increases sensitivity to procurement timing, budget allocation, and negotiated contract economics. Customers representing approximately 85% of installed MIPS maintaining or growing capacity is supportive, but that statistic is capacity-weighted and should not be interpreted as 85% of customer accounts expanding.
The call did not quantify the contribution of pricing versus volume to Transaction Processing growth, despite a direct analyst question. Management emphasized the opportunity to monetize value and price rather than providing a realized price bridge. The evidence supports improved demand confidence, but not a demonstrated acceleration in pricing power.
INFRASTRUCTURE: STORAGE STRENGTH OFFSETTING MAINFRAME NORMALIZATION
Infrastructure revenue grew approximately 5% at constant currency after declining 7% in Q2. Distributed Infrastructure grew 32%, while IBM Z declined 19% and Infrastructure Support declined 2%. The segment’s recovery was therefore driven by distributed products overcoming mainframe hardware normalization, not by current-quarter growth across all infrastructure categories.
The favorable z17 program-to-program narrative can coexist with declining quarterly hardware revenue. Management reported more than $1 billion of incremental revenue over the first 6 quarters of the program versus the prior generation, alongside a strong midrange launch. Those cumulative comparisons indicate a larger overall cycle but do not negate the current quarter’s 19% constant-currency IBM Z decline.
Distributed Infrastructure growth moderated from 37% in Q2 to 32% in Q3, but remained exceptionally strong. Management cited record storage growth, market-share gains, broad demand across Flash, Fusion, tape and IBM Z storage, and a sizable exit backlog. The investment implication is improved diversification within Infrastructure, reducing reliance on the timing of mainframe launches.
Some caution is warranted because July’s explanation for software delays included customers prioritizing hardware purchases ahead of expected price increases and supply constraints. Strong hardware demand may therefore combine structural AI requirements with procurement timing. The call did not quantify those components or provide independent market-share data. Sustained backlog conversion without a subsequent demand correction is the relevant confirmation.
CONSULTING: AI ADOPTION IS NOT YET TRANSLATING INTO STRONG ECONOMICS
Consulting revenue grew approximately 2% at constant currency but only 0.2% as reported, missing consensus. Strategy and Technology grew 4%, while Intelligent Operations was flat at constant currency. Cybersecurity growth approached 10%, but that strength did not produce meaningful growth across the entire Intelligent Operations business.
AI represented approximately 30% of Consulting revenue and 35% of backlog. Applying the revenue percentage to the reported segment total suggests approximately $1.6 billion of quarterly engagements with an AI component. That is not equivalent to $1.6 billion of incremental AI revenue. Existing application modernization, data transformation, and operating-model projects can increasingly include AI without generating a proportional increase in total client spending.
The higher AI share of backlog than current revenue is directionally favorable for future mix. However, the presentation also disclosed $5.0 billion of signings, down 2%, and a trailing-12-month book-to-bill ratio of 1.04. The trailing ratio suggests backlog replenishment modestly exceeds revenue conversion, not a pronounced demand inflection. Quarterly signings were also below quarterly revenue, although quarterly book-to-bill is subject to contract timing and seasonality.
Profitability weakened. Consulting segment profit declined approximately 5% to $653 million. Segment margin was 12.2%, down approximately 60 basis points using underlying values, and gross margin declined 190 basis points to 27.4%. Management attributed the segment margin pressure to reinvestment in digital assets and the transition toward a services-as-software model.
That explanation is strategically coherent but economically unproven. Reusable software assets can improve delivery efficiency and scalability, but AI can also reduce billable effort, compress traditional pricing, and encourage clients to demand productivity savings. The key variable is the proportion of productivity gains retained by IBM versus transferred to customers. Increasing AI penetration alongside weak revenue growth and declining profitability demonstrates that adoption alone is not sufficient evidence of attractive value capture.
Consulting’s full-year growth language also warrants scrutiny. Year-to-date constant-currency growth was approximately 1.2%. Using prior-year revenue weights, achieving approximately 2% full-year growth would require roughly 4.3% Q4 growth, while achieving 3% would require roughly 8.3%. These estimates are approximate, but they show that even the lower portion of the low- to mid-single-digit annual guidance requires a meaningful acceleration from Q3’s approximately 2%. The signings disclosure does not independently confirm such an acceleration.
MARGIN AND EPS QUALITY
Operating pretax margin expanded 70 basis points to 19.3%, while adjusted gross margin declined 20 basis points to 58.5%. The improvement came from approximately 90 basis points of expense-ratio leverage offsetting gross-margin compression. This distinction is central: the quarter demonstrated stronger operating efficiency, not broad-based improvement in product and delivery gross profitability.
Adjusted gross margin missed the supplied 59.3% consensus by 80 basis points. Applying the consensus revenue and margin figures implies approximately $9.98 billion of expected gross profit, compared with actual adjusted gross profit of $10.00 billion. Although separate consensus metrics do not necessarily constitute a single internally consistent model, the comparison indicates that gross profit was approximately in line despite the revenue beat. Much of the EPS upside therefore occurred below gross profit.
Software segment margin expanded 210 basis points to 35.0%, and segment profit increased approximately 15%. Infrastructure segment margin expanded 120 basis points to 19.3%, with profit increasing approximately 11%. These gains demonstrate meaningful operating leverage, while Consulting moved in the opposite direction. The consolidated improvement was consequently less broad than the segment revenue acceleration might suggest.
Management described approximately 500 basis points of gross productivity in Q3 and more than $5.5 billion of productivity benefits accumulated over the initiative’s duration. These figures are management-defined gross benefits, not equivalent amounts of incremental consolidated profit. Savings are partly reinvested, partly used to offset cost pressures, and partly retained in margins.
There is evidence of reinvestment. GAAP R&D expense increased approximately 14% to $2.378 billion, while operating SG&A declined approximately 5% to $4.193 billion. The quarter was therefore not simply a reduction in all spending categories. The investment question is whether sales and administrative efficiencies can continue without weakening customer coverage, implementation quality, or the innovation pipeline.
Tax also contributed to EPS growth. The operating tax rate declined to 14.7% from 17.0%. Holding the prior-year rate constant against current operating pretax income and diluted shares produces EPS of approximately $2.87, versus reported operating EPS of $2.95. The approximately $0.08 benefit represents roughly 27% of the $0.30 year-over-year EPS increase. This does not mean tax caused the entire consensus beat, since management had already guided to a mid-teens rate. It does mean that the 11% EPS growth rate overstates the improvement attributable solely to pretax operating performance.
GAAP continuing-operations EPS increased approximately 26% to $2.31, but GAAP pretax income increased only approximately 3%. The comparison benefited substantially from the decline in the GAAP tax rate from 28.2% to 11.9%. Acquisition-related pretax adjustments increased to $707 million from $590 million, and retirement-related adjustments increased to $91 million from $13 million. The widening adjustment bridge should remain visible when assessing the economic returns from IBM’s acquisition-led strategy.
FREE CASH FLOW, BALANCE SHEET AND CAPITAL ALLOCATION
Free cash flow was the strongest financial result. Q3 free cash flow increased to $3.027 billion from $2.373 billion, approximately 28% growth. Free cash flow margin increased to approximately 17.7% from 14.5%. Year-to-date free cash flow reached $7.787 billion, up approximately 8.4%, with margin increasing to approximately 15.5% from 15.0%.
The year-to-date improvement was concentrated in Q3. First-half free cash flow was approximately $4.760 billion versus $4.808 billion a year earlier. Q3’s approximately $654 million increase therefore accounted for more than the entire $606 million year-to-date improvement. The result is encouraging, but the recent acceleration should not be presented as evenly distributed across the year.
IBM’s free cash flow definition excludes changes in IBM Financing receivables and deducts net capital expenditures. Year-to-date GAAP operating cash flow was $11.791 billion, but $2.805 billion related to changes in financing receivables was excluded before deducting approximately $1.200 billion of net capital expenditures. This adjustment prevents financing portfolio movements from being mistaken for underlying industrial cash generation.
The raised outlook implies full-year free cash flow above approximately $15.734 billion, based on 2025 free cash flow of $14.734 billion. Subtracting the current year-to-date result implies more than approximately $7.947 billion in Q4, versus $7.553 billion in Q4 2025. The required increase is slightly above 5%. That appears achievable relative to Q3’s growth, but still requires approximately 50% of annual free cash flow to arrive in Q4. Year-end collections, transaction closure, tax payments, and working-capital execution remain material.
Management’s reference to approximately 130% cash realization should not be interpreted as free cash flow equal to 130% of adjusted EBITDA. Year-to-date free cash flow was approximately 105% of operating net income and approximately 57% of adjusted EBITDA. Full-year seasonality is important to the realization comparison.
Stock-based compensation was $535 million in Q3 and $1.539 billion year to date. It supports cash conversion because it is noncash in the operating cash flow calculation, but it remains an economic cost through dilution or offsetting repurchases. Diluted weighted-average shares increased approximately 0.5% year over year, so EPS growth was not driven by a shrinking share count.
Liquidity remained substantial, with $11.1 billion of cash, restricted cash and marketable securities. Total debt was $63.8 billion, including $12.7 billion of IBM Financing debt. Core debt was approximately $51.2 billion. Subtracting all consolidated cash from core debt produces approximately $40.1 billion, but that is only a rough analytical measure because cash allocation and financing-business funding require more detailed treatment.
Total debt less reported liquidity increased to approximately $52.7 billion from $46.8 billion at year-end 2025. Acquisition spending was $11.4 billion year to date, while dividends consumed $4.8 billion. Free cash flow comfortably covered dividends but did not fund acquisitions and dividends together. The acquisition strategy therefore depends on a combination of internally generated cash, existing liquidity, and borrowing.
The quarterly dividend remained $1.69 per share, equivalent to $6.76 annualized. Dividend coverage is supportive, but capital allocation should be assessed primarily through organic growth, acquisition returns, and balance-sheet flexibility. Higher cash flow does not eliminate the need to demonstrate an adequate return on the capital deployed into Confluent and other acquisitions.
AI STRATEGY: CREDIBLE ENTERPRISE POSITIONING, INCOMPLETE MONETIZATION PROOF
The strategic argument is that enterprise AI value increasingly depends on the surrounding operating architecture rather than model capability alone. Krishna framed the customer questions as, “What will it cost and who controls it?” IBM’s portfolio addresses both through hybrid infrastructure, data streaming, identity and access controls, orchestration, cost management, and implementation services.
The positioning is differentiated from a pure frontier-model strategy. Red Hat can benefit from deployment complexity, Confluent from requirements for current enterprise data, HashiCorp from machine identity and credentials, and Apptio from the need to measure AI costs against business outcomes. IBM does not need a single proprietary model to win for these businesses to benefit. However, the products still need to demonstrate integration, customer adoption, and differentiated economics against competing platforms.
The call’s discussion of sovereign AI supports this architecture. Regulated enterprises may require control over data residency, logs, inference infrastructure, access policies, and proprietary code. Those requirements can favor on-premises or private-cloud deployment. They do not imply that public-cloud models inevitably retain customer data or that every open-weight model permits unrestricted commercial use. Data handling and deployment rights depend on specific contracts, configurations, and licenses.
IBM’s inference-cost claims have supporting technical context but should remain workload-specific. Its 10/20/26 llm-d announcement described benchmark configurations with per-token costs approximately 5-10 times lower than comparable commercial API pricing. A separate research example reported approximately 98% prefix-cache reuse and an inference cost of about $0.11 per million tokens. High context reuse, sustained utilization, and workload composition are essential to interpreting those results.
These benchmarks do not demonstrate that every enterprise can reduce its total AI cost by 80%-90%. Total ownership cost includes infrastructure utilization, networking, power, operational staffing, redundancy, security, model evaluation, and ongoing maintenance. The call’s suggestion that alternative models can deliver approximately 90% of frontier-model capability is also not a universal quality benchmark. Small accuracy differences can have disproportionately large consequences in regulated, financial, or safety-sensitive workflows.
Open-source participation has a dual effect. It can expand IBM’s distribution and increase the addressable market for supported enterprise deployments, but it also gives competitors access to shared technology. IBM’s economic advantage must therefore arise from integration, support, certification, reliability, customer relationships, and execution rather than exclusive ownership of the underlying open-source code.
The quarterly evidence remains uneven across the portfolio. OpenShift provides strong recurring-growth evidence; Data and Confluent provide encouraging demand indicators; Automation is contracting; Consulting is growing slowly while margins decline. The correct conclusion is that IBM has credible exposure to enterprise AI deployment, but not yet a demonstrated, uniform AI-driven acceleration across its revenue and profit base.
QUANTUM: STRATEGIC OPTIONALITY WITH A MATERIAL FUNDING REQUIREMENT
Quantum progress should be separated from near-term earnings underwriting. Management cited 16 enterprise engagements, demonstrations of quantum advantage, advances in the Nighthawk r2 processor, modular cryogenic infrastructure, a 300,000-square-foot manufacturing facility, and the finalized $1 billion Department of Commerce award associated with Anderon. These developments expand the potential opportunity but do not establish material recurring revenue or attractive near-term returns.
The official prepared remarks clarify several draft-transcript errors, including the processor’s reported 7,500 gates, the Starling reference, and the names of participating research organizations. Those corrected terms should take precedence over the initial draft’s inconsistent wording.
DARPA’s 10/07/26 announcement independently confirms IBM’s advancement to Stage C of the Quantum Benchmarking Initiative. However, DARPA explicitly describes Stage C as testing whether proposed systems can be built and operated as intended. It is not certification that IBM has already achieved economically useful fault-tolerant computing. DARPA also states that the program is not intended to select winners and losers among competing approaches.
Management’s comparison of workloads costing approximately $100 on IBM hardware versus as much as $10 million on slower alternatives is a highly workload-dependent assertion. Without equivalent problem definitions, error requirements, execution methods, and full-system cost assumptions, it cannot support a generalized competitive valuation premium.
The funding commitment is significant. IBM’s July release stated that the company would invest more than $10 billion in quantum over 5 years. The $1 billion award provides support, but it does not neutralize that investment requirement. The commitment should not be treated entirely as incremental capital expenditure because the allocation among R&D, infrastructure, and other spending was not specified.
Quantum Day on 12/10/26 is a relevant catalyst. The decision-useful disclosures would be contracted revenue, customer economics, milestone-linked funding, capital intensity, and measurable progress toward fault tolerance. Until those are available, quantum is best treated as uncertain strategic optionality rather than a necessary component of the base earnings valuation.
INVESTMENT SCENARIOS AND VALUATION IMPLICATIONS
A base case with an illustrative 55% probability assumes that Q3 represents a durable recovery from Q2 disruption, but not a sustained 10% growth regime across Software. Under this scenario, 2027 constant-currency revenue growth is approximately 4%-5%, Software growth is approximately 7%-9%, Transaction Processing returns to modest normalized growth, and Consulting improves gradually. Continued productivity supports free cash flow of approximately $16.5 billion-$17.5 billion. These are analytical assumptions, not company guidance.
A bull case with an illustrative 25% probability assumes that Red Hat bookings convert strongly, OpenShift and virtualization maintain momentum, Confluent produces measurable cross-selling benefits after acquisition comparisons normalize, and mainframe capacity converts into stronger software consumption. Consolidated constant-currency growth could reach approximately 6%-7%, Software growth approximately 10%-12%, and free cash flow approximately $18 billion-$19 billion. This scenario requires broadening organic growth, not merely another quarter of deferred-deal conversion.
A bear case with an illustrative 20% probability assumes that Q3 captured much of the delayed transactional demand, Automation remains weak, Consulting’s AI mix fails to improve revenue economics, and infrastructure demand normalizes after strong procurement activity. Consolidated constant-currency growth could slow to approximately 0%-2%, Software growth to approximately 3%-5%, and free cash flow to approximately $14.5 billion-$15.5 billion as investment requirements and weaker operating leverage offset productivity gains.
These probabilities are judgmental and carry moderate-to-low confidence because 2027 guidance has not been issued, the deferred-deal bridge is unresolved, and acquisition-adjusted segment demand metrics remain incomplete. The most important potential positive revision is stronger organic recurring growth. The most important negative revision is evidence that transaction recovery and cost reduction are masking weak underlying demand.
The current cash flow outlook provides useful valuation reference points without requiring a speculative quantum premium. Using approximately $15.7 billion of annual free cash flow, a 5% equity free cash flow yield implies approximately $315 billion of equity value, while a 4% yield implies approximately $393 billion. Using the Q3 diluted share base as a proxy, those values correspond to approximately $330 and $413 per share. These are valuation sensitivities, not price targets, and they do not separately deduct the economic cost of stock-based compensation.
The difference between a 5% and 4% cash flow yield is approximately 25% in equity value at unchanged cash flow. That illustrates why the organic-growth assessment matters more than the relatively small increase in the 2026 cash flow outlook. A substantial rerating requires confidence that IBM can sustain attractive growth after acquisition contributions and catch-up transactions normalize.
Live Bloomberg pricing was unavailable, so no verified post-results entry price or market-implied expected return is established. The fundamental stance is constructive, but the appropriate action is to maintain valuation-supported exposure rather than increase exposure solely because of the quarterly beat. An explicit position size or market-price stop cannot be justified without the current valuation, liquidity conditions, and portfolio exposures.
PORTFOLIO IMPACT, CATALYSTS AND THESIS INVALIDATION
IBM can provide a different form of AI exposure from semiconductor suppliers and highly valued application vendors. Its installed base, services relationships, recurring software, and dividend introduce cash-generative characteristics. However, it should not be treated as an independent hedge against the AI investment cycle. Customer infrastructure spending, enterprise budgets, software deployment, and IBM’s acquisition strategy remain linked to the same broader technology spending environment.
A position also adds exposure to large-enterprise procurement, financial-services technology budgets, foreign exchange, financing costs, and mainframe product cycles. The dividend and cash flow profile can reduce reliance on terminal growth assumptions, but a premium valuation would still create sensitivity to interest rates and software growth expectations. Actual portfolio diversification benefits cannot be established without existing holdings and factor exposures.
The immediate operating catalyst is Q4 execution, particularly conversion of remaining delayed transactions, Red Hat bookings into revenue, distributed infrastructure backlog into shipments, and year-end cash collection. The next major estimate-setting catalyst is the January 2027 results and outlook, when management said it would quantify its early thinking on Software and IBM’s broader trajectory. Confluent’s acquisition anniversary during 2027 will provide a cleaner test of underlying growth. Quantum Day is a separate, longer-duration optionality catalyst.
The thesis would strengthen if Software sustains organic growth above the Q3 level without relying on deferred deals, recurring growth approaches 10%, Automation returns to growth, Consulting signings accelerate, and Consulting margins stabilize. It would weaken if Software organic growth falls back toward low-single-digit levels after catch-up transactions are exhausted, Red Hat bookings decelerate materially, or mainframe capacity growth fails to translate into software monetization.
A reduction or exit would be justified by persistent deterioration in these operating indicators, a withdrawal of the cash flow improvement commitment, or evidence that acquisition spending and quantum investment are preventing balance-sheet stabilization without generating adequate growth. A valuation that already discounts the bull case would also undermine the risk-adjusted opportunity even if operating results remain sound.
The quarter’s central message is therefore favorable but bounded. IBM demonstrated that Q2 disruption was at least substantially recoverable and that productivity can protect profitability and cash flow. The remaining burden of proof is whether recurring organic growth, acquisition returns, and AI-related monetization can support a higher valuation after the benefits of deferred transactions and portfolio consolidation fade.
SOURCE BASIS AND LIMITATIONS
The analysis uses the complete supplied 10/21/26 earnings-call transcript and Bloomberg earnings notice, IBM’s official Q3 2026 release, earnings presentation and prepared remarks, the Q2 2026 release and relevant July-call guidance passages, the Q1 2026 and full-year 2025 releases, IBM’s 03/17/26 Confluent acquisition announcement, its 10/20/26 llm-d announcement, and DARPA’s 10/07/26 Stage C announcement. Official financial tables take precedence over inconsistent spoken figures in the initial draft. Revenue growth references are at constant currency unless explicitly identified as reported. Calculated quarterly requirements, valuation sensitivities, and scenarios are analytical estimates rather than company forecasts. Competitive cost claims, market-share assertions, and pipeline conversion assumptions remain subject to the qualifications discussed above.
COMPANY EMPLOYEES ON THE CALL
• Arvind Krishna, Chairman, President and Chief Executive Officer. • James J. Kavanaugh, Senior Vice President, Finance & Operations, and Chief Financial Officer. • Olympia McNerney, Global Head of Investor Relations.
RESEARCH ANALYSTS ON THE CALL
• Amit Daryanani, Evercore ISI Institutional Equities. • Ben Reitzes, Melius Research LLC. • Brent Thill, Jefferies LLC. • Brian Essex, J.P. Morgan. • Fatima Boolani, Citigroup Inc. • Matthew Swanson, RBC Capital Markets. • Raimo Lenschow, Barclays. • Wamsi Mohan, Bank of America.
Key Read-Throughs
KEY READ-THROUGHS FROM IBM’S Q3 2026 EARNINGS CALL
IBM’s results indicate that enterprise AI spending is expanding beyond model experimentation into application modernization, data infrastructure, security and production deployment. The distribution of economic benefits remains uneven. OpenShift ARR growth above 30%, strong storage demand and the recovery in mainframe software support infrastructure and mission-critical software franchises. Conversely, Consulting growth of only 2%, despite AI representing approximately 30% of revenue, challenges expectations that AI adoption automatically accelerates services revenue and profitability. The most actionable implications concern competitive redistribution and revenue quality rather than a broad technology spending upgrade: virtualization alternatives are gaining commercial scale, identity security is becoming an essential deployment requirement, and private AI creates opportunities outside hyperscale infrastructure. Magnitudes below describe incremental business implications, not predicted share-price moves. Revenue growth figures are at constant currency unless otherwise stated. Quantum cost comparisons are excluded from directional peer conclusions because the disclosed benchmarks do not establish comparable commercial economics.
IT SERVICES: AI ADOPTION DOES NOT YET SUPPORT A BROAD REVENUE OR MARGIN INFLECTION (READ-THROUGH 1)
Affected companies: Accenture (ACN: Ireland), Cognizant Technology Solutions (CTSH: United States), and Infosys (INFY: India). Directional impact: negative for near-term expectations of an AI-led sector acceleration; moderate for labor-linked delivery economics, but insufficient by itself to justify company-specific earnings reductions.
The critical evidence is the disconnect between AI penetration and financial performance. IBM reported that AI represented approximately 30% of Consulting revenue and 35% of backlog, yet Consulting revenue grew only 2%. The accompanying presentation disclosed signings declining 2%, a trailing-12-month book-to-bill ratio of 1.04, and segment profit declining approximately 5%. Consulting gross margin fell 190 basis points to 27.4%. Management attributed segment margin pressure to reinvestment in digital assets and the transition toward a services-as-software model.
The transmission mechanism is that AI-related work can replace or reshape existing services revenue rather than simply add to it. Application modernization, data preparation and workflow redesign generate demand, but automated development and delivery reduce the labor required for established tasks. Under time-based contracts, fewer delivery hours can reduce revenue. Under fixed-price contracts, productivity can improve margins, but renewals and competitive bidding allow customers to reclaim some of those savings. Simultaneously, providers must invest in reusable software, technical talent and implementation capabilities before achieving sufficient scale.
For Accenture, the positive opportunity in transformation and workflow redesign remains substantial, but IBM’s results argue against treating AI bookings as an immediate proxy for incremental revenue or earnings. For Cognizant and Infosys, the important risk is that improving demand for AI-enabled transformation coexists with pressure on application development, maintenance and other labor-linked revenue pools. IBM does not establish that these companies will suffer identical margin outcomes, but it provides direct evidence that rising AI exposure alone is not an adequate financial thesis.
Near-term trading relevance centers on subsequent peer disclosures of organic growth, booking conversion, utilization, pricing and margins. The longer-duration shift, over approximately 12-36 months, is toward asset-based and outcome-based delivery. The likely differentiation is the ability to retain productivity gains and monetize reusable capabilities, rather than the proportion of engagements labeled AI.
INFRASTRUCTURE SOFTWARE: VIRTUALIZATION ALTERNATIVES ARE BECOMING A MATERIAL COMPETITIVE CHANNEL (READ-THROUGH 2)
Affected companies: Broadcom (AVGO: United States) and Nutanix (NTNX: United States). Directional impact: negative for VMware’s long-term retention and pricing flexibility; moderate at the VMware franchise level and substantially smaller at consolidated Broadcom. For Nutanix, the negative implication is increased competition for migration opportunities, not evidence of declining absolute demand.
IBM disclosed nearly $800 million of virtualization contracts signed since early 2024 and approximately $750 million of pipeline. The cumulative contract figure increased from approximately $680 million disclosed in Q2. OpenShift ARR reached $2.4 billion, with growth accelerating above 30%, while Red Hat bookings growth returned to the high teens.
The important transmission mechanism is the emergence of a credible alternative procurement and deployment path. As customers evaluate virtualization renewals, Red Hat can combine virtual machines, containers, enterprise support and application modernization within a broader platform decision. This creates a more credible alternative than a migration motivated solely by license cost. For VMware, the consequences can include reduced renewal scope, slower expansion, stronger customer negotiating leverage and eventual workload migration.
The figures do not establish that every Red Hat contract displaced VMware, and cumulative contract value is not annual recurring revenue. Nevertheless, the scale of signed business and prospective pipeline makes the competitive channel harder to dismiss as exploratory customer interest. Switching costs remain high, but the call suggests that a commercially meaningful alternative ecosystem is developing.
Nutanix benefits from the same customer willingness to reconsider incumbent infrastructure, but it cannot be assumed to capture that opportunity without competition. Standalone OpenShift Virtualization competes for some of the same migration budgets. Conversely, OpenShift can operate on Nutanix infrastructure, making the relationship partly complementary. The high-conviction negative read-through is therefore to an assumption of uncontested migration share, rather than to Nutanix’s overall growth outlook.
Near-term relevance is primarily competitive sentiment and scrutiny of renewal, expansion and migration disclosures. The fundamental impact should unfold over approximately 6-24 months as enterprise agreements expire and migrations proceed. Broadcom’s diversified semiconductor exposure and pricing actions can offset VMware customer losses, so this is not a standalone consolidated Broadcom short thesis.
MAINFRAME SOFTWARE: INSTALLED-BASE DURABILITY SUPPORTS BROADCOM’S RECURRING CASH FLOWS (READ-THROUGH 3)
Affected company: Broadcom (AVGO: United States). Directional impact: positive; moderate for the durability of the mainframe software franchise, but low for consolidated earnings expectations based on this call alone.
IBM’s Transaction Processing revenue grew 10%, reversing a 9% decline in Q2. Management reported that customers representing approximately 85% of installed mainframe capacity were maintaining or increasing capacity. It also cited approximately 18% growth in installed MIPS during the z17 program and more than $1 billion of cumulative incremental hardware revenue versus the prior program. Krishna characterized the earlier software weakness as “a timing question, not a destruction question.”
Broadcom’s mainframe software portfolio operates within the same underlying computing environment. Continued mainframe utilization supports demand for security, workload automation, systems management and other software required to operate that environment. The primary transmission is preservation of the installed revenue base, continued renewal relevance and potential expansion as workloads grow. It is not an assumption that IBM’s Transaction Processing growth translates directly into equivalent Broadcom growth.
The distinction between hardware shipments and installed workloads matters. New hardware creates an opportunity, but software monetization depends on deployment, usage, contract structures and the products attached to those workloads. IBM’s evidence of maintained or growing installed capacity is consequently more relevant to Broadcom’s recurring software economics than the headline size of the hardware launch.
Management also cautioned against extrapolating Q3’s Transaction Processing growth. Krishna stated, “I don’t expect double digit performance in TP to keep going.” Part of the improvement reflected deferred transactions. The strongest peer implication is reduced risk of accelerated mainframe abandonment, not a forecast of sustained 10% growth across mainframe vendors.
Near-term relevance is favorable sentiment toward the resilience of legacy infrastructure software and subsequent renewal disclosures. The more important effect is longer-duration cash flow durability over approximately 1-3 years. This positive exposure partially offsets Broadcom’s virtualization competitive risks, demonstrating why infrastructure software should not be treated as a single homogeneous business.
CYBERSECURITY: AGENT IDENTITY CREATES A SPENDING REQUIREMENT THAT DOES NOT DEPEND ON EMPLOYEE GROWTH (READ-THROUGH 4)
Affected companies: Palo Alto Networks (PANW: United States) and SailPoint (SAIL: United States). Directional impact: positive; moderate longer-duration opportunity for identity security, with limited immediate earnings implications from IBM’s disclosure alone.
Krishna stated that, as agents multiply, enterprises need to know “who each agent is, what authority it has and what it can access.” IBM described capabilities to register, authorize, audit and revoke agents and secure their credentials through HashiCorp Vault. It also disclosed collaboration involving IBM Agent Identity, HashiCorp Vault and NVIDIA’s Open Agent Safety platform. Separately, cybersecurity revenue within Consulting grew at nearly 10%.
The transmission mechanism is a shift from predominantly human identity management toward governance of software entities that can take actions. An agent interacting with financial systems, customer data or development environments needs authentication, scoped permissions, credential management, monitoring and revocation. Production deployment therefore creates security requirements even when the number of employees is flat or declining.
For Palo Alto Networks, the relevant exposure is its CyberArk identity-security business, acquired in February 2026. Privileged access, machine identities and credentials are directly adjacent to the controls IBM described. The opportunity is additional product adoption and platform attachment as customers move agents from pilots into sensitive operating environments.
For SailPoint, the exposure is identity discovery, governance, policy enforcement and access lifecycle management. Its agentic identity capabilities address the need to identify agents, determine ownership, govern permissions and remove access when circumstances change. The potential expansion is in the number and complexity of governed identities, rather than simply workforce seats.
The competitive qualification is important: IBM is itself a supplier in this market. The call validates the spending requirement, not the market share of Palo Alto Networks or SailPoint. Agent proliferation also does not translate mechanically into proportionate revenue because pricing may be platform-based rather than charged individually per agent.
Near-term trading relevance is corroboration of agent-security demand ahead of vendor results and customer adoption disclosures. The fundamental opportunity is more likely to emerge over approximately 12-36 months through larger deployments, broader product attachment and renewal expansion. Identity security appears better positioned than discretionary AI experimentation because production access controls become necessary once agents receive meaningful authority.
ENTERPRISE AI INFRASTRUCTURE: PRIVATE INFERENCE BROADENS THE CUSTOMER BASE FOR INTEGRATED SYSTEMS (READ-THROUGH 5)
Affected companies: Dell Technologies (DELL: United States), Hewlett Packard Enterprise (HPE: United States), and NVIDIA (NVDA: United States). Directional impact: positive; moderate for the enterprise AI systems opportunity at Dell and HPE, and a smaller incremental confirmation of NVIDIA’s broader platform demand.
The call linked rising interest in sovereign AI to control over proprietary data, code, models and logs. Krishna stated that sovereign AI was becoming “a much larger conversation” and described enterprises evaluating private deployment rather than relying exclusively on external frontier-model services. He also argued that some large-enterprise deployments could begin with approximately 2-3 racks rather than hyperscale-sized installations.
The direct transmission to Dell and HPE is demand for integrated systems that reduce the complexity of operating private inference. The required purchase extends beyond GPUs to servers, networking, storage, deployment software, security and support. Enterprises without specialized infrastructure teams have a reason to pay for validated configurations and implementation services rather than assemble each component independently.
This exposure is supported by existing product relationships. Dell offers Red Hat OpenShift on its AI Factory with NVIDIA, while HPE’s Private Cloud AI and AI Factory offerings incorporate NVIDIA technologies and enterprise deployment capabilities. These are established routes through which the architecture described by IBM can become hardware and services revenue. IBM did not, however, disclose orders awarded to either company.
NVIDIA benefits because open-weight models and private inference can run on its hardware and software ecosystem. Model openness is not synonymous with open-source replacement of accelerators. The relevant opportunity includes GPU adoption, networking and enterprise software attachment across a broader set of customers.
The call’s inference-efficiency claims should not be interpreted as an equivalent reduction in aggregate accelerator demand. Lower cost per token can reduce hardware required for a fixed workload, but can also make additional workloads economical. The high-conviction conclusion is that private AI expands deployment options and the addressable customer base; the net demand elasticity cannot be quantified from this call.
Near-term relevance is supportive for enterprise AI order commentary and pipeline conversion over the next several quarters. The fundamental shift spans approximately 1-3 years as inference becomes more distributed. The overseas banking example supports demand from regulated and non-US enterprises, but does not establish a specific country-level revenue opportunity. Hardware gross margins and services attachment remain essential because AI systems revenue is not interchangeable with attractive profit growth.
MEMORY AND STORAGE: THE CLEANER READ-THROUGH IS TO ENTERPRISE FLASH DEMAND, NOT UNIVERSAL STORAGE OEM SHARE GAINS (READ-THROUGH 6)
Affected companies: Kioxia Holdings (285A: Japan) and Micron Technology (MU: United States). Directional impact: positive; low-to-moderate confirmation for Kioxia’s enterprise flash exposure and a smaller consolidated read-through for Micron, whose results also depend heavily on DRAM and HBM.
IBM reported 32% growth in Distributed Infrastructure and record storage revenue growth. Management described demand across Flash, Fusion, tape and IBM Z storage, stating that “AI continues to increase demand for storage.” A sizable distributed infrastructure backlog supported management’s confidence in continued Q4 momentum.
The transmission mechanism is the storage required to retain, access and repeatedly use enterprise data in production AI systems. Enterprise inference and agentic applications can increase requirements for persistent datasets, retrieval infrastructure, checkpoints, logs and selected caching layers. Flash can benefit where latency, throughput, density and endurance requirements justify SSDs over slower storage tiers.
Kioxia and Micron both supply enterprise SSD technologies addressing these requirements. Kioxia’s enterprise SSD portfolio includes products positioned for AI environments and context caching. Micron similarly has a direct data-center SSD exposure. The read-through is to the category of demand served by these products, not to a verified IBM supply contract. No incremental supplier award or procurement allocation was disclosed on the call.
This distinction makes the upstream interpretation cleaner than an indiscriminate upgrade of competing storage-system vendors. IBM simultaneously claimed market-share gains. Its strong storage performance can therefore reflect both expanding end demand and competitive displacement. A rival storage OEM may benefit from the category while losing share within it.
Several limitations constrain the magnitude. Distributed Infrastructure includes more than storage, and storage includes technologies other than NAND flash. Revenue growth also does not establish equivalent bit growth because pricing and product mix matter. IBM’s result is consequently corroborating evidence for enterprise flash demand, not a basis for a numerical NAND pricing or supplier earnings revision.
Near-term relevance is positive context for the next round of memory and enterprise storage results. The fundamental implication is broader storage intensity as AI reaches production over approximately 6-24 months. The call provides no sufficient basis to extrapolate the same demand strength to consumer NAND or to infer a specific benefit for HBM.
DATA PLATFORMS: STREAMING CAN EXPAND ANALYTICAL COMPUTE WITHOUT REQUIRING WAREHOUSE DISPLACEMENT (READ-THROUGH 7)
Affected company: Snowflake (SNOW: United States). Directional impact: positive for platform relevance and potential analytical consumption; modest near-term significance and moderate longer-duration opportunity.
IBM reported 20% Data revenue growth and approximately 20% Confluent bookings growth. More importantly for the competitive interpretation, Krishna explicitly said that Streamhouse “complements warehouses and lake houses.” The call also described lakehouse growth and emphasized the need to make current enterprise data available to AI applications without creating unnecessary copies.
The transmission mechanism is that streaming infrastructure can make additional operational datasets available for analytical processing. Data that was previously difficult or expensive to move from operational systems can become accessible to governance, analytics and AI workflows. Where Snowflake performs that processing, broader data availability can increase query activity and compute consumption.
This is not merely a theoretical compatibility argument. Snowflake documents a Confluent Tableflow integration in which Kafka data is materialized into Apache Iceberg tables and exposed to Snowflake. That provides a concrete technical route from greater adoption of streaming infrastructure to additional workloads accessible through Snowflake.
The non-consensus distinction is between the storage layer and the processing opportunity. Open formats and reduced copying can weaken dependence on proprietary data storage without eliminating demand for analytical compute. Snowflake’s opportunity is therefore to monetize useful processing over accessible data, not necessarily to maximize the number of proprietary copies held within its platform.
The positive interpretation remains bounded. IBM’s 20% Data growth includes acquisition effects and is not a clean measure of organic industry demand. Confluent bookings do not automatically create Snowflake revenue, and some processing can remain in streaming engines or move to competing platforms. The call nevertheless provides direct evidence against a simplistic assumption that IBM’s streaming strategy requires warehouse replacement.
Near-term trading relevance is primarily architectural reassurance rather than evidence of a specific quarterly consumption beat. The fundamental opportunity develops over approximately 12-24 months as customers connect operational data to production analytics and AI workflows. Incremental compute consumption, rather than headline data volume alone, is the relevant confirmation.
ENTERPRISE APPLICATIONS: AI REINFORCES THE VALUE OF SYSTEMS OF RECORD MORE THAN IT VALIDATES THEIR REPLACEMENT (READ-THROUGH 8)
Affected companies: SAP (SAP: Germany) and Oracle (ORCL: United States). Directional impact: positive for installed-base durability and the persistence of core application economics; low immediate earnings impact and moderate longer-duration defensive significance.
Krishna’s statement that “you’re not likely going to throw out your ERP system” was central to the discussion of enterprise AI adoption. He argued that customers need workflow redesign and integration with existing systems rather than isolated experiments. The mainframe discussion reinforced the same distinction: mission-critical transactions require deterministic, repeatable and reliable execution even as AI becomes more capable.
The transmission mechanism is that an AI interface does not replace the authoritative business processes beneath it. Finance, procurement, inventory, order management and other core workflows still require validated permissions, transaction integrity, auditability and consistent business logic. An agent can initiate or assist a process, but the underlying system must execute and record the result correctly.
For SAP, this supports the durability of its ERP installed base and the opportunity to embed AI into existing business processes. Customers may change user interfaces or automate tasks without replacing the core application environment. That reduces the credibility of disruption scenarios that assume an AI front end removes the economic relevance of ERP.
For Oracle, the positive exposure spans enterprise applications and the database infrastructure supporting transactional systems. AI adoption can create additional integration and data-access requirements while preserving the need for reliable underlying processing. This read-through is separate from Oracle’s cloud infrastructure capital cycle and does not resolve the economics of that investment program.
The protection is stronger for core business logic and transaction infrastructure than for every application seat. Automation can still reduce human interaction with software, pressure seat-based pricing and shift spending toward usage-based contracts. Incumbent durability therefore does not guarantee unchanged monetization or accelerated revenue growth.
Near-term relevance is reduced support for an indiscriminate AI-displacement trade against enterprise applications. The longer-duration implication, over approximately 2-5 years, is that AI is more likely to change how systems of record are accessed and monetized than to eliminate their underlying function. The most defensible exposures are the platforms controlling authoritative data, permissions and transactions, rather than software whose value resides primarily in a replaceable user interface.
Report record
- Sector
- Information Technology
- Fiscal period end
- September 30, 2026
- Report date
- October 21, 2026
- Analysis
- 6392 words
- Read-throughs
- 3083 words
- Content fingerprint (PDF)
6e0207a4bda8- Content fingerprint (analysis)
12f72dd0521d- Content fingerprint (read-throughs)
d3e0fd14dd43
Prepared from the company's earnings release and earnings call transcript. Figures as reported by the company. For information only. Not investment advice.
More from International Business Machines Corporation
No other reports yet.
All International Business Machines Corporation reports
More in Information Technology
Operating Thesis Strengthened; Cash Conversion Remains Unproven
Optical and IP Growth Validated; Cash Conversion Moved the Other Way
All Information Technology reports
Follow @AtlasPeakRes on X for new earnings reports as they publish.