A Larger and More Profitable Equipment Franchise, Not Yet a Cash-Generative Platform
Earnings Reports
Lockheed Martin Corporation FQ3 2026 Earnings Report
Lockheed Martin Corporation (LMT) FQ3 2026 earnings: Volume Growth Validated, Margin Improvement Not Yet Established. Full earnings analysis, key read-throughs, and the one-page exhibit from Atlas Peak Research.
Lockheed Martin Corporation (LMT)
Sector: Industrials · FQ3 2026 · Period end September 27, 2026 · Reported October 22, 2026
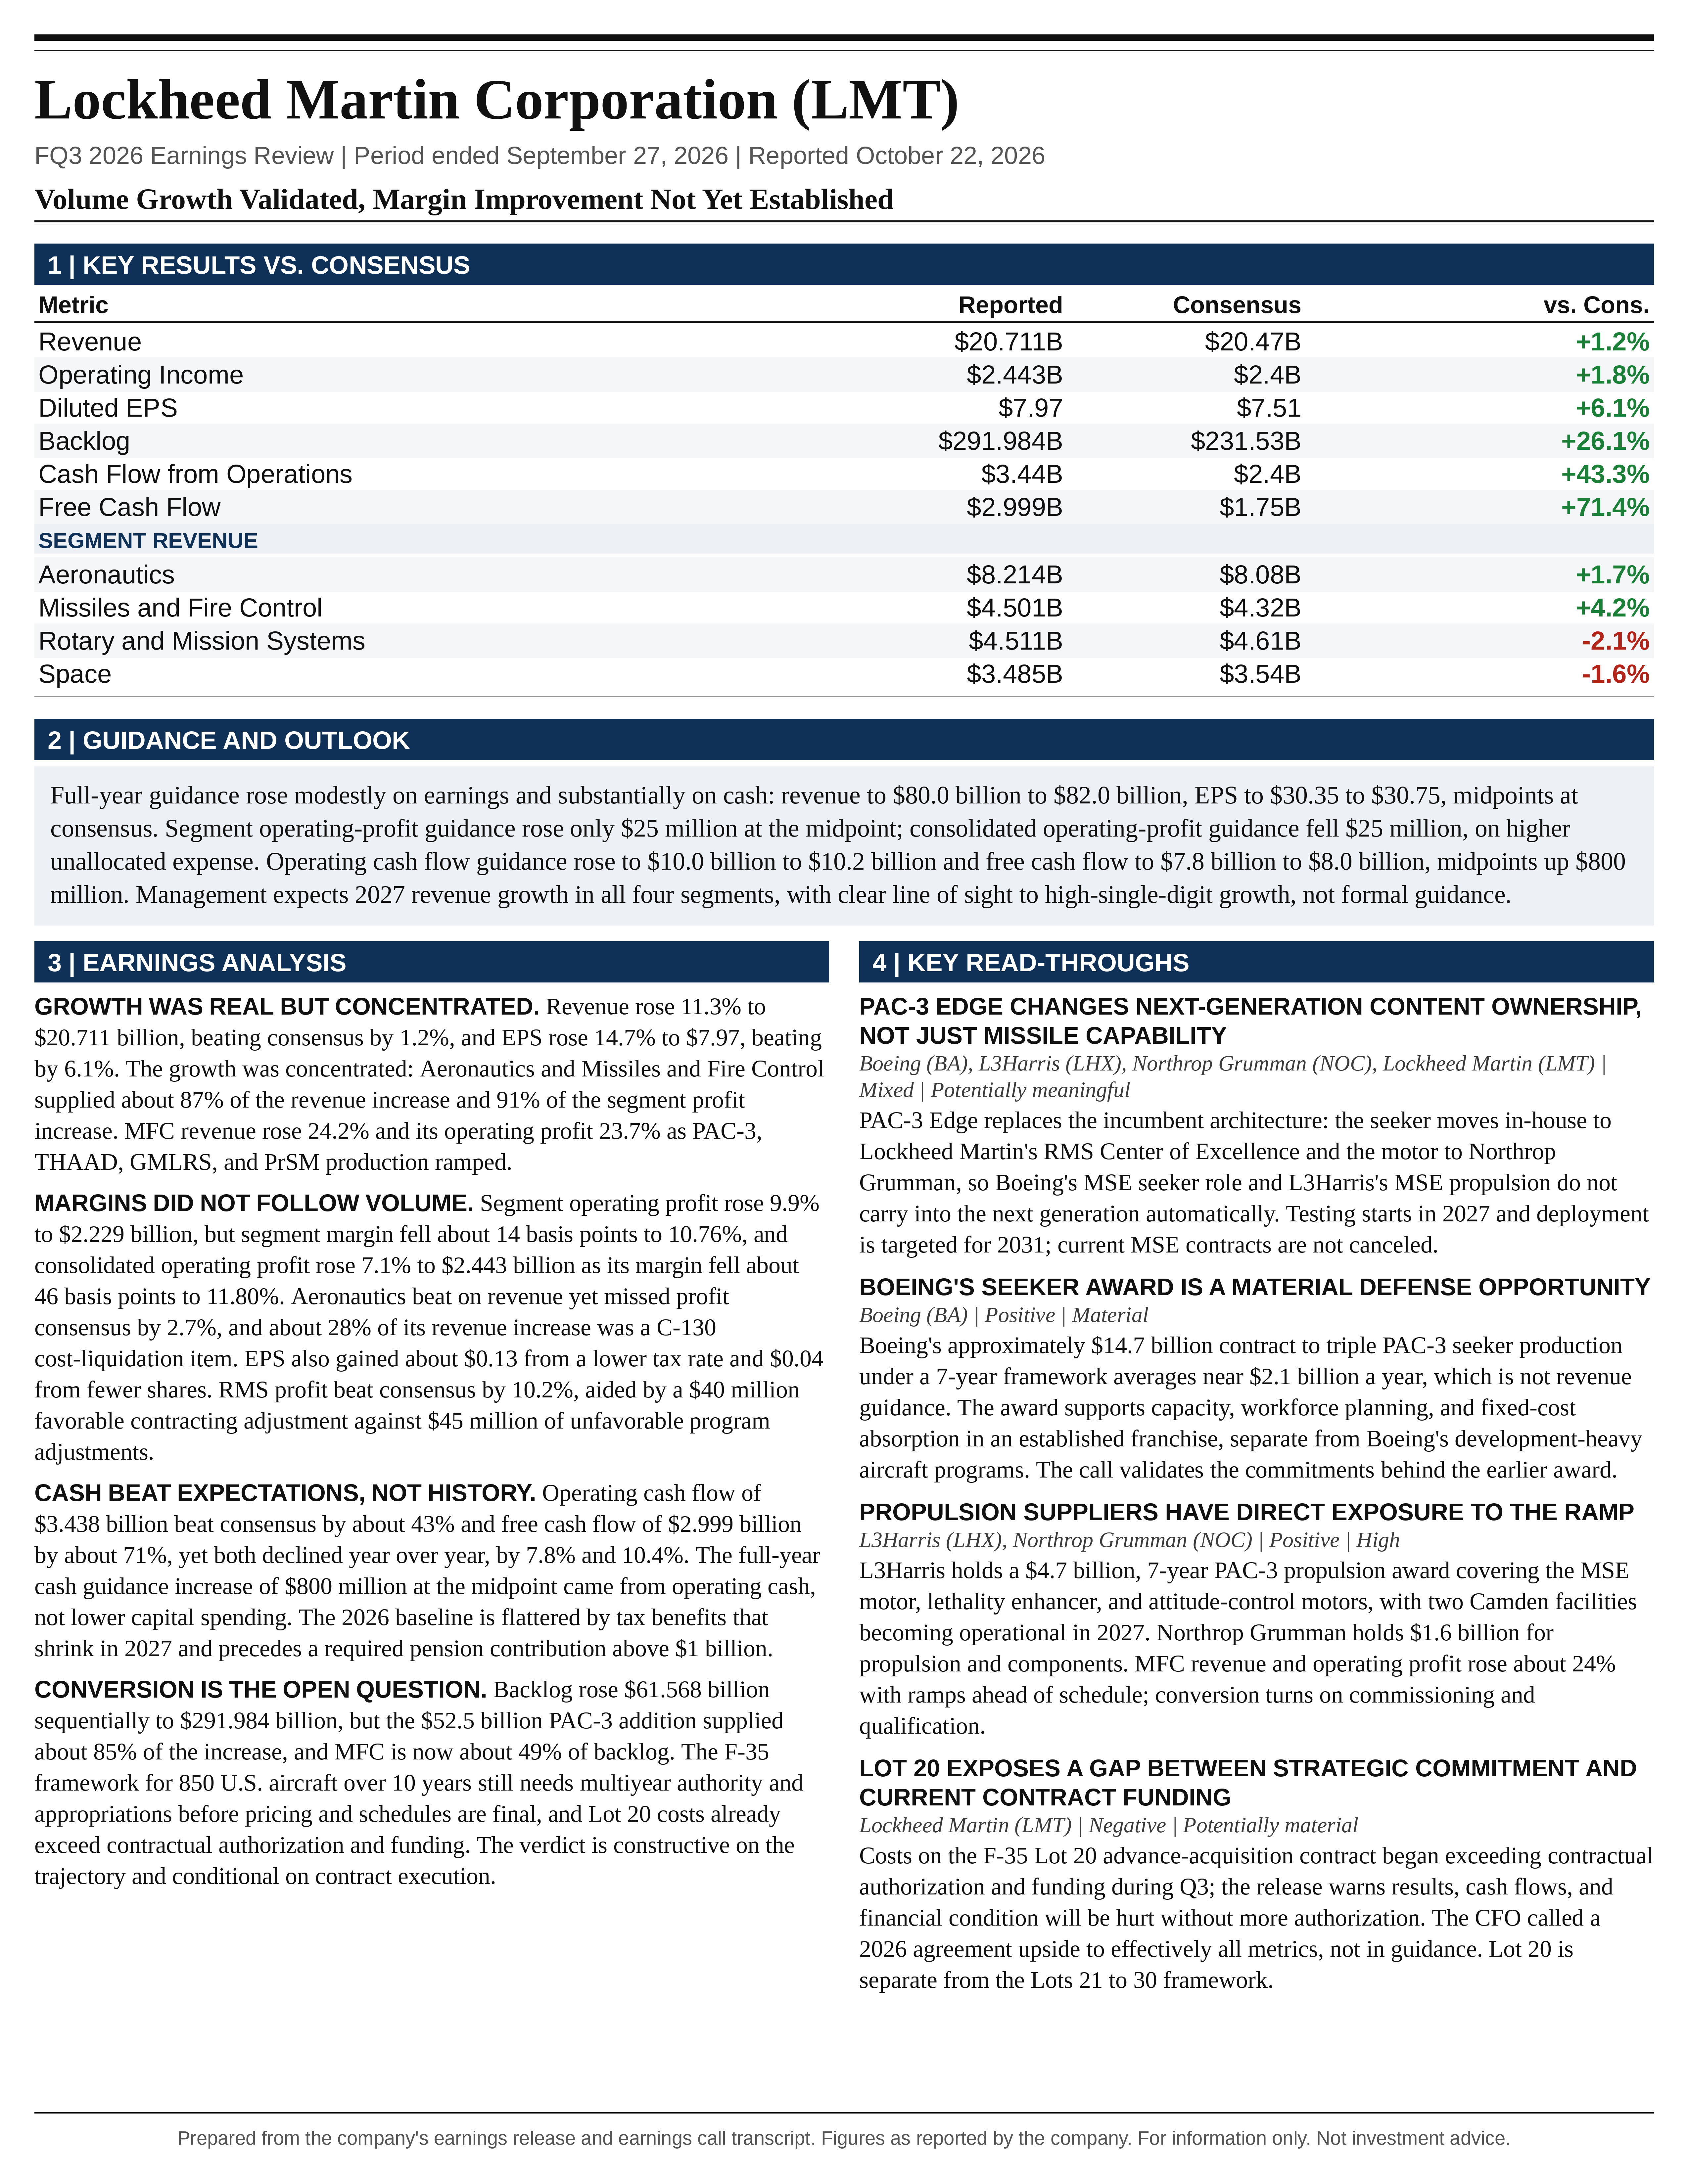
Lockheed Martin’s Q3 2026 earnings call strengthens the case for sustained revenue growth and materially improves near-term cash-generation expectations, but it does not yet establish a structural improvement in consolidated operating margins.
Download the one-page report (PDF)
View one-page exhibit
Download analysis (.md)
Download read-throughs (.md)
Post to X
One-Page Exhibit
Earnings Analysis
EXECUTIVE CALL SUMMARY: Lockheed Martin Corporation (10/22/26)
Lockheed Martin’s Q3 2026 earnings call strengthens the case for sustained revenue growth and materially improves near-term cash-generation expectations, but it does not yet establish a structural improvement in consolidated operating margins. The most important developments were the continued acceleration of missile production, the conversion of multiyear procurement commitments into record backlog, and a proposed F-35 contracting framework that could improve production stability and returns on productivity investment. The principal qualifications are equally material: final pricing and scheduling remain unresolved on important agreements, F-35 Lot 20 expenditures have exceeded existing contractual authorization and funding, and the exceptionally strong 2026 cash outlook is not a clean baseline for 2027 because of tax benefits, customer-payment timing, and a required pension contribution exceeding $1 billion.
The appropriate investment interpretation is constructive on the operating trajectory but conditional on valuation and contract execution. Maintaining existing exposure is better supported than increasing exposure solely because backlog reached $292 billion. A more aggressive investment stance requires evidence that the new contracting model translates into retained margins and sustainable cash conversion, rather than simply larger awards and earlier customer receipts. The quarter provides strong evidence of production-volume growth. It provides substantially less evidence of broad-based operating leverage.
Revenue increased 11.3% to $20.711 billion, exceeding the supplied Bloomberg consensus by 1.2%. EPS increased 14.7% to $7.97, exceeding consensus by 6.1%. Segment operating profit increased 9.9% to $2.229 billion, but segment operating margin declined approximately 14 basis points to 10.76%. Consolidated GAAP operating profit increased 7.1% to $2.443 billion, while the corresponding margin declined approximately 46 basis points to 11.80%. These distinctions matter: earnings growth was strong, but revenue growth was faster than operating-profit growth, and EPS also benefited from lower taxes and favorable changes below operating income.
The guidance revision was much more consequential for cash than for earnings. Full-year revenue guidance increased by $250 million at the midpoint, or 0.3%, and segment operating-profit guidance increased by $25 million, also approximately 0.3%. EPS guidance increased by $0.25 to a midpoint of $30.55. Free-cash-flow guidance increased by $800 million to a midpoint of $7.9 billion, an 11.3% increase. Importantly, the company’s formal reconciliation shows that the midpoint of consolidated GAAP operating-profit guidance actually declined by $25 million because higher unallocated expenses more than offset the increase in segment profit.
The strongest forward-looking statement was management’s expectation of revenue growth across all 4 segments in 2027 and “clear line of sight to high single digit revenue growth next year as a company.” That statement is supported by substantial contractual visibility, but it is not formal 2027 guidance. No corresponding 2027 margin, EPS, or free-cash-flow forecast was provided. The investment debate therefore shifts from whether demand exists to the timing, profitability, funding, and cash conversion of that demand.
REPORTED PERFORMANCE AND EARNINGS QUALITY
The financial release confirms genuine operating expansion, but the growth was considerably more concentrated than the description of broad-based strength might suggest. Aeronautics generated $958 million of the $2.102 billion year-over-year revenue increase, and Missiles and Fire Control generated $877 million. Together, these businesses accounted for approximately 87% of consolidated revenue growth. MFC contributed $121 million of the $200 million increase in segment operating profit, while Aeronautics contributed $61 million. Together, they accounted for 91% of incremental segment profit. RMS contributed the remaining $18 million, while Space operating profit was unchanged.
The consolidated earnings bridge also demonstrates why EPS growth should not be interpreted as equivalent to improved program economics. Segment profit increased $200 million, but net unallocated operating income declined $37 million, reducing the increase in consolidated operating profit to $163 million. Lower interest expense, lower non-service pension expense, and higher other non-operating income added another $71 million of pretax improvement. Pretax earnings consequently increased $234 million, compared with the $163 million increase in operating profit.
The effective tax rate declined to 15.1% from 16.5%, primarily because of increased deductions for foreign-derived deduction-eligible income. Applying the prior-year effective tax rate to current-quarter pretax earnings indicates that the tax-rate reduction contributed approximately $31 million, or $0.13 per share, to current-quarter earnings. The decline in diluted weighted-average shares from 232.8 million to 231.5 million contributed approximately another $0.04 per share. These are analytical sensitivities, not company-reported adjustments. They illustrate that part of the $1.02 EPS increase came from factors other than current-period operating execution.
Sequentially, revenue increased 3.2% from Q2, while EPS increased only 0.4%, from $7.94 to $7.97. Segment profit increased from $2.162 billion to $2.229 billion, but consolidated operating profit declined from $2.479 billion to $2.443 billion because the unallocated contribution weakened. The sequential results therefore reinforce the conclusion that operating volume is improving more clearly than consolidated profitability.
Historical comparisons require particular care because the first 9 months of 2025 included $1.615 billion of reach-forward losses on selected programs. Reported year-to-date segment operating profit increased 32.6%, from $4.685 billion to $6.214 billion. Mechanically adding those prior-year losses back would produce a 2025 comparison of $6.300 billion, slightly above the current-year result. That calculation is not a complete adjusted-earnings comparison because other program adjustments and reporting-calendar differences remain. It does, however, show why the headline year-to-date profit increase substantially overstates underlying operating improvement. The approximately 10% Q3 segment-profit increase against a cleaner quarterly comparison is more informative.
There is also an important discrepancy in the supplied Bloomberg earnings notice. RMS revenue is listed as $4.61 billion, whereas the company’s detailed release reports $4.511 billion. The company figure reconciles to consolidated revenue of $20.711 billion and is used throughout this analysis. Against the notice’s stated RMS consensus of $4.61 billion, the official result represents an approximately 2.1% revenue miss rather than an in-line outcome.
2026 GUIDANCE: A LARGE CASH UPGRADE, A MODEST OPERATING UPGRADE
Full-year revenue guidance increased to $80.0 billion-$82.0 billion from $79.75 billion-$81.75 billion. The midpoint increased from $80.75 billion to $81.0 billion, essentially matching the supplied $80.99 billion consensus. The revenue revision is positive, particularly because it absorbs the removal of an assumed 2026 F-35 award contribution, but it does not represent a material upward reset relative to market expectations.
Segment operating-profit guidance changed to $8.575 billion-$8.675 billion from $8.500 billion-$8.700 billion. The lower end increased $75 million, while the upper end declined $25 million. The midpoint increased only $25 million, and the range narrowed by 50%. The revision therefore primarily raises the downside boundary and reduces uncertainty. It should not be characterized as a large increase in the upper-end earnings opportunity.
At the midpoints, implied full-year segment operating margin remains approximately 10.65%, essentially unchanged from July. The revised forecast consequently supports a volume-led earnings thesis, not a new margin-expansion thesis.
The distinction between segment and consolidated profit is particularly important. The formal release raises expected other unallocated net expense to approximately $540 million from $490 million. With the FAS/CAS operating adjustment and intangible amortization assumptions unchanged, consolidated GAAP operating-profit guidance moves to $9.520 billion-$9.620 billion from $9.495 billion-$9.695 billion. The midpoint declines from $9.595 billion to $9.570 billion. The increase in EPS guidance therefore cannot be attributed solely to an improved consolidated operating-profit outlook.
EPS guidance increased to $30.35-$30.75 from $29.95-$30.65. The midpoint increased 0.8% to $30.55, approximately 0.7% above the supplied $30.33 consensus. The lower end increased by $0.40, while the upper end increased by $0.10. As with segment profit, much of the improvement is a higher floor rather than a substantial increase in the upper-end outcome.
The cash revision is significantly larger. Operating-cash-flow guidance increased to $10.0 billion-$10.2 billion from $9.2 billion-$9.4 billion. Free-cash-flow guidance increased to $7.8 billion-$8.0 billion from $7.0 billion-$7.2 billion. Both midpoints increased by $800 million. Capital-expenditure guidance narrowed to $2.1 billion-$2.3 billion from $2.0 billion-$2.4 billion, leaving its midpoint unchanged at $2.2 billion. The current cash upgrade therefore comes from operating cash generation rather than a new reduction in planned capital expenditures.
The comparison with April is instructive. April guidance contemplated $2.5 billion-$2.8 billion of capital spending and $6.5 billion-$6.8 billion of free cash flow. By July, the capital-spending midpoint had declined $450 million, while the operating-cash-flow midpoint remained approximately $9.3 billion. The July free-cash-flow increase was therefore substantially associated with lower expected capital expenditures. The October increase is different: the capital-spending midpoint is unchanged, while expected operating cash rises $800 million. Those revisions have different implications for the quality and durability of the cash improvement.
The year-to-date results and current guidance imply Q4 revenue of $21.205 billion-$23.205 billion and segment operating profit of $2.361 billion-$2.461 billion. At the midpoints, revenue would be $22.205 billion and segment profit $2.411 billion, implying approximately 10.86% segment margin. Remaining free cash flow would be $2.175 billion-$2.375 billion.
The reporting calendar is important. Q4 contains 14 weeks versus 13 weeks in the prior-year quarter and in Q3 2026. Midpoint Q4 revenue is approximately 7.2% above Q3, but slightly lower on a simple revenue-per-week basis. That does not establish weakening underlying demand because contract revenue is not recognized uniformly by week. It does mean that a substantial portion of sequential revenue growth can be explained by the longer reporting period. The additional Q4 week offsets a shorter Q1; the full year is not a 53-week fiscal year.
AERONAUTICS: STRONG F-35 VOLUME, WEAKER SEGMENT ECONOMICS
Aeronautics revenue increased 13.2% to $8.214 billion, exceeding the supplied consensus by approximately 1.7%. Operating profit increased 8.9% to $743 million, missing consensus by approximately 2.7%. Margin declined from 9.40% to 9.05%. The combination of a revenue beat and profit miss is the key financial signal: program volume was strong, but profitability did not fully follow.
The release identifies $710 million of higher F-35 revenue from production and sustainment and $270 million of higher C-130 revenue associated with liquidation of pre-contract costs following an award. The C-130 item represented approximately 28% of the segment’s reported revenue increase. It reflects the conversion of previously incurred activity into recognized sales, rather than a comparable increase in work performed during the quarter. It should not be extrapolated as a recurring quarterly growth contribution.
F-16 revenue declined $130 million because of lower production volume and the sales impact of unfavorable profit adjustments. Aeronautics also experienced $40 million of higher unfavorable profit adjustments on F-16 and another $40 million on C-130 relative to the prior-year quarter. These items demonstrate that execution risk remains present outside the principal F-35 production franchise.
F-35 deliveries were 43 aircraft, compared with 46 in Q3 2025. Year-to-date deliveries were 94, compared with 143. Deliveries nevertheless improved sharply from 19 in Q2 2026. The coexistence of growing F-35 revenue and lower year-over-year aircraft deliveries is not necessarily contradictory because revenue recognition, production activity, sustainment, and final aircraft acceptance occur on different timelines. It does mean that revenue growth alone is insufficient evidence that physical delivery and cash-collection milestones are progressing at the same rate.
Aeronautics’ revised full-year guidance is $31.1 billion-$32.5 billion of revenue and $2.920 billion-$2.950 billion of operating profit. Management explicitly described this as lower than July because the assumed award timing for the next F-35 production lots has shifted into 2027. The current midpoint implies approximately 9.23% full-year segment margin. That remains below the 10% threshold raised in the analyst questioning.
The CFO stated, “F-35 production is accretive to Aeronautics margins and Lockheed Martin margins.” This is an important distinction. It suggests that the main production franchise is not the principal source of the segment’s below-company-average profitability. It does not disclose production margins, quantify development and sustainment margins, or establish when Aeronautics can exceed 10%.
Management’s answer to the question about margin expansion was consequently more conceptual than quantitative. The proposed contracting model could improve supplier performance, reduce disruption costs, and allow greater retention of productivity benefits. However, no numerical margin target, implementation schedule, or explicit bridge from current segment profitability was provided.
F-35 CONTRACTING: LONG-TERM STRATEGIC PROGRESS, NEAR-TERM FUNDING EXPOSURE
The F-35 announcement is strategically important, but its legal and financial status is less definitive than some of the call’s language suggests. The company’s separate October 22 announcement describes a framework covering 850 U.S. aircraft over 10 years, initial spares, modification kits, sustainment, and international orders across Lots 21-30. It contemplates continued production of 156 aircraft annually.
The same announcement explicitly states that multiyear authority and associated appropriations must be granted before final terms, pricing, and schedules can be completed through a formal contract award. The framework therefore should not be treated as an already funded, fully priced 10-year purchase obligation. Its significance is the potential change in procurement architecture and planning visibility, not an immediately realizable addition equal to the entire prospective program value.
The production-rate arithmetic also clarifies the growth proposition. A sustained rate of 156 aircraft over 10 years implies 1,560 aircraft in total. Against the stated 850 U.S. aircraft, approximately 710 would be needed from international demand to maintain that aggregate pace, assuming the framework is implemented as described. The U.S. component averages 85 aircraft annually. The principal production benefit is stability, not an announced increase above 156 aircraft annually. Growth must additionally come from sustainment, modernization, contractual economics, and other Aeronautics programs.
The near-term issue is Lot 20, which is distinct from the proposed framework covering Lots 21-30. The formal earnings release states that costs incurred began exceeding current contractual authorization and funding on the Lot 20 advance-acquisition contract during Q3. It warns that without additional authorization and funding, future operating results, cash flows, and financial condition will be negatively affected.
This disclosure materially qualifies the call’s reassuring description of the production line. Existing advanced-procurement funding has supported work, but the release establishes that current authorization is no longer sufficient for all costs being incurred. The key near-term risk is therefore not a lack of strategic demand for the F-35. It is the financing and contractual treatment of work already progressing.
The CFO stated that a Lot 20 agreement in 2026 “would represent upside to effectively all our metrics this year” and that “it’s not counted on in our guide.” That creates a favorable timing option if the agreement is completed before year-end. However, delayed authorization is not automatically a harmless transfer of revenue from 2026 to 2027. If costs continue to accumulate without adequate contractual coverage, the delay can also increase working-capital requirements and expose recognized economics to final negotiation.
The investment significance of the new framework will ultimately depend on the final pricing baseline, escalation provisions, production and readiness obligations, treatment of specification changes, and enforceability of termination protections. The call supports improved strategic visibility. It does not eliminate near-term contractual or appropriation risk.
MISSILES AND FIRE CONTROL: THE PRIMARY ECONOMIC GROWTH ENGINE
MFC delivered the strongest operating result. Revenue increased 24.2% to $4.501 billion, approximately 4.2% above consensus. Operating profit increased 23.7% to $631 million, approximately 5.7% above consensus. Margin was 14.02%, compared with 14.07% in the prior-year quarter.
Holding margins approximately stable during a substantial production expansion is a positive execution outcome. New hiring, training, factory expansion, supplier qualification, and manufacturing ramp costs can dilute profitability before higher throughput absorbs those costs. The quarter indicates that the ramp is converting into profitable revenue without a significant margin penalty. It does not yet demonstrate a meaningful margin uplift from the new contracting model.
The revenue drivers were substantial and identifiable. Integrated air and missile defense contributed $480 million of growth, primarily from PAC-3 and THAAD production ramps. Tactical and strike missiles contributed $330 million, primarily from GMLRS and PrSM. These categories explain approximately 92% of MFC’s revenue increase and provide stronger evidence of operational momentum than broad statements about defense demand.
Full-year MFC guidance increased to $17.25 billion-$17.45 billion of revenue and $2.395 billion-$2.425 billion of operating profit. The midpoints imply approximately 13.89% margin. MFC represents approximately 21% of consolidated guided revenue but approximately 28% of guided segment operating profit, making its expansion favorable to the company’s earnings mix even without margin expansion within MFC itself.
The implied Q4 midpoint is approximately $5.099 billion of revenue and $685 million of operating profit, producing a 13.43% margin. This is below Q3’s 14.02%. The guidance therefore does not assume that stronger year-end volumes automatically produce higher MFC margins. Contract mix, ramp costs, and timing of profit recognition can continue to matter materially.
Management reiterated an expectation of a mid-teens revenue CAGR over the next 5 years. Interpreting that illustratively as 15% and applying it to the 2026 revenue midpoint would produce approximately $34.9 billion of MFC revenue after 5 years, roughly double the current base. That is an analytical illustration rather than a new management forecast for a specific year.
Even such a strong MFC trajectory does not independently establish high-single-digit consolidated growth. At its current revenue weight, 15% MFC growth contributes approximately 3.2 percentage points to company-wide growth. Achieving 8% consolidated growth would require the rest of the portfolio to grow approximately 6.1%. Sustainment, strategic missile defense, radar, command-and-control, and the delayed F-35 award therefore remain economically important rather than peripheral contributors.
The capacity program is extensive. Management described 2 million square feet of additional facilities across 8 sites over 3 years, more than 3,000 new MFC employees being hired and trained in 2026, and more than $8 billion of investment through 2030 across facilities, supply-chain expansion, and workforce development. These measures increase confidence in the company’s commitment to delivering contracted demand. They also increase the importance of training effectiveness, supplier readiness, qualification schedules, and production yields.
The $8 billion commitment should not be treated as an incremental capital-expenditure line to be added mechanically to annual guidance. It encompasses multiple investment categories, and the call does not provide a sufficiently detailed accounting classification to avoid overlap.
THE CONTRACTING MODEL: ATTRACTIVE INCENTIVES, UNRESOLVED RISK ALLOCATION
The most consequential strategic discussion concerned the economics of the multiyear contracting model. Management described 4 principal features: longer agreement duration, an agreed starting price with an industry inflation escalator, cash-flow neutrality during the investment ramp, and mechanisms to recover investment if future administrations or Congress reduce committed volumes or duration.
Taiclet stated, “We’re not going to enter into these agreements, if we can’t get at or better financial outcomes than in the past.” He also said that productivity investments would allow the company to “keep the increased profitability under that fixed price escalator.” These statements articulate an economically attractive objective: a longer period over which productivity improvements can be retained rather than quickly reflected in negotiated customer pricing.
The potential value is meaningful. Longer demand visibility can support automation, supplier consolidation, workforce stability, and better purchasing economics. If pricing escalates while actual unit costs improve, operating margins can expand without relying on higher production volumes alone. A more predictable production system can also reduce expensive schedule recovery, rework, and supplier-disruption costs.
However, management also stated, “What is left to work is the finalization on the profit terms and on the schedule itself.” That qualification is central. Framework provisions can establish broad commercial principles without settling the precise economic allocation of cost, delivery, and performance risk. The call supports an opportunity for improved returns, not a completed transfer of those returns into contracted margins.
An inflation escalator is not equivalent to complete cost protection. The relevant index may differ from actual changes in specialized labor, propulsion components, electronics, energetics, or other constrained inputs. Contract economics can also depend on escalation lags, caps, starting-year assumptions, and the treatment of customer-directed changes. Specific protections were not disclosed.
Cash-flow neutrality likewise should not be confused with cost reimbursement or permanent economic subsidy. The analyst explicitly asked whether investments are reimbursed or supported through advances that are recovered in future unit pricing. Management explained the intended cash outcome but did not resolve that distinction. Customer advances can protect cash during the investment phase while reducing later cash collections relative to revenue. Direct reimbursement, altered milestone terms, and recoverable advances can have materially different lifetime economics.
Investment-recovery provisions are valuable but narrower than a guarantee of profits. Recovery of qualifying investment following reduced volumes does not necessarily compensate for lost future earnings, idle capacity, delayed payment, or every category of committed expenditure. The extent of recovery depends on executed language and qualifying costs.
Supply-chain economics are particularly important because management indicated that suppliers account for approximately 60% of end-product inputs. MFC’s success depends not only on Lockheed Martin’s internal productivity but also on propulsion, seekers, materials, electronics, and supplier manufacturing execution. The announced $4.7 billion L3Harris contract, $14.7 billion Boeing contract, and $1.6 billion Northrop Grumman contract demonstrate significant downstream commitments. Their values should not be subtracted from the PAC-3 contract value to infer a program margin because their scopes, periods, and included components differ.
Commercial partnerships can reduce Lockheed Martin’s direct capital intensity, but they do not eliminate system-wide investment costs. GM Defense and Hadrian may accelerate component availability and reduce the requirement for owned equipment, while transferring part of the economics into purchased-component or manufacturing-service pricing. The relevant measure is lifecycle return on invested capital and delivery reliability, not simply the amount of capital expenditure avoided internally.
BACKLOG: STRONG VISIBILITY, HIGH CONCENTRATION, AND LONGER DURATION
Backlog increased to $291.984 billion from $230.416 billion at the end of Q2, a sequential increase of $61.568 billion, or 26.7%. Adding quarterly revenue to the backlog change implies approximately $82.279 billion of net order intake, subject to other backlog adjustments. That is consistent with management’s approximately 4.0 times book-to-bill.
The $52.5 billion PAC-3 backlog addition explains approximately 85% of the sequential backlog increase and approximately 64% of implied quarterly orders. Excluding that specific addition, the same simplified calculation produces book-to-bill of approximately 1.44 times. This remains healthy, but it is much less exceptional than the headline 4.0 times. It is not a normalized recurring order rate because other multiyear awards and adjustments remain.
The call’s reference to a PAC-3 agreement worth up to $58.6 billion and the release’s $52.5 billion backlog addition describe different quantities. A contract’s maximum value is not necessarily identical to newly recognized backlog. The figures should neither be combined nor treated as interchangeable.
MFC backlog reached $142.517 billion, approximately 49% of total company backlog and approximately 8.2 times the segment’s current annual revenue midpoint. MFC accounted for approximately 97% of the increase in consolidated backlog since year-end 2025. Aeronautics backlog, by contrast, was $57.331 billion, below the $59.435 billion reported at year-end.
The backlog transformation is therefore highly concentrated in missiles, despite revenue growth across all 4 segments. This is economically attractive because MFC currently has the highest segment margin. It also increases exposure to the successful industrialization and funding of a relatively concentrated set of large missile programs.
Total backlog is approximately 3.6 times the consolidated annual revenue midpoint. That provides substantial visibility but does not mean 3.6 years of revenue is fully funded, protected from termination, or executable at current margins. Longer-duration contracts increase reported backlog by extending the period covered. The fundamental improvement depends on annual production schedules, funding, profitability, and delivery conversion, not backlog duration alone.
The backlog exceeded the supplied $231.53 billion consensus by approximately $60.45 billion, or 26.1%. That comparison is notable, but the consensus contained only 2 estimates and is particularly sensitive to whether the PAC-3 award was included in forecast assumptions. The underlying contractual development matters more than the percentage surprise against a thin estimate sample.
ROTARY AND MISSION SYSTEMS: MODEST GROWTH AND MIXED ADJUSTMENTS
RMS revenue increased 3.2% to $4.511 billion, while operating profit increased 3.6% to $524 million. Margin was essentially unchanged at 11.6%. Radar activity was the principal revenue driver, with Sensors, Effectors and Mission Systems contributing approximately $140 million of additional sales.
The release provides an important balance to the call’s emphasis on a favorable contracting resolution. RMS recognized a $40 million favorable profit adjustment from that resolution but also $45 million of unfavorable adjustments on Heavy Lift and Seahawk programs. The specified items therefore netted to a $5 million adverse effect.
The $40 million favorable item was significant relative to the $18 million year-over-year profit increase and the approximately $49 million beat against supplied operating-profit consensus. However, attributing the entire beat to that item would be inappropriate without knowing how expectations treated both the favorable resolution and the unfavorable program adjustments. Similarly, removing the favorable item while ignoring the adverse adjustments would produce a misleading normalization.
Full-year guidance is $17.7 billion-$18.0 billion of revenue and $1.880 billion-$1.900 billion of operating profit. The midpoint implies approximately 10.59% margin. The implied Q4 midpoint is approximately $4.994 billion of revenue and $506 million of operating profit, producing a 10.13% margin. The guidance does not assume that Q3’s reported 11.6% margin persists.
The strategic opportunity is broader than the current growth rate. Radar, battle management, integrated air defense, maritime autonomy, and command-and-control can create demand less directly dependent on a single platform’s production rate. The Australian AIR 6500 award and submarine combat-systems integration work support that proposition. Nevertheless, neither the call nor the release establishes software-like recurring revenue, subscription economics, or structurally higher margins for these activities. Strategic positioning should not automatically be converted into a technology valuation premium.
SPACE: STRATEGIC PROGRAM STRENGTH, LIMITED CURRENT PROFIT CONVERSION
Space revenue increased 3.8% to $3.485 billion, approximately 1.6% below consensus. Operating profit was unchanged at $331 million, approximately 5.1% below consensus. Margin declined from 9.86% to 9.50%.
Strategic and missile-defense programs contributed $185 million of higher revenue, principally Fleet Ballistic Missile and Next Generation Interceptor. This was partially offset by a $115 million decline in national-security-space revenue associated with the OPIR program lifecycle. The segment therefore illustrates the distinction between demand in selected priority programs and growth across the full portfolio.
Year-to-date operating profit was $983 million, down from $1.072 billion, despite higher revenue. The near-term investment case remains dependent on improved program mix and execution rather than an already demonstrated segment-wide profit acceleration.
Full-year guidance increased to $13.95 billion-$14.05 billion of revenue and $1.380 billion-$1.400 billion of operating profit. The midpoint implies approximately 9.93% margin. Based on year-to-date results, the implied Q4 midpoint is $3.591 billion of revenue and $407 million of operating profit, or approximately 11.33% margin.
That implied Q4 margin is materially above Q3, and management explicitly excluded ULA equity earnings from the Q4 forecast. The guidance therefore requires stronger profitability from the remaining segment economics rather than an assumed ULA earnings contribution. The source of that improvement was not quantified sufficiently to determine how much comes from mix, milestones, or contract profit adjustments.
Excluding ULA equity earnings does not eliminate ULA-related financial risk. The release separately identifies guarantees and expected additional financial support for the joint venture among relevant risks. Earnings contribution, cash support, and contingent obligations should be evaluated separately.
NGI’s stated 2030 fielding objective supports a multiyear revenue opportunity. A successful motor test is a useful technical milestone but does not independently validate final system performance, schedule, or ultimate program margin. The same distinction applies to modular hypersonic systems: technical progress expands opportunity, while qualification, repeatable manufacturing, procurement decisions, and cost performance determine financial value.
CASH FLOW: EXCELLENT AGAINST EXPECTATIONS, LESS CLEAN AS A RECURRING BASELINE
Q3 operating cash flow was $3.438 billion, approximately 43% above the supplied $2.4 billion consensus. Free cash flow was $2.999 billion, approximately 71% above the $1.75 billion consensus. These were substantial positive surprises.
However, operating cash flow declined 7.8% year over year, while free cash flow declined 10.4%. The company attributed the decline primarily to higher customer receipts in Q3 2025. The quarter was therefore exceptionally strong relative to expectations, not a new year-over-year cash-generation record.
Year-to-date free cash flow increased 35.5% to $5.625 billion, exceeding year-to-date net earnings of $5.169 billion. This is a favorable aggregate conversion result. Nevertheless, the balance sheet and cash-flow statement show that working-capital requirements remain significant.
Contract assets increased $3.898 billion from year-end, while contract liabilities increased $1.204 billion. The difference between those balances expanded by approximately $2.694 billion. Receivables released $805 million of cash, and the cash-flow statement records $1.488 billion of cash support from accounts payable. These figures indicate that customer receipts and supplier-payment timing helped offset a substantial buildup in contract assets.
Strong quarterly collections can coexist with a larger year-to-date investment in unbilled or not-yet-billable contract activity. The concern is not that cash generation is unsupported. It is that the relationship between reported earnings, contract execution, authorization, and cash collection remains important, particularly given the Lot 20 funding disclosure.
At the full-year midpoint, Q4 operating cash flow would be approximately $3.207 billion, capital expenditures approximately $932 million, and free cash flow approximately $2.275 billion. The implied capital spending is more than double Q3’s $439 million. The annual outlook therefore still requires a substantial year-end investment ramp. The Q3 free-cash-flow result should not be annualized.
Tax benefits are another important normalization issue. Management said the “tax benefit is more than a single year benefit,” but also indicated that the benefit would be smaller in 2027 than in 2026. The draft then describes a “slight tailwind” year over year. Those statements do not provide a consistent quantitative bridge. A tax benefit can remain positive relative to a no-benefit baseline while becoming a headwind relative to the unusually favorable prior year. The unresolved issue is the amount of recurring tax savings versus timing-related cash benefit.
The required 2027 pension contribution exceeds $1 billion. That amount is more than 12.7% of the current $7.9 billion free-cash-flow midpoint. As a simple sensitivity, subtracting $1 billion from that midpoint produces $6.9 billion before considering revenue growth, changes in margins, working capital, taxes, capital expenditures, acquisitions, or the fact that the required contribution is greater than $1 billion. This is not a 2027 forecast, but it demonstrates why the 2026 cash upgrade cannot be extrapolated directly.
Management may prefund the pension in 2026. Doing so would shift the calendar-year cash burden rather than remove it. A rigorous valuation should consider cash generation across both periods, rather than assigning a higher multiple to whichever year benefits from the timing decision.
Pension accounting also needs to remain separate from pension cash funding. The 2026 outlook includes a $1.365 billion total FAS/CAS pension adjustment. Such accounting income does not imply an equivalent cash inflow and does not offset the economic significance of required contributions.
CAPITAL ALLOCATION AND ULTRA MARITIME
The quarterly dividend increased by $0.15 to $3.60, a 4.3% increase and the 24th consecutive annual increase. The new annualized dividend is $14.40 per share, approximately 47% of the full-year EPS midpoint. Using approximately 230 million shares, the forward annual dividend requirement is roughly $3.3 billion, or approximately 42% of the guided free-cash-flow midpoint.
Dividend coverage appears adequate on the disclosed cash outlook. The more relevant capital-allocation question concerns the residual capacity for acquisitions, pension funding, capacity expansion, and repurchases.
The cash-flow statement shows no share repurchases during the first 9 months of 2026, compared with $2.250 billion in the corresponding 2025 period. EPS modeling should therefore not assume that historical buyback activity resumes automatically. The small year-over-year reduction in weighted-average shares does not establish a current repurchase program contributing materially to earnings growth.
Ultra Maritime is expected to close in Q4, with all required regulatory approvals cleared. The July buyer and seller announcements specify a $3.45 billion acquisition price. The business will enter RMS and adds sonar, sonobuoy, torpedo-defense, radar, and autonomous maritime-sensing capabilities.
The strategic rationale is consistent with the call’s emphasis on integration and undersea warfare. Ultra’s products can complement existing naval systems and broaden exposure to expendable sensors and autonomous platforms. The seller reported approximately 17% annual revenue growth over the preceding 3 years, but that seller-provided historical rate should not be adopted as a post-acquisition forecast without examining the underlying revenue base, profitability, and program mix.
The acquisition remains excluded from current guidance. Any subsequent increase in reported revenue or profit must therefore be separated into acquired contribution and underlying operating revisions. The absence of disclosed transaction EBITDA, purchase-accounting charges, detailed synergies, and financing-related earnings effects prevents a reliable acquisition-return or EPS-accretion calculation from the call alone.
Quarter-end cash was $5.960 billion, and debt was approximately $20.498 billion, implying net debt of approximately $14.538 billion. A static subtraction of the $3.45 billion purchase price leaves approximately $2.510 billion of cash and increases net debt to approximately $17.988 billion, before Q4 cash generation, dividends, pension funding, fees, or other movements. Funding the deal from cash avoids new borrowing but does not avoid an increase in net financial leverage.
The acquisition purchase price is not deducted in the company’s reported free-cash-flow measure, which is operating cash flow less capital expenditures. It nevertheless reduces financial flexibility and must be included in an assessment of cash available to equity holders.
2027 AND LONGER-TERM GROWTH
Management’s preliminary 2027 outlook is supported by several identifiable drivers: MFC production ramps, F-35 sustainment, the shifted F-35 contract-award assumption, radar and command-and-control demand, and strategic missile-defense programs. The statement that all 4 segments should grow is more informative than an undifferentiated expectation of higher defense spending.
The 2027 revenue outlook should nevertheless be treated as directional rather than formal guidance. Management deferred detailed guidance until January and did not specify the acquisition perimeter of the preliminary company-wide growth statement. Ultra’s contribution, the timing of contract recognition, and comparisons affected by the reporting calendar will need to be separated from organic operating growth.
The strongest longer-term support comes from contracted missile requirements and the expanding installed base of defense platforms requiring sustainment. Those demand sources are more tangible than expectations that future budget legislation will remain favorable indefinitely.
Management’s description of defense demand as effectively permanent should not be adopted as an underwriting assumption. Strategic threats can support spending over long periods, but the allocation of funds among platforms, munitions, sustainment, personnel, and new technologies changes. Customer urgency also does not eliminate pressure on affordability or contractor returns.
The continuing resolution creates timing risk even if strategic demand remains intact. Management argued that continuing resolutions affect new starts rather than the direction of demand. That is a reasonable distinction, but it does not make timing economically neutral. Delayed awards can defer revenue, increase contract assets, delay reimbursement, and alter production efficiency. The Lot 20 disclosure demonstrates that budget and authorization timing can affect an established franchise as well as new programs.
TECHNOLOGY STRATEGY: VALUABLE OPTIONALITY, NOT YET A SEPARATE EARNINGS STREAM
The technology discussion supports a coherent strategic shift from independent platform development toward cross-domain integration, faster prototyping, and greater use of commercial partners. Its potential value lies in defending existing franchises while expanding the number of missions and platforms served by common sensors, autonomy software, seekers, and battle-management capabilities.
Vectis is the clearest example of greater internally funded commitment ahead of formal procurement. Management authorized construction of 5 aircraft and expects flight demonstrations in 2027. Successful demonstrations could improve positioning for future collaborative combat aircraft requirements and allied opportunities.
However, company-funded prototypes remain investment exposure rather than contracted production revenue. The financial outcome depends on requirement alignment, competition, export approvals, affordability, and procurement timing. Designing for allied releasability may improve the addressable market, but it does not guarantee authorization to export.
Management’s objective of incorporating advanced capabilities into the F-35 to achieve 80% of a clean-sheet next-generation aircraft’s capability at 50% of its cost is a strategic proposition, not an independently verified technical or economic result. It could strengthen the installed platform’s relevance, but the capability and cost comparisons require specific mission assumptions and customer validation.
The PrSM progression from testing to a $1.2 billion production contract provides stronger evidence of commercialization than a prototype announcement alone. Similarly, the Australian AIR 6500 award demonstrates demand for integration capability. These awarded programs deserve greater weight in near-term financial expectations than demonstrations without disclosed production commitments.
Reusable counter-drone systems, modular launchers, and autonomous maritime platforms address a legitimate cost-exchange problem. Expensive interceptors cannot economically address every low-cost threat. Nevertheless, advertised demonstration performance does not establish field reliability, lifecycle cost, manufacturing yield, or sustained customer adoption.
The common-component strategy can potentially reduce development duplication and improve supply-chain control. Internal transfers between RMS and MFC, however, are not incremental consolidated revenue. The economic benefit must appear through external sales, lower costs, better execution, or improved returns on development spending.
The $599 million of Q3 independent research and development and approximately $1.6 billion year to date show that this strategy has a current earnings and cash cost. The investment case should not capitalize speculative future platforms while ignoring the expenditure required to establish them.
INVESTMENT SCENARIOS AND VALUATION DISCIPLINE
The following scenarios are analytical operating cases rather than company guidance or consensus forecasts. They use the $81 billion 2026 revenue midpoint as the starting base and exclude an unquantified Ultra Maritime contribution to maintain comparability. Cash-flow cases assume that the required pension contribution is made in 2027 rather than prefunded in 2026.
The base case, assigned a 55% probability, assumes approximately 8% revenue growth to $87.5 billion in 2027 and a 10.7% segment operating margin, producing approximately $9.36 billion of segment operating profit. MFC continues to grow rapidly, F-35 funding is resolved without a material economic penalty, and the rest of the portfolio delivers moderate growth. Free cash flow of approximately $7.0 billion-$7.8 billion would reflect operating improvement offset by pension funding and reduced tax benefits. This case supports earnings durability without requiring an immediate step-change in margins.
The bull case, assigned a 25% probability, assumes approximately 10% revenue growth to $89.1 billion and a segment margin of 11.2%, producing approximately $9.98 billion of segment operating profit. Contract finalization preserves attractive pricing, productivity gains begin to appear in margins, supplier expansion remains ahead of schedule, and F-35 sustainment and award conversion provide incremental upside. Free cash flow of approximately $8.0 billion-$8.5 billion would require favorable collections and operating performance sufficient to absorb pension funding.
The bear case, assigned a 20% probability, assumes approximately 4% revenue growth to $84.2 billion and a segment margin of 10.0%, producing approximately $8.42 billion of segment operating profit. Demand remains substantial, but funding delays, adverse contract economics, supplier constraints, or additional program charges weaken conversion. Free cash flow of approximately $5.8 billion-$6.5 billion would reflect pension funding alongside less favorable taxes and working capital. The principal downside is poor conversion of visible demand, not necessarily disappearance of that demand.
These scenarios should be revised when January guidance clarifies pension timing, cash taxes, acquisition contribution, and contract assumptions. Their probabilities are judgmental rather than statistically estimated.
Valuation is highly sensitive to normalized cash flow. At approximately 231.5 million diluted shares, each $1 billion of annual free cash flow represents approximately $4.32 per share. Capitalized at an illustrative 6% free-cash-flow yield, that difference represents approximately $72 per share of equity value. Distinguishing recurring operating improvement from temporary tax and collection benefits is therefore potentially more important than modest changes in the EPS forecast.
For illustration, $7.9 billion of sustainable annual free cash flow would correspond to approximately $569 per share at a 6% yield. A $6.9 billion baseline would correspond to approximately $497 per share. These are valuation sensitivities, not price targets, and they do not incorporate all changes in net debt, acquisition economics, or cash-flow timing. A recurring cash-flow assumption is required before either figure can be used as an investment threshold.
Margin execution also has substantial earnings leverage. On $81 billion of revenue, a 100-basis-point change in segment margin represents approximately $810 million of pretax profit. At an illustrative 15% tax rate and 231.5 million shares, that is approximately $3.0 per share before associated changes elsewhere in the income statement. The opportunity from retaining productivity gains is meaningful, but an adverse shift in contract economics has similarly material consequences.
The investment conclusion is therefore to favor disciplined retention of exposure over indiscriminate buying of backlog growth. New capital should require an adequate yield on normalized, post-pension cash generation and credible resolution of the F-35 authorization gap. A valuation that assumes both sustained high-single-digit growth and immediate structural margin expansion would embed more than the quarter has demonstrated.
CATALYSTS, POSITION RISK, AND THESIS INVALIDATION
The most important near-term catalysts are additional Lot 20 authorization and funding, completion of the Ultra Maritime acquisition, the decision on pension prefunding, and execution against the substantial Q4 revenue, capital-spending, and cash-flow requirements. Congressional authority and appropriations for the F-35 multiyear framework are separate catalysts from the framework announcement itself.
January 2027 guidance is the principal financial validation event. It should clarify the relationship among revenue growth, segment margins, tax benefits, pension contributions, capital expenditures, and acquired revenue. A high-growth revenue forecast accompanied by weak underlying cash conversion would be a materially different outcome from balanced growth in revenue, profit, and cash.
During 2027, the key operating indicators are missile deliveries, manufacturing yields, supplier performance, contract-asset growth, F-35 delivery and sustainment execution, and evidence that the new pricing structure is producing retained productivity benefits. Vectis flight demonstrations provide an additional strategic catalyst but should have less weight in near-term earnings estimates than executed procurement and delivery milestones.
The constructive thesis would be weakened by continued work beyond contractual funding without timely resolution, final multiyear terms that fail to preserve expected economics, sustained deterioration in MFC margins, further material Aeronautics or helicopter program charges, or rising contract assets without corresponding future cash conversion. Failure to demonstrate broadly distributed growth outside MFC would also weaken the case for sustained high-single-digit consolidated growth.
Portfolio exposure should be evaluated as a combination of U.S. government budget risk, missile-production execution, F-35 economics, and long-duration industrial growth. The position can diversify some commercial technology and consumer-cycle exposures, but it can materially increase concentration when combined with other defense primes and key suppliers. Actual portfolio correlations and aggregate exposure cannot be determined without holdings data.
For a new position under these unresolved conditions, an illustrative initial allocation no larger than 1% of portfolio NAV would limit exposure while contractual and cash-flow questions are resolved. A 10% position drawdown would correspond to approximately 10 basis points of NAV at that size, before gaps or slippage. Any such price-risk limit should supplement, not replace, thesis-based exit triggers. Larger sizing would require greater confidence in normalized cash generation and the final contract economics.
The central conclusion is that Q3 validates a stronger volume-growth franchise and substantially improves near-term liquidity, but the evidence for a structurally higher-return business remains incomplete. The next stage of value creation depends on converting long-duration demand into funded production, retained margins, and cash flow that remains strong after pension obligations and temporary benefits normalize.
SOURCE AND INTERPRETATION NOTES
Financial comparisons use Lockheed Martin’s October 22, 2026 earnings release and detailed financial statements, its July 23, 2026 earnings release, the supplied Q3 call transcript and Bloomberg consensus notice, the October 22 F-35 framework announcement, and the July 6 buyer and seller announcements for Ultra Maritime. Written company financial tables take precedence where the draft transcript or supplied notice conflicts with them. Exact consolidated prior-guidance ranges are verified in the company releases; segment-level revision directions follow the current call where complete prior segment ranges were not independently established. Calculated margins, implied Q4 results, backlog bridges, valuation sensitivities, and scenario probabilities are analytical derivations rather than management forecasts.
COMPANY EMPLOYEES ON THE CALL
• Jim Taiclet, Chairman, President and Chief Executive Officer. • Evan Scott, Chief Financial Officer. • Mark Kavaznik, Vice President, Investor Relations.
The draft’s unidentified speaker labels do not establish an additional separately identifiable company employee.
RESEARCH ANALYSTS ON THE CALL
• Gavin Parsons, UBS. Identified by the operator despite an unidentified-participant label in the draft. • Ronald Epstein, Bank of America. • Noah Poponak, Goldman Sachs. • Sheila Kahyaoglu, Jefferies. • Myles Walton, Wolfe Research. • John Godyn, Citi.
Key Read-Throughs
KEY READ-THROUGHS FROM LOCKHEED MARTIN’S Q3 2026 EARNINGS CALL
Lockheed Martin’s results provide strong evidence that the missile-production expansion is becoming a funded industrial cycle rather than remaining a defense-budget narrative. The clearest beneficiaries are identified suppliers of seekers, propulsion systems, and established aircraft structures. However, expanding program demand does not guarantee that incumbent suppliers retain their content on the next generation of weapons. The most important less-obvious development is PAC-3 Edge’s proposed component architecture: Lockheed Martin is bringing the seeker in-house and using a Northrop Grumman motor, creating a different supplier configuration from PAC-3 MSE. Separately, the F-35 framework improves long-term planning visibility while unresolved Lot 20 funding creates a nearer-term cash-conversion risk. These developments favor selective exposure to specific programs and components rather than an indiscriminate defense-sector revaluation. Magnitude assessments below refer to business and franchise effects, not predicted share-price changes.
MISSILE DEFENSE, PROPULSION AND AIR-TO-AIR WEAPONS
PAC-3 EDGE CHANGES NEXT-GENERATION CONTENT OWNERSHIP, NOT JUST MISSILE CAPABILITY (READ-THROUGH 1)
Affected companies: Boeing (BA: United States), L3Harris Technologies (LHX: United States), Northrop Grumman (NOC: United States), and Lockheed Martin (LMT: United States). Directional impact: negative for Boeing’s and L3Harris’s opportunity to carry their existing PAC-3 MSE content automatically into Edge; positive for Northrop Grumman’s propulsion opportunity and Lockheed Martin’s internal component capture. Magnitude: potentially meaningful at the program level, but limited near-term consolidated earnings impact. This is a longer-duration competitive shift, not a current production-contract loss.
Call evidence: Management described PAC-3 Edge as incorporating “a new seeker from our key component Center of Excellence at RMS made in Lockheed Martin,” alongside a multi-pulse motor. The associated company announcement identifies the seeker as a Lockheed Martin Strigo Product Center product and the motor as a Northrop Grumman design. It schedules testing to begin in 2027 and targets deployment by 2031, subject to successful development and procurement.
The transmission mechanism is unusually specific. Boeing supplies the seeker for PAC-3 MSE, while L3Harris supplies MSE propulsion, including its main motor. Edge’s disclosed architecture therefore does not preserve those incumbent positions in the same form. Lockheed Martin would retain seeker economics internally, and Northrop Grumman would obtain propulsion content on the proposed new interceptor. This is more consequential than a generic statement that defense primes are pursuing vertical integration because the affected subsystem and intended replacement architecture are identified.
The important limitation is that Edge remains in competition and is positioned within a layered interceptor family alongside MSE and ACE. Its development does not cancel Boeing’s or L3Harris’s current MSE contracts, establish an immediate replacement schedule, or demonstrate that existing production will decline. The high-conviction conclusion concerns future content ownership, not a quantified revenue loss. A valuation that treats today’s MSE supplier positions as permanent across every subsequent PAC-3 variant would nevertheless be too generous.
Cross-portfolio implication: Boeing and L3Harris can benefit substantially from the current interceptor ramp while Northrop Grumman gains relative positioning on the next-generation architecture. These exposures are not economically interchangeable. The next relevant catalysts are Edge’s 2027 testing and subsequent competitive milestones, rather than quarterly MSE deliveries alone.
BOEING’S SEEKER AWARD IS A MATERIAL DEFENSE OPPORTUNITY THAT SHOULD BE SEPARATED FROM ITS AIRCRAFT PROGRAM RISKS (READ-THROUGH 2)
Affected company: Boeing (BA: United States). Directional impact: positive. Magnitude: material for the PAC-3 seeker franchise and potentially meaningful for Defense, Space & Security, but insufficient by itself to resolve Boeing’s consolidated earnings and cash-flow risks. Near-term relevance comes from order conversion and production execution; the principal economic benefit extends over the multiyear ramp.
Call evidence: Lockheed Martin stated that it awarded Boeing a $14.7 billion contract “to triple PAC-3 seeker production.” Boeing’s October 5 announcement confirms an approximately $14.7 billion undefinitized contract action supporting a 7-year framework.
The mechanism is direct: additional PAC-3 MSE production requires additional Boeing-built seekers. Longer visibility supports dedicated manufacturing capacity, workforce planning, supplier commitments, and greater absorption of fixed production costs. Unlike a speculative new platform, this is an established component entering a larger production cycle. That makes the opportunity analytically distinct from Boeing’s development-heavy aircraft programs.
Dividing the headline value by 7 produces an approximately $2.1 billion annual average contract scale. That is not annual revenue guidance, and it is not entirely incremental to existing sales. Production will ramp unevenly, the award supports an existing franchise, and final contractual economics remain important. Nevertheless, the size demonstrates that this is more than a peripheral defense announcement.
The principal near-term limitation is that the award was announced before the earnings call. The call validates Lockheed Martin’s corresponding production commitments rather than introducing the entire $14.7 billion opportunity as new information. Subsequent Boeing disclosures on seeker throughput, contract definitization, capital requirements, and margins are more useful trading catalysts than repeated references to the headline award.
The positive read-through should also remain bounded by the distinction in Read-Through 1: the MSE contract strengthens Boeing’s current franchise, while Edge creates a separate question about next-generation content. Strong existing backlog and weaker future content continuity can coexist.
PROPULSION SUPPLIERS HAVE DIRECT EXPOSURE TO THE RAMP, WITH 2027 CAPACITY COMMISSIONING A KEY CONVERSION EVENT (READ-THROUGH 3)
Affected companies: L3Harris Technologies (LHX: United States) and Northrop Grumman (NOC: United States). Directional impact: positive. Magnitude: high within the relevant propulsion franchises and moderate at the diversified parent-company level. The immediate read-through concerns contracted demand; the larger revenue and productivity benefits depend on capacity becoming operational.
Call evidence: Lockheed Martin cited a $4.7 billion PAC-3 propulsion supply contract with L3Harris and a $1.6 billion contract with Northrop Grumman for propulsion and other missile components. MFC revenue and operating profit both increased approximately 24%, and management said production ramps were progressing ahead of schedule.
L3Harris’s September 8 announcement confirms that its award is a 7-year undefinitized contract covering the MSE motor, lethality enhancer, and attitude-control motors. It also identifies 2 new Camden facilities expected to become operational in 2027. The simple annual average of the $4.7 billion award is approximately $671 million, although neither revenue timing nor incremental content can be inferred by straight-line division.
The transmission mechanism is stronger than a general defense-spending correlation. Propulsion content is required to manufacture the weapons already being ramped, and Lockheed Martin’s current revenue growth demonstrates downstream production activity rather than only future demand. Successful commissioning can convert existing order visibility into higher deliveries, improved equipment utilization, and potentially better cost absorption.
The cash-flow implications require more caution. Lockheed Martin described customer-supported “cash neutrality” during the investment phase, but that does not establish identical protections for every supplier. L3Harris and Northrop Grumman must still finance, qualify, staff, and execute their own expansions under their specific contract terms. Supplier working capital, capital spending, and final pricing can therefore diverge from the prime contractor’s cash profile.
The most actionable distinction is between order visibility and production readiness. Facility commissioning and qualification in 2027 are tangible catalysts for L3Harris. Northrop Grumman benefits from the disclosed $1.6 billion award and, separately, from its proposed Edge motor role. The $1.6 billion should not be assigned entirely to PAC-3 or Edge because the call describes a broader component scope.
Cross-portfolio implication: Holding Lockheed Martin alongside its propulsion suppliers increases exposure to the same underlying production schedules and funding decisions. It provides different positions in the value chain, not independent demand diversification.
JATM CREATES A LONGER-TERM CHALLENGE TO RTX’S AIR-TO-AIR FRANCHISE, BUT NOT AN IMMEDIATE AMRAAM DOWNTURN (READ-THROUGH 4)
Affected companies: RTX (RTX: United States) and Lockheed Martin (LMT: United States). Directional impact: positive for Lockheed Martin’s air-to-air missile opportunity and negative for RTX’s ability to capture all incremental high-end air-to-air demand. Magnitude: potentially meaningful for the relevant weapon franchises over time, but limited near-term impact on RTX’s consolidated earnings.
Call evidence: Management announced a framework to accelerate Joint Advanced Tactical Missile production ahead of a multiyear contract and identified Australia as the first international customer. The program is AIM-260 JATM. The draft’s phonetic “JDAM” rendering should not be confused with Boeing’s Joint Direct Attack Munition.
The competitive mechanism is the expansion of a Lockheed Martin weapon into missions and aircraft that also support RTX’s AMRAAM franchise. The associated JATM announcement identifies compatibility with the F-22 and F-35 and describes greater range and effectiveness than existing air-to-air weapons. Australia’s participation extends the opportunity beyond a purely domestic procurement program and demonstrates a potential route into allied inventories.
The negative read-through for RTX is therefore a constraint on future high-end share and terminal franchise assumptions, not evidence that current AMRAAM orders are being canceled. That distinction is reinforced by RTX’s September 28 announcement of an AMRAAM contract valued at up to $20.7 billion over 5 years with 2 option years, supporting annual production of at least 1,900 missiles. AMRAAM also serves a broad installed base and NASAMS ground-based air defense, which limits the relevance of a simple air-to-air replacement thesis.
Near-term, the evidence supports continued growth in both programs. Longer-term, JATM gives customers another source of advanced air-combat capability and can redirect part of the incremental procurement budget toward Lockheed Martin. The opportunity does not justify a near-term RTX earnings downgrade solely on this call, but it argues against capitalizing AMRAAM growth as if future procurement were uncontested.
The relevant catalysts are congressional approval and execution of the JATM multiyear procurement, production milestones, aircraft integration, and additional export commitments. The Australia announcement is particularly relevant to portfolios exposed to allied missile replenishment because it shows that export demand can support a new competitive architecture rather than only extend incumbent products.
COMBAT AIRCRAFT AND AEROSTRUCTURES
THE F-35 FRAMEWORK SUPPORTS SUPPLIER DURABILITY MORE THAN AN IMMEDIATE PRODUCTION-RATE UPGRADE (READ-THROUGH 5)
Affected companies: BAE Systems (BA.: United Kingdom) and Northrop Grumman (NOC: United States). Directional impact: positive. Magnitude: meaningful for their F-35 franchises and moderate at the parent-company level, conditional on formal authority, appropriations, and contract completion. The principal benefit is longer-duration production stability rather than a new near-term volume surge.
Call evidence: Management described a framework for 850 U.S. aircraft over 10 years, supplemented by international demand to sustain total production of 156 aircraft annually. Taiclet specifically identified Northrop Grumman’s center-fuselage work and BAE Systems’ rear-airframe participation, while stating that approximately 60% or more of F-35 content comes from suppliers.
The mechanism operates through recurring production content and more predictable manufacturing economics. Stable requirements can support workforce retention, automation, purchasing commitments, and lower disruption costs. Management also proposed pooling parts demand across production and sustainment, which could expand purchasing scale and improve utilization of common manufacturing processes.
However, 156 aircraft annually is a sustained production objective, not an announced increase above that rate. The framework should therefore reduce uncertainty around future activity more clearly than it raises immediate unit-volume estimates. It also remains conditional: the formal announcement requires multiyear authority and appropriations before final terms, prices, and schedules can be completed.
The international component is important. Production of 156 aircraft annually over 10 years would total 1,560 aircraft. Subtracting the stated 850 U.S. aircraft leaves approximately 710 aircraft dependent on international demand if that total pace is maintained. That is framework arithmetic, not a separate disclosed order book. It highlights the importance of allied procurement, export approvals, and affordability to supplier utilization.
Near-term trading catalysts are formal authorization, appropriations, and supplier order placement. The longer-duration fundamental benefit is a more stable revenue and production base, potentially accompanied by better returns on productivity investment. No numerical supplier margin uplift can be inferred from the call.
Geographically, BAE Systems provides exposure to a U.S.-led procurement cycle through a U.K.-listed parent. That exposure should not be confused with a pure European domestic-defense spending thesis.
LOT 20 EXPOSES A GAP BETWEEN STRATEGIC COMMITMENT AND CURRENT CONTRACT FUNDING (READ-THROUGH 6)
Affected companies: Lockheed Martin (LMT: United States), with indirect timing exposure for BAE Systems (BA.: United Kingdom) and Northrop Grumman (NOC: United States). Directional impact: negative near-term funding and cash-conversion risk. Magnitude: potentially material for Lockheed Martin’s program cash flow; unquantified and more conditional for suppliers.
Source evidence: The earnings notice and formal release state that Lot 20 costs began exceeding existing contractual authorization and funding during Q3. The release warns that without additional authorization and funding, future operating results, cash flows, and financial condition will be negatively affected. On the call, the CFO said a 2026 Lot 20 agreement would provide upside to effectively all metrics and was not included in guidance.
The mechanism is a mismatch between work being performed and the authorization available to support its economics and collection. At the prime contractor, prolonged delays can increase cash committed to contract activity and create uncertainty around recognition, reimbursement, and final negotiated terms. Strategic customer support for the F-35 does not by itself resolve that mismatch.
The supplier read-through is narrower. Delayed lot finalization can affect purchase-order releases, production scheduling, and the timing of cash receipts. However, the call does not establish that BAE Systems or Northrop Grumman is currently unpaid, working without authorization, or absorbing Lockheed Martin’s funding exposure. Supplier liabilities and payment protections depend on their own agreements.
The critical distinction is that Lot 20 is not the same agreement as the proposed framework covering Lots 21-30. A favorable long-term framework announcement cannot be used as evidence that the nearer-term funding issue has been resolved.
This is an actionable near-term catalyst rather than a distant theoretical risk. Additional authorization or a completed Lot 20 agreement would reduce the identified uncertainty and could accelerate financial recognition. Continued delay would increase the importance of contract assets, cash collections, and supplier scheduling disclosures. The call supports monitoring a specific funding gap, not a broad conclusion that F-35 demand is weakening.
AUTONOMOUS COMBAT AIRCRAFT
VECTIS INCREASES COMPETITIVE PRESSURE ON UNAWARDED AUTONOMOUS-AIRCRAFT OPPORTUNITIES (READ-THROUGH 7)
Affected companies: Kratos Defense & Security Solutions (KTOS: United States), Airbus (AIR: Netherlands), and Lockheed Martin (LMT: United States). Directional impact: negative for the competitive exclusivity of Kratos and Airbus’s future autonomous-aircraft opportunities; positive for Lockheed Martin’s ability to participate in that market. Magnitude: modest near-term financial impact, with potentially meaningful effects on longer-term opportunity capture. No loss of an awarded Kratos or Airbus contract is established.
Call evidence: Lockheed Martin increased its internally funded Vectis commitment to 5 aircraft, scheduled flight demonstrations for 2027, and described a design intended to be releasable to qualifying allies. Management also emphasized integration with the F-22 and F-35 and positioning for future collaborative combat aircraft requirements.
The mechanism is the arrival of another funded competitor with established fighter relationships, mission-integration capabilities, and a large allied installed base. Lockheed Martin can potentially bundle an autonomous aircraft with existing crewed-platform modernization, sensors, data links, and mission systems. That can influence customer procurement preferences even if the competing aircraft have different price and performance characteristics.
Kratos and Airbus have a directly relevant offering rather than merely thematic exposure. Their U740-Valkyrie completed its first European flight on October 12, with a stated objective of combat-ready capability by 2029 for German and other European requirements. Their sovereign European mission system and Eurofighter integration provide differentiation, while the existing flight-tested airframe gives them a maturity advantage over a Vectis program awaiting its announced demonstrations.
Consequently, the high-conviction negative is increased competition for future opportunities, not a forecast of lower current Kratos revenue. Vectis does not establish technical superiority, price superiority, export approval, or victory in a specific European procurement. It does weaken an investment assumption that emerging autonomous-aircraft demand will be captured predominantly by smaller entrants without an effective response from established primes.
The principal catalysts are Vectis’s 2027 demonstrations and subsequent requirement and procurement decisions. Near-term share-price sensitivity could exceed earnings sensitivity because unawarded opportunity expectations can change before revenue forecasts do.
INDUSTRIAL MANUFACTURING AND AUTOMOTIVE ADJACENCIES
COMMERCIAL MANUFACTURING IS ENTERING DEFENSE THROUGH IDENTIFIED COMPONENTS, NOT A GENERAL AUTOMOTIVE REVALUATION (READ-THROUGH 8)
Affected companies: General Motors (GM: United States), Hadrian (PRIVATE: United States), and Lockheed Martin (LMT: United States). Directional impact: positive for GM Defense’s addressable manufacturing opportunities and Hadrian’s defense deployment; positive for Lockheed Martin’s capacity flexibility. Magnitude: strategically meaningful for the participating businesses, but likely limited for GM’s consolidated earnings on currently disclosed information.
Call evidence: Management said GM Defense delivered initial PAC-3 components in less than 1 month and described a Hadrian automated manufacturing cell at Grand Prairie under a manufacturing-as-a-service arrangement. GM’s own announcement specifies PAC-3 MSE housing components delivered 22 days after contract signing. Lockheed Martin also described more than $8 billion of investment through 2030 across facilities, suppliers, and workforce development.
The transmission mechanism is the transfer of existing commercial casting, precision-fabrication, and production-management capabilities into defense components that can be industrialized relatively quickly. For GM Defense, successful qualification and delivery create a reference position for follow-on work. For Hadrian, an actual deployment within a major prime’s production system provides stronger commercial validation than an unawarded demonstration.
For Lockheed Martin, the benefit is potentially faster scaling with less reliance on internally owned equipment and a narrow traditional supplier base. That can reduce the capital and scheduling burden associated with expansion. Manufacturing-as-a-service does not eliminate cost, however; part of the investment economics moves into supplier pricing and service payments.
The competitive implication should remain component-specific. GM’s delivery of missile housings does not demonstrate an ability to replace qualified seekers, propulsion systems, or other technically distinct subsystems. Similarly, the disclosed Hadrian relationship does not identify a lost contract at a particular listed machining supplier. The evidence supports capacity diversification, not an indiscriminate negative conclusion for all incumbent aerospace-component companies.
The near-term catalyst is repeat production work with disclosed scale and economics. The longer-duration opportunity is broader use of commercial manufacturing capacity to support defense output. The current evidence is insufficient to alter GM’s consolidated earnings materially or support a broad automotive, robotics, cloud, or semiconductor-sector earnings upgrade.
Report record
- Sector
- Industrials
- Fiscal period end
- September 27, 2026
- Report date
- October 22, 2026
- Analysis
- 7252 words
- Read-throughs
- 2943 words
- Content fingerprint (PDF)
be6d35552b7a- Content fingerprint (analysis)
99459ae35d99- Content fingerprint (read-throughs)
ef354d4c3649
Prepared from the company's earnings release and earnings call transcript. Figures as reported by the company. For information only. Not investment advice.
More from Lockheed Martin Corporation
No other reports yet.
All Lockheed Martin Corporation reports
More in Industrials
Earnings Expansion Durable, but the Beat Was Not Unequivocal
Improved visibility into 2027 rather than a substantial upgrade to 2026 earnings
Follow @AtlasPeakRes on X for new earnings reports as they publish.