
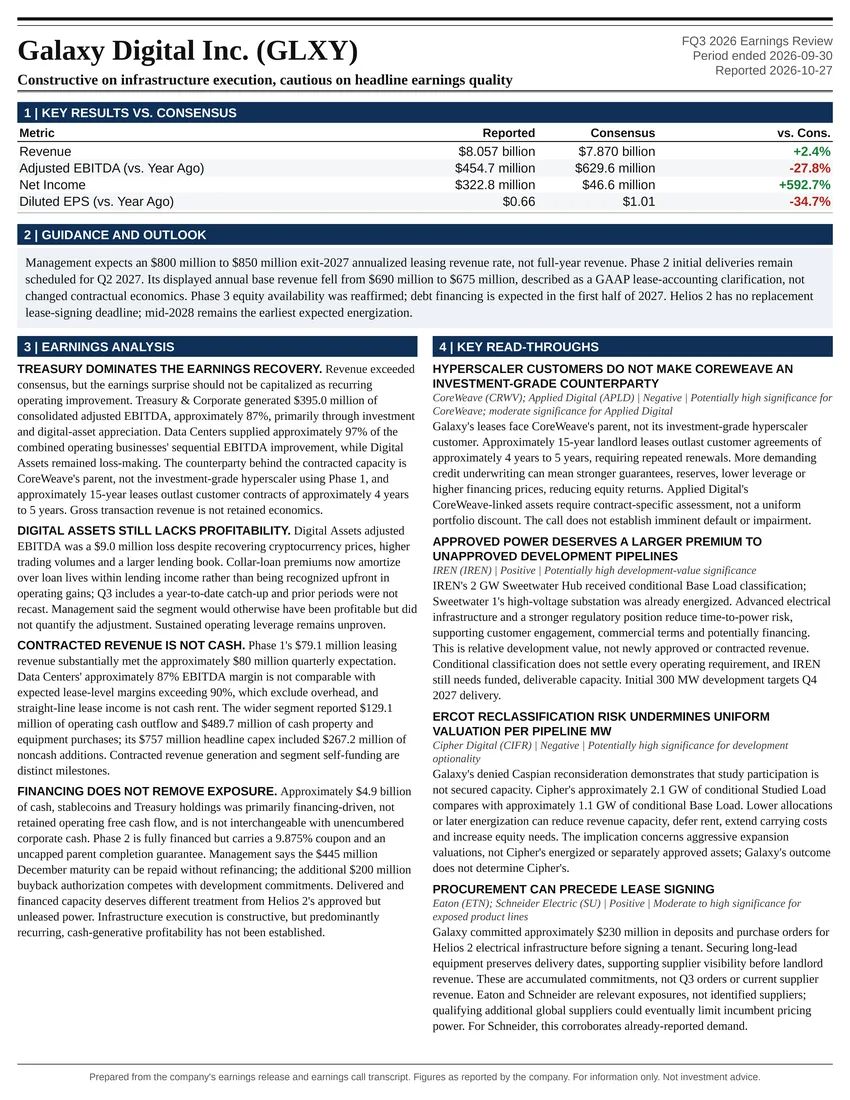
Constructive on infrastructure execution, cautious on headline earnings quality
Earnings Reports
Mastercard FQ3 2026 Earnings Report
Mastercard (MA) FQ3 2026 earnings: Strong execution with identifiable timing and financial-support effects. Full earnings analysis, key read-throughs, and the one-page exhibit from Atlas Peak Research.
Mastercard (MA)
Sector: Financials · FQ3 2026 · Period end September 30, 2026 · Reported October 29, 2026
Mastercard’s Q3 2026 results support a constructive assessment of the franchise, but not an unqualified acceleration thesis or an automatic increase in exposure.
Download the one-page report (PDF)
View one-page exhibit
Download analysis (.md)
Download read-throughs (.md)
Post to X
One-Page Exhibit
Earnings Analysis
EXECUTIVE CALL SUMMARY: Mastercard Incorporated (10/29/26)
Mastercard’s Q3 2026 results support a constructive assessment of the franchise, but not an unqualified acceleration thesis or an automatic increase in exposure. Revenue growth strengthened, operating leverage remained positive, services contributed disproportionately to incremental revenue, and higher-yielding cross-border activity remained resilient. However, part of the revenue outperformance was explicitly pulled forward from Q4, the full-year underlying revenue outlook was maintained rather than raised, pricing comparisons become less favorable, and customer incentives are expected to consume a larger proportion of gross assessments next quarter. The appropriate earnings interpretation is strong execution with identifiable timing and financial-support effects, rather than evidence that the sustainable growth rate has increased to the headline EPS growth rate.
Net revenue reached $9.807 billion, increasing 14% both as reported and on a currency-neutral basis. Adjusted operating income increased approximately 15% to $5.935 billion, adjusted operating margin expanded approximately 70 basis points to 60.5%, and adjusted EPS increased 21% to $5.31. The underlying transaction environment was less accelerated than the financial headlines: gross dollar volume increased 7%, switched transactions increased 9%, and cross-border volume increased 11%. Payment network revenue increased 11%, while value-added services and solutions increased 19%. Pricing, mix, services penetration, and project timing explain why revenue growth exceeded the principal operating drivers.
The most important qualification came from CFO Ling Hai: “There is also a little bit timing of services projects and also the signing of deals moving from Q4 to Q3.” He added that this represented “a revenue benefit for Q3” with “a similar offset in Q4.” That disclosure materially limits the annual earnings implications of the quarterly outperformance. Management maintained the full-year organic, currency-neutral revenue outlook at the high end of the low-double-digit range and explicitly stated that expectations remained consistent with the stronger positioning within that range communicated in July.
The strongest fundamental development was the ability to produce faster payment network revenue growth despite slower aggregate volume growth. The principal near-term risk is that this favorable monetization is partially offset by pricing anniversaries, higher incentives, and revenue timing reversals. The principal financial-quality qualification is weaker cash conversion. Derived standalone Q3 operating cash flow declined approximately 10% despite rising earnings, and year-to-date shareholder distributions exceeded operating cash flow after capital investment.
Strategically, the call strengthened the case that Mastercard can remain economically relevant as commerce shifts toward AI agents and stablecoins. The OpenAI relationship, Shopify integration, security products, and the launch of the Mastercard Global Money Platform demonstrate concrete commercialization activity. Nevertheless, management acknowledged that agentic transaction volumes are not yet material, and BVNK contributed minimally to current revenue growth. These initiatives improve the durability of the franchise more clearly than they improve near-term earnings estimates.
FINANCIAL PERFORMANCE AND HISTORICAL CONTEXT
Revenue increased by $1.205 billion from $8.602 billion in Q3 2025. Payment network revenue rose from $5.179 billion to $5.749 billion, contributing $570 million of incremental revenue. Value-added services and solutions rose from $3.423 billion to $4.058 billion, contributing $635 million. Services therefore generated approximately 52.7% of the consolidated revenue increase despite representing approximately 41.4% of current revenue. Their revenue share increased from approximately 39.8% a year earlier.
This distinction matters economically. Mastercard is increasingly monetizing its network through security, authentication, customer acquisition, analytics, and related services rather than relying exclusively on transaction growth. However, these are revenue categories, not independently reported operating segments with separately disclosed profitability. The quarterly filing continues to identify 1 reportable operating segment, Payment Solutions. A higher services mix cannot therefore be assumed to produce a particular margin benefit without category-level cost information.
Compared with Q2 2026, currency-neutral revenue growth accelerated from 12% to 14%, payment network growth improved from 8% to 11%, and services growth increased from 18% to 19%. By contrast, worldwide gross dollar volume growth slowed from 8% to 7%, cross-border growth slowed from 12% to 11%, and switched transaction growth remained 9%. The improvement was consequently concentrated in monetization, mix, and timing rather than a broad acceleration in underlying payment activity.
The comparison with Q3 2025 requires acquisition normalization. Currency-neutral revenue growth was 15% in that period, including approximately 1 percentage point from acquisitions. The current 14% growth rate, with minimal acquisition and disposition effects, is therefore broadly consistent with the approximately 14% organic rate implied by the prior-year disclosure. Similarly, services grew 22% currency-neutral in Q3 2025, including approximately 3 percentage points from acquisitions. Current services growth of 19%, with minimal inorganic effects, is broadly comparable to the prior-year underlying rate rather than a clear structural deceleration.
Operating drivers have nevertheless moderated over that period. Q3 2025 gross dollar volume, cross-border volume, and switched transactions increased 9%, 15%, and 10%, respectively, versus 7%, 11%, and 9% currently. Sustained revenue growth against this backdrop demonstrates resilience, but also places greater analytical weight on pricing, revenue mix, and services attachment.
Adjusted operating expenses increased from $3.459 billion to $3.872 billion. The approximately $791 million increase in adjusted operating income on $1.205 billion of incremental revenue implies an incremental adjusted operating margin of approximately 65.6%. This is evidence of operating leverage, although accelerated project revenue can temporarily improve incremental margins depending on when associated costs are recognized.
The apparent sequential acceleration in expense growth is less concerning after adjusting for changes in business perimeter. Q2 currency-neutral adjusted expense growth of 10% included an approximately 1 percentage point benefit from dispositions. Q3 growth of 12% included an approximately 1 percentage point increase from acquisitions and dispositions. Both periods therefore imply underlying expense growth of roughly 11%, subject to rounding. The consolidated growth-rate increase does not establish a comparable acceleration in organic spending.
Adjusted operating margin declined from 61.1% in Q2 to 60.5% in Q3 while remaining above the prior-year quarter. That sequential movement should not be interpreted independently of seasonality, revenue mix, acquisition effects, and project timing. The more relevant conclusion is that Mastercard continued expanding margins year over year, but did not translate the entire revenue acceleration into additional sequential profitability.
EPS QUALITY, TAXES, AND REPURCHASES
The 21% adjusted EPS growth rate materially exceeds underlying operating profit growth. The earnings release reports adjusted net income growth of approximately 17% as reported and 18% currency-neutral. Lower taxes and a reduced share count supplied the additional support.
The adjusted effective tax rate declined from 21.4% to 20.1%. Using the detailed adjusted operating income, other expense, and net income figures, the lower effective tax rate contributed approximately $0.09 to current EPS relative to applying the prior-year rate to current pretax earnings. The release attributes the lower rate to higher net discrete tax benefits and other tax effects. These benefits remained within adjusted earnings and should not be mistaken for operating improvement.
Diluted weighted-average shares declined from approximately 905 million to 876 million, a reduction of approximately 3.2%. That denominator reduction mechanically increased EPS relative to an unchanged share base. Management separately identified a $0.16 EPS contribution from repurchases. On an analytical basis holding both the prior-year effective tax rate and prior-year diluted share count constant, current adjusted EPS would have been approximately $5.05, representing approximately 15.5% growth. This is not an alternative reported result, but it illustrates that the core earnings improvement was closer to operating profit growth than to the headline 21%.
The year-over-year EPS comparison also benefits from the fact that Q3 2025 carried a substantial tax increase relative to Q3 2024. The adjusted tax rate rose from 16.3% to 21.4% in that earlier comparison, partly reflecting the implementation of global minimum tax rules. Current EPS acceleration therefore reflects both business performance and a more favorable tax comparison. It does not indicate a comparable acceleration in underlying revenue or transaction growth.
Adjusted other expense was $115 million, compared with the approximately $125 million anticipated on the Q2 call. The $10 million improvement represents roughly $0.01 of EPS at the current tax rate and share count. The 20.1% adjusted tax rate was also near the favorable end of the previously communicated 20% to 21% quarterly range. Relative to the midpoint of that range, the tax outcome supplied approximately $0.03 of EPS. These are comparisons with management’s disclosed assumptions, not a quantified bridge against analyst consensus.
GAAP EPS was $5.28, close to adjusted EPS of $5.31. The small net difference should not obscure offsetting adjustments. The reconciliation excludes $74 million of litigation provisions, while the equity-investment adjustment also carries a tax effect. A narrow GAAP-to-adjusted EPS gap does not establish that litigation and other excluded items were economically immaterial.
PAYMENT NETWORK ECONOMICS: PRICING, MIX, AND INCENTIVES
The payment network produced stronger revenue realization than its headline operating drivers. Domestic assessments increased 13% currency-neutral against 7% worldwide gross dollar volume growth. Cross-border assessments increased 16% against 11% cross-border volume growth. Transaction processing assessments increased 14% against 9% switched transaction growth.
These comparisons indicate favorable monetization, but the growth-rate gaps are not pure pricing contributions. Domestic assessments are not driven exclusively by the worldwide GDV denominator, while cross-border and processing assessments are affected by transaction composition, geography, ancillary activity, and other factors. Management attributed the gaps primarily to pricing and mix, with lower foreign-exchange-volatility revenue partially offsetting processing growth.
The relative pattern changed meaningfully from Q2. Domestic assessment growth increased from 10% to 13% even as worldwide GDV growth slowed. Processing assessment growth increased from 12% to 14% with unchanged transaction growth. Cross-border assessment growth, however, slowed from 20% to 16%, while the corresponding volume growth rate declined only from 12% to 11%. The revenue acceleration was therefore not uniformly supported by increasing cross-border monetization.
The CFO’s pricing response was strategically positive but quantitatively limited: “We price for value.” He identified tokenization, additional functionality, new use cases, and deeper customer penetration as opportunities. He also explicitly cautioned that Mastercard expects “some lapping of the pricing as we head into Q4.” The call did not disclose a sustainable annual pricing contribution or establish that new pricing will fully replace expiring comparison benefits.
Customer incentives are the critical offset. Payment network rebates and incentives increased 18% to $6.369 billion, exceeding the approximately 14.7% growth in gross network assessments. Gross assessments, reconstructed as net payment network revenue plus incentives, increased from $10.568 billion to $12.118 billion. Incentives consequently increased from approximately 51.0% to 52.6% of gross assessments, an increase of approximately 156 basis points year over year.
Sequentially, the ratio was much more stable. Q2 payment network revenue of $5.451 billion and incentives of $5.997 billion imply an incentive ratio of approximately 52.4%. Q3’s approximately 52.6% ratio was only modestly higher. This reconciles the analyst’s characterization of a relatively stable quarterly incentive ratio with the substantial year-over-year increase.
Management’s statement that incentives support attractive volume, cross-border flows, and services attachment is economically reasonable, but does not independently establish attractive contract returns. The relevant test is the lifetime contribution after incentives, implementation costs, servicing requirements, and renewal economics. Higher network volume purchased with larger incentives can still create value, but volume growth alone does not prove it.
The CFO stated that Mastercard measures performance through “driving net revenue growth and expanding overall net revenue yield.” That is the correct analytical focus. Gross pricing gains should not be evaluated separately from the customer economics required to retain and win business.
At current quarterly gross assessments, an additional 1 percentage point of incentives as a share of assessments would reduce net revenue by approximately $121 million if all other factors were held constant. That equals approximately 1.2% of consolidated quarterly revenue and approximately $0.11 of EPS before any associated expense response. This is a sensitivity, not a forecast: the incremental volume and services revenue associated with those incentives could offset some or all of the effect.
The near-term direction was explicit: “For Q4, we would expect our rebates and incentives as a percent of gross assessments to be higher than Q3.” Combined with pricing anniversaries and the reversal of accelerated revenue, this makes net revenue realization more important than gross assessment growth in the next earnings release.
CONSUMER SPENDING, GEOGRAPHIC MIX, AND CROSS-BORDER QUALITY
The spending environment remained resilient, but the available data support stability more clearly than acceleration. U.S. GDV increased 6%, with credit growth of 10% and debit growth of 1%. These were unchanged from Q2. The weak debit headline continued to reflect the Capital One migration rather than a clean measure of underlying debit spending.
The migration began near the end of Q3 2025 and continued through Q1 2026. Its anniversary should therefore improve reported growth progressively from late Q3 2026 through Q1 2027. This is a comparison benefit, not a recovery of the migrated business. The distinction is important because improved growth rates will not automatically represent incremental market-share gains.
Management attributed the early October improvement in U.S. switched volume to the migration anniversary, commercial wins, and higher gasoline spending. U.S. switched volume growth increased from 6% in Q2 to 7% in Q3 and 9% through October 21. Worldwide switched volume growth moved from 9% in Q3 to 10% in early October, while switched transactions remained at 9%.
Higher fuel prices can increase nominal payment values without improving real consumption. They can also crowd out discretionary spending. The current benefit to payment volumes should therefore not be interpreted as unambiguously favorable evidence about household purchasing power.
Outside the U.S., GDV growth slowed from 9% in Q2 to 8% in Q3. Credit growth slowed more noticeably, from 9% to 6%, while debit growth remained 10%. This is a relevant qualification to the broadly positive macro commentary. The call did not provide sufficient geographic or customer detail to determine whether the international credit slowdown reflected macro conditions, portfolio composition, or specific markets.
Cross-border quality was better than the aggregate deceleration suggests. Total cross-border growth slowed from 12% in Q2 to 11% in Q3 and 10% through October 21. However, lower-yielding intra-Europe growth declined from 12% to 10% and then 8%, while other cross-border growth increased from 11% in Q2 to 12% in Q3 and remained 12% in early October.
This distinction supports management’s argument that the revenue implications are less negative than the aggregate volume trend. Higher-yielding activity remained resilient while a lower-yielding category slowed. The call’s reference to a European customs fee, retail promotional timing, and tougher cryptocurrency purchase comparisons explains the concentration of weakness, but does not quantify the contribution of each factor.
Cross-border card-not-present growth excluding travel declined from 20% in Q2 to 15% in Q3 and 14% in early October. Cross-border travel growth improved from 6% in Q2 to 8% in Q3, before easing to 7% in early October. This is not evidence of a broad travel collapse. The early October moderation was attributed to holiday timing, while the Middle East remained an ongoing source of disruption.
The claim that the European weakness is entirely nonstructural should nevertheless be treated cautiously. Promotional timing and comparison effects are temporary by definition, but a customs fee changes the economics of affected transactions for as long as it remains in force. Its year-over-year growth effect can eventually anniversary even if the lost or redirected transaction activity does not return.
The most important macro monitoring variable is therefore higher-yielding cross-border activity rather than total cross-border growth alone. A slowdown spreading from intra-Europe into other cross-border categories would be materially more concerning than the mix pattern disclosed this quarter.
SERVICES: DURABLE PENETRATION, BUT NOT IMMUNE TO PAYMENT VOLUMES
Services remained the most important source of incremental revenue growth. The 19% increase was broad across customer acquisition and engagement, business and market insights, security, digital services, and authentication. Management stated that BVNK’s contribution was minimal, supporting the interpretation that current growth was principally generated by existing capabilities rather than acquisition accounting.
Ling Hai emphasized that “60% of our services are network linked.” This supports the integrated business model: transaction growth creates opportunities to sell services, while services improve authorization, security, loyalty, and customer economics, encouraging additional network activity. It also limits the diversification argument. A substantial portion of services remains economically connected to payments activity and cannot be treated as an independent hedge against a payment-volume slowdown.
The remaining approximately 40% should not automatically be characterized as countercyclical or recurring software revenue. The call did not disclose services retention, recurring revenue, backlog, contract duration, or category-level margins. Consulting, marketing, and implementation projects can be timing-sensitive, as demonstrated by the explicit acceleration of projects into Q3.
The reported average incremental spending benefit of 8 percentage points across Mastercard marketing campaigns is a customer-outcome claim, not a forecast for Mastercard revenue. No matched cohort methodology, campaign duration, customer acquisition cost, or profitability analysis was provided. It supports the value proposition, but cannot be translated directly into a financial return on services spending.
Security appears structurally attractive because digital commerce, AI-enabled fraud, identity compromise, and automated attacks increase the value of authentication and threat intelligence. The reported expansion with Standard Bank, Monzo, and Starling provides evidence of continued commercial demand. The newly launched digital risk protection product’s nearly 800 enterprise customers also indicates distribution traction.
However, customer count alone does not establish the scale of revenue. Pricing, paid deployment status, annual contract value, retention, and possible bundling were not disclosed. The strategic significance is the ability to distribute cybersecurity products through an established network of financial institutions and merchants. The immediate earnings significance remains unquantified.
Recorded Future and RiskRecon broaden the addressable buying centers beyond payment processing, potentially increasing wallet share with security teams and governments. The competitive requirements also change: enterprise cybersecurity demands specialized research, product development, service reliability, and renewal execution. Mastercard’s network relationships create an advantage, but not an automatic entitlement to software-like margins or valuation.
NETWORK EXPANSION, ISSUER WINS, AND COMMERCIAL PAYMENTS
Mastercard reported more than 200 million acceptance locations and 20% year-over-year growth in merchant acceptance during H1 2026. Contactless penetration reached 81% of in-person switched purchase transactions, compared with 76% a year earlier and 80% in Q2. Total Mastercard and Maestro cards increased 5% to approximately 3.807 billion.
These metrics demonstrate continued network expansion, but acceptance locations and cards are not substitutes for active spending. Newly enabled merchants may generate limited initial volume, and card growth does not disclose activation or spending intensity. The much faster acceptance growth relative to GDV growth is therefore not inconsistent, but it underscores the need to distinguish infrastructure reach from monetization.
The affluent strategy is particularly relevant to revenue quality. Management reported 100 new affluent credit and debit programs during the year, more than 25 World Legend launches, and affluent spending growing 2 times faster than overall credit. Higher engagement and cross-border activity can improve revenue per credential. The trade-off is increased exposure to premium travel, affluent discretionary spending, and the economics required to win high-value issuer portfolios.
Essential Debit addresses a different opportunity. The 15 programs signed across 7 markets provide partners with tools to address up to 70 million unbanked adults. That figure represents a potential addressable population, not issued cards or active customers. Monetization will depend on onboarding, funding, repeat usage, acceptance, and local payment economics.
The Nordic and German renewals primarily protect and deepen existing relationships. They should not all be counted as incremental share gains. Their strategic value is retention in competitive markets, services attachment, and access to remaining cash-to-digital opportunities. The same distinction applies to broader issuer announcements: the financial value depends on spend, incentives, exclusivity, implementation timing, and the portion of business that is genuinely new.
Pinnacle Financial Partners is a more tangible forward catalyst because the combined bank’s entire issuing portfolio is scheduled to begin moving to Mastercard in 2027. The portfolio spans consumer credit, debit, small business, and commercial cards. No volume or revenue contribution was disclosed, so a precise earnings estimate is not supported. Nevertheless, the identified migration date makes it more actionable for forward modeling than undated market-potential claims.
The HDFC Bank small-business agreement is expected to add 3 million cards and includes services. Its strategic importance exceeds the headline card count because commercial credentials can support higher spending and additional workflow-related services. Relative to Mastercard’s approximately 3.8 billion total cards, however, 3 million represents less than 0.1%. The contribution depends on spending intensity and economics, not merely issuance.
China remains a long-duration opportunity. Programs with the country’s top 15 issuers, the Bank of Communications Hilton co-brand, and the Bank of China debit relationship broaden distribution and access to domestic and outbound spending. These relationships do not establish immediate penetration of the issuers’ entire customer bases. Local payment preferences, incumbent networks, regulatory requirements, and incentives remain material constraints.
Commercial payments offer a more differentiated growth pathway because Mastercard can address workflow costs as well as payment execution. Embedding virtual cards in Tungsten Automation and Coupa can reduce implementation friction and place Mastercard within accounts-payable processes before the payment decision occurs.
The travel-related wins signed during the quarter are expected to produce more than $20 billion of incremental network spending over the lives of the agreements. This is neither annual spending nor Mastercard revenue. Contract duration, ramp schedules, cross-border mix, retained yield, and customer incentives were not provided. Treating the full figure as a near-term revenue catalyst would materially overstate the disclosed opportunity.
The Coupa example also requires caution. Management cited more than $100 million of supplier payments and an estimated $35 million of avoided onboarding costs for a retailer. The baseline, measurement period, methodology, and relationship between payment value and avoided costs were not disclosed. The example supports workflow simplification, but does not establish a generalizable 35% customer savings rate or a measurable Mastercard revenue opportunity.
AGENTIC COMMERCE: DEFENDING PAYMENT ECONOMICS AND OPENING NEW USE CASES
The agentic commerce discussion was strategically important because it addressed the risk that AI intermediaries could separate consumers from their chosen credentials, redirect payment flows, and weaken network control over authentication and transaction economics.
Management described 4 requirements: trust in the payment, trust in the agent, trust across the ecosystem, and broad acceptance. Agent Pay, network tokenization, verifiable intent, AgenticTrust Intelligence, and Agent Connect address different elements of that architecture. The commercial proposition is not simply payment execution. It is preserving authorization, identity, consumer intent, rewards, dispute rights, and merchant acceptance across an increasingly automated purchasing process.
The clearest strategic position concerned processor-inserted virtual card numbers. Michael Miebach stated that a fully tokenized transaction through Agent Pay or an equivalent is the intended long-term model. Regarding interim virtual-card approaches, he said: “That’s not a long-term solution that we will support.”
This is not a contradiction of Mastercard’s promotion of virtual cards in commercial payments. A business intentionally choosing a virtual card for controlled supplier spending is different from a processor inserting a substitute credential between a consumer’s selected card and the merchant. The objection concerns preservation of the original payment relationship and its associated protections, controls, and rewards.
The position has both offensive and defensive implications. Successful end-to-end tokenization could increase demand for authentication, risk assessment, and token services. It could also protect Mastercard against intermediaries seeking to redirect transactions or capture additional economics. Conversely, requiring a preferred architecture could slow adoption where merchants, processors, and agents are not ready. The call did not disclose transition deadlines, enforcement mechanisms, or the economics of alternative implementations.
The Shopify relationship is significant because Shop Pay can extend an established consumer credential into multiple agent environments. The OpenAI agreement is strategically broader, covering payments, joint services growth, and AI transformation. Neither announcement disclosed exclusivity, revenue commitments, transaction volumes, minimum economics, or a material current contribution.
Merchant readiness remains a gating factor. Discoverability, product-catalog access, token acceptance, processor support, and communication of agent authorization must work together. Miebach’s response to the merchant-readiness question acknowledged the importance of processors, software vendors, and payment service providers, but did not resolve the technical question of when existing checkout endpoints are sufficient versus when additional integrations are required.
Agentic commerce also does not automatically create incremental spending. A substantial portion may replace existing search and checkout journeys without changing the number or value of purchases. Incremental economics would arise from higher conversion, new use cases, additional authenticated transactions, services attachment, or genuinely new machine-to-machine payments. Software interactions, agent queries, and API calls should not be counted as payment transactions without a separate monetization bridge.
Management’s most important near-term qualifier was that “the numbers are not yet significant in the grand scheme.” Accordingly, the initiatives warrant strategic option value and potentially a lower perceived disintermediation risk, but not a material near-term earnings contribution based on the disclosures available.
BVNK AND STABLECOINS: INTEROPERABILITY RATHER THAN RESERVE-INCOME EXPOSURE
BVNK closed on August 3, 2026, consistent with the Q2 expectation of a Q3 completion. The quarterly filing records approximately $1.4 billion of cash consideration, with potential additional contingent consideration of up to $300 million. The acquisition therefore moved from a pending strategic initiative to an operating capability during the quarter.
The Mastercard Global Money Platform, announced on October 15, combines fiat and stablecoin accounts, conversion, stablecoin-linked cards, and local-bank payouts. Mastercard Move provides access to more than 17 billion endpoints. The official launch announcement identifies Nuvei and Marqeta among the early integration partners, clarifying names that are garbled in the supplied transcript.
The strategic logic is credible. Banks and fintechs can support customer demand for stablecoins without building separate account, conversion, compliance, and payout infrastructure. Mastercard can monetize connectivity and services even where the underlying asset is not a traditional bank deposit or where movement does not occur entirely over conventional card rails.
The opportunity is nevertheless broader than, and economically different from, issuing a stablecoin. No material stablecoin reserve-income entitlement was disclosed. Transaction flow, average balances, reserve yields, and retained distribution economics are distinct variables. Higher stablecoin transfers should not be translated directly into interest income or earnings for Mastercard.
The acquisition also provides licenses, compliance capabilities, and specialized personnel. Those assets can shorten implementation timelines and reduce development risk. They introduce additional integration, sanctions, anti-money-laundering, custody, technology, and counterparty considerations. The statement that integration is progressing well after approximately 2 months is encouraging, but is not a complete assessment of the operating risk.
The purchase accounting highlights the dependence on future execution. Preliminary goodwill was approximately $1.271 billion, and identified intangible assets were approximately $363 million. The investment case relies heavily on distribution synergies, product development, and future adoption rather than current standalone earnings. Management explicitly stated that BVNK’s revenue contribution was minimal.
The more balanced interpretation is that BVNK gives Mastercard a credible way to participate in payment architectures that might otherwise bypass parts of its existing network. Whether those activities produce incremental profit, protect existing revenue, or substitute lower-yielding flows for higher-yielding card transactions remains unresolved.
GUIDANCE: MAINTAINED ANNUAL EXPECTATIONS WITH A MORE COMPLEX Q4 BRIDGE
At the July 30 Q2 call, Mastercard guided Q3 organic, currency-neutral revenue growth to the high end of the low-double-digit range, with minimal inorganic effects and an approximately 0.5 percentage point foreign-exchange headwind. Actual Q3 currency-neutral revenue growth was 14%, and management characterized revenue as above expectations.
The original guidance was qualitative, not a numerical point forecast. An exact revenue beat against management’s internal plan cannot therefore be calculated. The same limitation applies to separating the contribution from stronger underlying business performance versus accelerated services projects and payment network deals.
The full-year comparison is clearer. In July, Mastercard maintained its stated revenue-growth range but increased its expected position within that range because of stronger H1 performance. In October, it retained that higher positioning. Ling Hai stated: “Our full year remains in line with these expectations.” The Q3 call was therefore not a further underlying full-year revenue upgrade.
Full-year organic, currency-neutral operating expense growth remained in the low-double-digit range. Expected foreign exchange effects were also maintained at approximately a 1 percentage point revenue benefit and a 0.5 to 1 percentage point expense-growth headwind. Minimal full-year inorganic effects remained the assumption.
The presentation’s GAAP expense outlook changed despite the unchanged underlying framework. Expected GAAP expense growth moved from the high end of high single digits to the low end of low double digits, while the adjusted organic, currency-neutral outlook remained unchanged. This distinction reflects the treatment of excluded items and comparisons, including litigation provisions, rather than an explicitly announced increase in the core operating expense growth target.
For Q4, organic, currency-neutral revenue growth is expected at the high end of the low-double-digit range. Foreign exchange is expected to reduce revenue growth by approximately 1 percentage point, with minimal inorganic revenue effects. Management did not provide an absolute revenue or EPS target.
Q4 organic, currency-neutral expense growth is also expected at the high end of the low-double-digit range. The written reconciliation indicates that acquisitions and dispositions add approximately 1 percentage point to expense growth, while currency reduces it by approximately 0.5 percentage point. The transcript’s reference to an acquisition “drag” should therefore be understood as an earnings headwind from additional expenses, not a reduction in the expense growth rate.
Matching qualitative revenue and expense growth bands imply less obvious organic operating leverage in Q4 than the positive spread achieved in Q3. Exact margin direction cannot be determined from broad bands alone, but continued expansion at Q3’s pace should not be assumed.
The Q4 revenue bridge contains competing forces. Favorable factors include the progressive anniversary of the Capital One migration, recent commercial wins, continued services demand, and resilient higher-yielding cross-border activity. Offsetting factors include Q3 revenue pull-forward, pricing anniversaries, a higher incentive ratio, weaker intra-Europe comparisons, and the currency headwind.
Adjusted other expense is expected to remain approximately $115 million in Q4. The adjusted tax rate is expected at 20% to 21% for both Q4 and the full year. The Q4 tax range is unchanged from July. The 19.8% year-to-date adjusted tax rate lies slightly below the full-year range, so the broad annual guidance should not be treated as a precise EPS point estimate.
No 2027 guidance was provided. The CFO explicitly deferred that discussion to the next quarterly release. The correction during the final questions also makes clear that the earlier statement about not providing guidance referred specifically to rebates and incentives, not a withdrawal of the company’s 2026 outlook.
CASH CONVERSION AND CAPITAL ALLOCATION
The cash-flow statements provide an important counterweight to the strong adjusted earnings narrative. Year-to-date operating cash flow declined from $12.646 billion to $11.859 billion, approximately 6.2%, while GAAP net income increased approximately 18%. Operating cash conversion relative to GAAP net income declined from approximately 116% to 92%.
The standalone quarter was also weaker. Subtracting H1 cash flows from the 9-month statements produces Q3 operating cash flow of $5.087 billion, compared with $5.663 billion a year earlier, a decline of approximately 10.2%. Current-quarter operating cash flow still exceeded GAAP net income, but the approximately 110% conversion rate was below the prior-year approximately 144%.
An analytical free-cash-flow measure defined as operating cash flow less property and equipment purchases and capitalized software was $4.759 billion in Q3, compared with $5.304 billion a year earlier, a decline of approximately 10.3%. On the same definition, year-to-date free cash flow declined from $11.721 billion to $10.718 billion, approximately 8.6%. These are derived cash measures, not additional management guidance.
The filing attributes the year-to-date operating cash-flow decline primarily to higher customer incentive payments, litigation settlements, and customer settlement timing, which more than offset higher earnings after noncash adjustments. This does not establish weaker customer collections or an earnings-recognition problem. It does establish that accounting earnings growth did not translate into contemporaneous cash growth.
Customer incentive assets increased from approximately $10.401 billion at year-end to $11.624 billion at September 30, combining current and noncurrent balances. Amortization of customer incentives increased from $1.526 billion to $2.030 billion year to date. These balances reinforce the importance of cash timing and contract economics when evaluating network wins.
Shareholder distributions were substantial. Year-to-date treasury stock purchases of $11.893 billion and dividends of $2.311 billion totaled $14.204 billion, exceeding the analytical free-cash-flow measure by approximately $3.486 billion before acquisitions. The $1.372 billion net acquisition cash outflow increased the funding requirement further.
Debt carrying value rose from approximately $19.0 billion at year-end to $23.9 billion, while cash and cash equivalents declined from approximately $10.566 billion to $10.147 billion. Debt less that cash balance increased from approximately $8.434 billion to $13.791 billion. Restricted customer balances are excluded from this net-debt calculation.
Liquidity remained substantial, including an undrawn $8 billion committed revolving facility, and these figures do not establish financial distress. However, repurchases were not funded solely by current-period free cash flow. Interest expense increased from $186 million to $250 million in Q3, illustrating the financing cost associated with a larger debt base.
Capital returns remain supportive of EPS, but their economic attractiveness depends on purchase valuation and the opportunity cost of alternative uses. The quarter’s results do not establish that a 21% EPS growth rate can be sustained through a similar combination of repurchases, tax benefits, and debt-funded distributions.
COMPETITION, REGULATION, AND DISCLOSURE RISKS
Management’s account-to-account payment discussion was constructive but selective. UPI and Brazil’s domestic payment infrastructure can expand financial inclusion and create customers who later adopt debit, credit, or commercial products. They also compete directly for payment flows and can constrain card economics.
The suggestion that additional UPI pricing could improve the competitive balance remains conditional. Management referred to reports and potential changes rather than a confirmed, quantified fee regime. The HDFC win is specific commercial evidence. A broad improvement in Mastercard’s economics from hypothetical UPI fee changes is not.
The most important competitive distinction is between payment convenience and the complete payment proposition. Credit availability, rewards, fraud protections, disputes, cross-border acceptance, and reconciliation can support card economics even when an alternative transfer rail is cheaper. Whether those advantages justify the total merchant cost varies by transaction and market.
Litigation remains economically relevant even when excluded from adjusted results. The Q3 filing describes new October U.K. merchant claims seeking approximately £1.5 billion and £0.4 billion from Mastercard. These are claims, not court awards, recognized liabilities, or expected-loss estimates. Their relevance is continued legal uncertainty around payment economics, not a basis for mechanically deducting the claimed amounts from valuation.
The filing also identifies a February 2027 appeal hearing relating to U.K. merchant litigation. More broadly, stronger pricing and new token-related monetization can attract customer and regulatory scrutiny. Mastercard’s pricing opportunity should therefore be evaluated alongside merchant acceptance costs, customer bargaining power, routing alternatives, and litigation exposure.
The supplied transcript contains several garbled names, incorrect year references, and apparent speaker-attribution errors. Written financial disclosures resolve the principal quantitative ambiguities. The remaining qualitative claims should be attributed to management without assuming that every reported product benchmark or customer outcome has been independently validated.
INVESTMENT IMPLICATIONS, SCENARIOS, AND RISK PARAMETERS
The central investment implication is that Mastercard continues to convert a mature global network into a broader monetization platform. Services penetration, premium credentials, commercial payments, security, and tokenization provide credible mechanisms for revenue growth to exceed aggregate payment growth. Confidence in that strategic inference is medium to high. Confidence in the magnitude and timing of incremental AI and stablecoin earnings is low because the required financial disclosures are absent.
The call supports maintaining a fundamentally constructive position, but not increasing exposure solely because Q3 EPS grew 21%. The more relevant sustainable earnings indicators are approximately 15% operating profit growth, maintained full-year revenue expectations, the trajectory of net network yield, and cash conversion. A purchase decision still requires a verified forward earnings base and valuation; no absolute price target is supportable from the call alone.
An illustrative 2027 base case, assigned a 60% probability, assumes healthy but not accelerating consumer spending, stable higher-yielding cross-border activity, services growth in the high teens, and partial offset of pricing anniversaries through new products and penetration. Under those assumptions, organic currency-neutral revenue growth of approximately 12% to 14% and adjusted EPS growth of approximately 14% to 17% would be plausible. This is an analytical scenario, not management guidance.
An illustrative bull case, assigned a 20% probability, assumes commercial migrations and premium portfolios contribute more strongly, services sustain approximately 20% growth or better, pricing offsets incentive pressure, and cross-border mix remains favorable. Revenue growth of approximately 15% to 16% and adjusted EPS growth of approximately 18% to 21% would then be plausible. Material AI revenue is not required for this scenario, although successful commercialization could support valuation.
An illustrative bear case, assigned a 20% probability, assumes broader cross-border slowing, weaker international credit spending, persistent incentive pressure, reduced pricing support, and expense commitments that adjust more slowly than revenue. Revenue growth of approximately 7% to 9% and adjusted EPS growth of approximately 5% to 9% would be plausible before any severe legal or operational event. Persistent cash-conversion weakness would increase the risk of lower repurchase support.
These scenarios have medium-to-low forecasting confidence because 2027 guidance, contract economics, and a verified valuation base are unavailable. They demonstrate earnings sensitivity rather than establish price targets. For illustration, 16% EPS growth combined with 10% multiple compression produces only approximately 4% share-price appreciation before dividends. An 8% EPS increase combined with 20% multiple compression produces approximately 14% downside. Strong business performance does not eliminate valuation risk.
For a diversified portfolio, the exposure remains principally a combination of global nominal consumption, cross-border commerce, quality-growth valuation, and payment-network economics. Services add diversification but do not remove the common payment-volume exposure, given management’s 60% network-linked characterization. Concurrent holdings in other payment networks, premium travel businesses, fintech platforms, or high-multiple compounders can increase common-factor concentration.
A conditional new-position framework would favor an initial allocation no larger than approximately 1.5% to 2.0% of NAV until valuation and Q4 revenue quality are verified. A 10% adverse price move should trigger a full review rather than an automatic thesis conclusion, with a maximum position-loss budget of approximately 20 to 25 basis points of NAV. These are illustrative portfolio controls, not recommendations to transact at an unspecified market price.
Fundamental reduction or exit triggers would include a slowdown spreading into higher-yielding cross-border activity, services growth falling materially below the mid-teens without a credible timing explanation, incentives persistently outgrowing gross assessments without compensating net revenue, or continued cash-conversion deterioration as debt-funded distributions remain elevated. A demonstrated loss of network economics in agentic commerce would be a strategic rather than merely cyclical warning.
The immediate catalysts are Q4 holiday spending, the reversal of accelerated Q3 projects, pricing anniversaries, and the expected increase in incentives. The next earnings release is the principal estimate catalyst because it will establish formal 2027 guidance and reveal whether the improving U.S. comparison translates into stronger net revenue. Pinnacle’s migration beginning in 2027 and the progression of Global Money Platform integrations provide additional operating milestones. The February 2027 U.K. appeal is a separate legal catalyst.
The decisive forward test is whether Mastercard can sustain double-digit net revenue growth, moderate operating leverage, and stronger cash conversion as pricing comparisons normalize and incentives increase. Q3 provides strong evidence of franchise execution. It provides less evidence that the long-term growth algorithm has changed, and insufficient evidence that near-term AI or stablecoin monetization should materially raise earnings forecasts.
SOURCE BASIS
The analysis draws on the complete supplied Q3 2026 earnings-call transcript; Mastercard’s October 29, 2026 earnings release and presentation; the September 30, 2026 quarterly filing; the July 30, 2026 earnings call and June 30 quarterly filing; the October 30, 2025 earnings release; and Mastercard’s October 15, 2026 Global Money Platform announcement. Financial calculations are derived from those disclosures. No verified contemporaneous consensus dataset or valuation snapshot is used, and no numerical consensus surprise or absolute price target is asserted.
COMPANY EMPLOYEES ON THE CALL
• Michael Miebach, Chief Executive Officer. • Ling Hai, Chief Financial Officer. • Devin Corr, Head of Investor Relations.
RESEARCH ANALYSTS ON THE CALL
• Harshita Rawat, Bernstein. • Tien-Tsin Huang, JPMorgan. • Adam Frisch, Evercore ISI. • Andrew Schmidt, KeyBanc Capital Markets. • Darrin Peller, Wolfe Research. • William “Will” Nance, Goldman Sachs. • Timothy Chiodo, UBS. • Sanjay Sakhrani, KBW. • Trevor Williams, FT Partners, as identified in the transcript. • Fahed Kunwar, Rothschild & Co Redburn. • Dan Dolev, Mizuho.
Key Read-Throughs
KEY READ-THROUGHS FROM MASTERCARD’S Q3 2026 EARNINGS CALL
Mastercard’s results support selective exposure to resilient consumption, premium travel, and payment infrastructure rather than a broad consumer-sector upgrade. The most actionable signals are the emerging impact of European customs duties on low-value cross-border commerce, Shopify’s increasingly concrete role in agentic checkout, and the distinction between strong payment volumes and the economics retained after customer incentives. Stablecoins are creating opportunities for existing card infrastructure providers rather than uniformly displacing them. Higher energy prices create sharply divergent outcomes: they increase nominal transaction values for fuel-payment platforms while directly damaging airline profitability. Several peers already reported the September quarter, so their results are treated as corroborating evidence rather than future earnings catalysts. Magnitudes below describe business exposure, not predicted share-price movements. Country labels reflect principal operating identity rather than listing venue.
DIGITAL COMMERCE
EUROPEAN CUSTOMS FRICTION IS BECOMING A REAL OPERATING HEADWIND FOR LOW-VALUE IMPORT PLATFORMS (READ-THROUGH 1)
Affected company: PDD Holdings (PDD: China), through Temu. Direction: negative. Magnitude: potentially meaningful for European direct-import unit economics; consolidated earnings sensitivity remains unquantifiable because the relevant geographic revenue and contribution margins are not disclosed. Conviction is high on the adverse economic mechanism, not on a specific earnings reduction.
Mastercard attributed the slowdown in lower-yielding intra-Europe cross-border activity partly to “a new customs fee in the EU.” Cross-border card-not-present growth excluding travel declined from 20% in Q2 to 15% in Q3 and 14% through October 21. Management identified customs costs, promotional timing, and cryptocurrency comparisons as separate contributors. Consequently, the entire slowdown cannot be assigned to imported merchandise, but the customs commentary provides transaction-level evidence that the policy is affecting commercial activity rather than remaining a theoretical regulatory risk.
The EU’s approved measure imposes a €3 duty on each distinct tariff-category item contained in qualifying consignments below €150, effective July 1, 2026. It is not simply a €3 charge per parcel. For illustration, a €3 charge represents 15% of a €20 basket containing 1 applicable category; 2 categories would produce €6 of duties, or 30%, before considering who absorbs the charge. These are arithmetic sensitivities, not estimates of Temu’s actual average basket.
The transmission mechanism is unfavorable under each principal response. Passing through the cost weakens delivered-price competitiveness and conversion. Absorbing it reduces merchant or platform contribution. Shifting toward local inventory can mitigate direct-parcel exposure but requires a different fulfillment model, inventory commitments, and potentially higher operating complexity. The commercial effect can persist even after its year-over-year growth comparison anniversaries.
The near-term catalyst is the next disclosure covering a full quarter under the new regime, together with holiday pricing and fulfillment changes. The longer-duration implication is pressure on the economics of very low-value direct imports, not necessarily a collapse in European consumption. Mastercard’s data do not identify Temu-specific order losses, but they strengthen the negative directional assessment of the exposed business model. This is a cleaner conclusion than assuming all European online retailers are weakening.
SHOPIFY IS RETAINING THE TRANSACTION LAYER EVEN WHEN AI AGENTS CONTROL DISCOVERY (READ-THROUGH 2)
Affected company: Shopify (SHOP: Canada). Direction: positive. Magnitude: moderate strategic significance, with a small and currently unquantified near-term earnings contribution. Conviction is high that the disclosed integration strengthens Shopify’s distribution and preserves its role in checkout; it does not establish a material revenue acceleration.
Mastercard specifically stated that Shopify, through Shop Pay, is using Agent Pay and network tokens to preserve the consumer credential throughout agentic transactions. It also stated that Shop Pay is already available on multiple agent platforms. Shopify’s October 28 product announcement independently confirms that Shop Pay uses tokens from Mastercard, Visa, and Discover for agent purchases from merchants outside Shopify, with American Express support forthcoming.
The important implication is that losing ownership of the initial shopping interface does not necessarily mean losing the commercial transaction. Shopify can remain responsible for merchant product data, checkout, order creation, and related payment services while discovery occurs elsewhere. That reduces the risk that an AI interface displaces the entire commerce infrastructure stack.
There are 2 potential economic channels. First, preserving Shop Pay within new shopping journeys protects existing merchant-services revenue and merchant retention. Second, support for purchases beyond Shopify-hosted stores expands the possible distribution of Shop Pay. However, incremental gross profit depends on the commercial arrangement and payment route. Agent-generated orders are not automatically incremental purchases, and off-platform checkout volume should not be assigned Shopify’s existing average revenue yield without disclosure.
The near-term catalyst is Shopify’s November 3 earnings call, particularly commentary on merchant readiness, payment penetration, and whether new agent channels preserve or improve conversion. The longer-duration shift is toward Shopify acting as commerce infrastructure across multiple interfaces rather than depending exclusively on merchant-owned storefront traffic.
Mastercard’s acknowledgement that agentic volumes are “not yet significant in the grand scheme” limits immediate earnings extrapolation. The positive read-through is architectural and competitive before it is financial. The partnership is also nonexclusive, so it supports Shopify’s relevance rather than exclusive control over agentic commerce.
PAYMENT NETWORKS AND EMBEDDED FINANCE
VISA’S NETWORK ROLE IS MORE RESILIENT THAN A SIMPLE AI-DISINTERMEDIATION THESIS ASSUMES (READ-THROUGH 3)
Affected company: Visa (V: U.S.). Direction: positive. Magnitude: moderate support for long-duration franchise durability; limited incremental near-term earnings impact. Conviction is high on the continued importance of network credentials and transaction protections, but not on the eventual pricing of agentic services.
Mastercard emphasized end-to-end tokenization and explicitly accepted Agent Pay “or an equivalent” as the desired architecture. It rejected processor-inserted virtual-card bridges as a permanent solution: “That’s not a long-term solution that we will support.” The rationale was preservation of the consumer’s chosen credential, rewards, controls, and transaction protections.
The read-through to Visa is not that Mastercard’s proprietary products benefit its competitor. It is that the emerging architecture continues to rely on established network credentials, issuer authorization, token services, and dispute frameworks. Shopify’s own confirmation that its agentic checkout supports Visa tokens provides the direct commercial link. A change in the interface through which a consumer shops does not automatically remove Visa from the payment.
The immediate demand backdrop is also supportive. Mastercard’s higher-yielding other cross-border growth remained approximately 12% in Q3 and through October 21 despite weakening intra-Europe activity. This corroborates continued international commerce rather than a generalized cross-border downturn. Visa had already reported on October 27, including 14% cross-border growth excluding intra-Europe, so Mastercard’s call reinforces the forward demand assessment rather than predicting an unreported Visa quarter.
The near-term implication is reduced support for a broad payments selloff based solely on Mastercard’s slower aggregate cross-border growth. The longer-duration implication is that AI agents can increase demand for network authentication and credential-management services while leaving the underlying card relationship intact.
The boundary is important: continued network participation does not guarantee unchanged take rates, exclusive access, or incremental spending. This is a positive durability read-through, not evidence that every agent interaction becomes a paid Visa transaction.
CUSTOMER INCENTIVES ARE A SECTOR-WIDE CLAIM ON NETWORK PRICING GAINS (READ-THROUGH 4)
Affected company: Visa (V: U.S.). Direction: negative for incremental net-revenue conversion and upside expectations. Magnitude: moderate for the forward earnings bridge, although Mastercard’s figures cannot be transferred directly into a Visa earnings estimate. Conviction is high that gross pricing strength must be evaluated after customer economics.
Mastercard reported payment network rebates and incentives increasing 18%, versus 11% growth in net payment network revenue. The accompanying financial disclosures imply that incentives consumed approximately 52.6% of gross network assessments, compared with approximately 51.0% a year earlier. More importantly, management stated that the incentive ratio would be higher in Q4 than in Q3.
This is not merely an isolated Mastercard observation. Visa’s October 27 call disclosed 21% client-incentive growth and indicated that approximately 25% of payment volume is scheduled for renewal in fiscal 2027, including several large customers. Visa already incorporated a faster incentive-growth assumption into its outlook. Mastercard’s disclosure therefore corroborates the competitive environment underlying that guidance rather than establishing a new, unrecognized shortfall.
The mechanism is straightforward. Issuers and other large distribution partners control valuable payment flows. Network pricing and services monetization can expand the economic pool, but contract renewals determine how much the network retains. Higher gross assessments can coexist with more restrained net revenue growth when customers secure larger rebates or commercial support.
Mastercard’s numerous issuer renewals and portfolio wins reinforce the importance of this bargaining process. They do not establish that every deal was won at deteriorating returns. Nevertheless, a strong volume environment should not be translated mechanically into disproportionate network profit growth.
The near-term catalyst is Visa’s fiscal 2027 quarterly progression, particularly net revenue relative to gross operating drivers and renewal-related incentives. The longer-duration issue is distribution bargaining power. The negative conclusion is narrower than a bearish Visa thesis: the evidence argues against assuming that current gross pricing gains accrue entirely to shareholders, and against expecting an automatic earnings upgrade from strong transaction data.
MARQETA HAS A DIRECT PATH TO MONETIZING STABLECOIN SPENDING WITHOUT BECOMING A STABLECOIN ISSUER (READ-THROUGH 5)
Affected company: Marqeta (MQ: U.S.). Direction: positive. Magnitude: small near-term contribution, potentially moderate longer-duration product and customer diversification. Conviction is high on the commercial linkage; the scale of incremental gross profit remains unproven.
Mastercard described its first combined BVNK product as infrastructure allowing customers to “hold, convert, send and receive” fiat currencies and stablecoins, with Mastercard Move connecting those balances to traditional payout endpoints. The October 15 launch announcement identifies Marqeta as an early integration partner. Marqeta had already disclosed its BVNK relationship in its Q2 results, making this progression toward a broader operating platform rather than a newly discovered partnership.
The economic channel is card issuance and processing. Stablecoin balances can fund ordinary card purchases after conversion or through integrated funding arrangements. Marqeta can provide program management, authorization, controls, and processing while customers access existing merchant acceptance. A new funding asset can therefore generate demand for established card infrastructure rather than eliminate it.
Marqeta’s October 16 Coinbase announcement provides additional evidence that this is a multi-partner strategy: Coinbase supplies custody, conversion, and settlement capabilities, while Marqeta supplies the card infrastructure. Those relationships should not be interpreted as exclusive access to stablecoin spending.
The earnings distinction is critical. Marqeta earns program and processing economics, not automatically the reserve yield on underlying stablecoins. Its Q2 processing volume increased 32%, while net revenue and gross profit each increased 17%, demonstrating that volume and retained economics already differ materially. Stablecoin-funded volume cannot be modeled at a uniform take rate without the program mix and fee terms.
The near-term catalyst is Marqeta’s November 3 earnings call, particularly evidence of live programs, implementation timing, and gross-profit contribution. Mastercard’s statement that BVNK currently contributes minimally to its own revenue argues against treating the launch as a large immediate earnings event. The longer-duration positive is a broader customer proposition and another source of card-processing demand, not speculative reserve income.
BANKS AND PREMIUM CONSUMER FINANCE
AFFLUENT SPENDING SUPPORTS AMERICAN EXPRESS, BUT PREMIUM-CARD COMPETITION REMAINS EXPENSIVE (READ-THROUGH 6)
Affected company: American Express (AXP: U.S.). Direction: positive for spending and customer engagement, with an offsetting competitive-cost risk. Magnitude: moderate because affluent cardholders are central to the business. Conviction is high on demand resilience, not on incremental margin expansion.
Mastercard stated that affluent spending is growing 2 times faster than overall credit spending. It also reported 100 new affluent credit and debit programs during the year and more than 25 World Legend launches. The implication is stronger than a generic observation that aggregate consumer spending remains positive: the customer cohort most relevant to American Express continues to outperform.
The transmission mechanism runs through billed business, merchant discount revenue, travel engagement, and the willingness to retain premium products. American Express’s October 23 results had already reported 8% billed-business growth and strong customer retention. Mastercard’s evidence is therefore corroboration of the demand base supporting future periods, not a prediction of an upcoming Q3 beat.
The counterweight is competition. Mastercard’s UBS invitation-only product, World Legend expansion, and support for the refreshed Citi/AAdvantage premium offering demonstrate that affluent growth is attracting investment across issuers. American Express may benefit from the same customer spending strength while needing to fund additional rewards, benefits, marketing, and acquisition expenses to retain wallet share.
That distinction is already visible in American Express’s own disclosure, which identified higher variable customer-engagement costs associated with spending and its Platinum refresh. Mastercard’s affluent growth does not establish that American Express is losing share, but it weakens any assumption that premium demand automatically translates into unusually high incremental margins.
The near-term catalyst is holiday spending and the next update on billed business, acquisition, and retention. The longer-duration conclusion is favorable for the premium-card franchise but less favorable for a low-cost-growth thesis. Payment activity also does not independently establish loan credit quality, so this read-through should not be extended to lower credit-loss assumptions.
HDFC’S COMMERCIAL-CARD WIN SHOWS THAT ACCOUNT-TO-ACCOUNT SCALE DOES NOT ELIMINATE CARD OPPORTUNITIES (READ-THROUGH 7)
Affected company: HDFC Bank (HDFCBANK: India). Direction: positive. Magnitude: meaningful at the small-business card-program level, but likely modest initially for the consolidated bank. Conviction is high on strategic relevance; incremental profit and launch timing are not disclosed.
Mastercard announced a small-business agreement with HDFC Bank expected to add 3 million cards to its network, including value-added services. This is a specific commercial award in a market where UPI and domestic payment infrastructure are deeply established. It is stronger evidence than management’s general argument that financially included consumers eventually adopt additional products.
The mechanism is differentiation beyond a low-cost transfer. Commercial cards can provide revolving or short-duration credit, controlled employee spending, rewards, reconciliation, fraud protection, and access to international merchants. HDFC can deepen relationships with business customers and potentially earn card fees, interchange, and financing income where balances revolve. Those revenue opportunities must be assessed after funding costs, rewards, acquisition spending, and credit losses.
The 3 million figure requires careful interpretation. It represents cards expected to be added to Mastercard’s network, not necessarily 3 million net-new HDFC customers. Existing customers, replacement products, or network migrations could account for part of the total. Multiplying the entire figure by an assumed new-account profit would overstate the disclosed opportunity.
The near-term catalyst is implementation and subsequent disclosure of activation, spending, and portfolio growth. No sufficiently precise launch timetable was provided to justify a dated earnings inflection. The longer-duration implication is that UPI’s success and commercial-card growth can coexist because they solve overlapping but different customer needs.
The positive conclusion does not depend on speculation about future UPI fees. Mastercard referred to reports of possible pricing changes, not a confirmed economic benefit. The signed HDFC agreement is the high-conviction evidence.
TRAVEL, LOYALTY, AND ENERGY-SENSITIVE PAYMENTS
PREMIUM CO-BRAND ACQUISITION SUPPORT IS POSITIVE FOR CITI AND AMERICAN’S LOYALTY BUSINESS (READ-THROUGH 8)
Affected companies: Citigroup (C: U.S.) and American Airlines Group (AAL: U.S.). Direction: positive for the named co-brand franchise. Magnitude: modest initially at Citigroup’s consolidated level; more relevant strategically to American’s loyalty economics, but insufficient to determine overall airline profitability.
Mastercard explicitly identified customer-acquisition support for the refreshed Citi/AAdvantage Executive World Legend Mastercard. This is a direct operating relationship rather than a thematic inference from healthy travel spending. Mastercard is applying marketing and customer-engagement capabilities to a named issuer-airline product.
For Citi, successful acquisition can increase active accounts, card spending, annual fees, interchange, and potentially financing balances. For American, a larger and more engaged cardholder base can support purchases of loyalty currency and other contractual partner remuneration. The same transaction can therefore produce different accounting and cash-flow effects across the issuer, network, and airline.
The near-term profit effect is not necessarily positive immediately. Acquisition bonuses, marketing, and benefits can precede mature account revenue. American’s partner cash receipts also should not be equated directly with current-period loyalty revenue or operating profit because recognition depends on the services and rewards obligations involved.
American’s October 22 release already reported nearly 10% growth in Citi co-brand spending. Mastercard’s call corroborates continued investment behind that franchise rather than revealing a new co-brand relationship. The incremental information is the network’s explicit role in supporting the refreshed premium product.
The near-term catalyst is holiday acquisition and spending performance, followed by subsequent issuer and airline disclosures. The longer-duration opportunity is recurring customer engagement and loyalty monetization. This is a positive read-through to the co-brand business, not an unconditional positive call on American Airlines, whose fuel exposure is substantially more consequential in the current operating environment.
TRAVEL DEMAND IS MORE RESILIENT THAN THE AGGREGATE CROSS-BORDER SLOWDOWN SUGGESTS (READ-THROUGH 9)
Affected companies: Booking Holdings (BKNG: U.S.) and Expedia Group (EXPE: U.S.). Direction: positive. Magnitude: modest-to-moderate support for demand expectations, not sufficient evidence for a quantified earnings beat. Conviction is high that Mastercard’s aggregate cross-border deceleration should not be interpreted as a broad travel downturn.
Mastercard’s supporting operating data showed cross-border travel growth improving from 6% in Q2 to 8% in Q3, before moderating to 7% through October 21. Management attributed the early October easing to holiday timing. The sharper slowdown was concentrated in card-not-present activity excluding travel and lower-yielding intra-Europe flows.
The transmission mechanism is through traveler spending, lodging demand, and gross booking values. Continued cross-border travel supports the transaction base on which online travel agencies earn commissions and merchant revenue. Because the weakness identified by Mastercard was concentrated elsewhere, using its total cross-border growth rate as a bearish proxy for online travel would misclassify the signal.
The limitation is that card spending is not room-night growth. Higher airfares, hotel rates, geographic mix, and the timing of customer payments can raise spending without a comparable increase in trips. Mastercard’s figures also do not identify which bookings originated through Booking or Expedia, and the companies’ revenue-recognition timing differs from payment settlement timing.
The near-term catalysts are Booking’s November 3 results and Expedia’s November 4 results. The most relevant tests are room nights, booking growth, cancellations, and forward travel commentary, rather than an attempt to map Mastercard’s 8% travel-spending growth directly into either company’s revenue.
The longer-duration implication is continued support for international travel intermediation despite geopolitical disruption. Mastercard’s separate disclosure of more than $20 billion in incremental travel-related commercial-card spending over agreement lives supports continued digitization of travel payments, but those contracts cannot be assigned to Booking or Expedia without named counterparties.
HIGHER ENERGY PRICES BENEFIT FUEL-PAYMENT REVENUE WHILE DAMAGING AIRLINE EARNINGS (READ-THROUGH 10)
Affected companies: WEX (WEX: U.S.), positive; American Airlines Group (AAL: U.S.), negative. Magnitude: material for both companies’ current earnings drivers, with much greater direct downside sensitivity to fuel costs at American. Conviction is high because each company’s latest disclosures verify the relevant transmission mechanism.
Mastercard attributed part of the October improvement in U.S. switched volume to “higher spend on gas” and stated that geopolitical uncertainty was driving energy prices higher. This is not an unambiguously positive consumer signal. Higher fuel prices increase nominal payment values even when gallons purchased or real household consumption do not improve.
For WEX, higher fuel prices increase the dollar base on which portions of payment-processing and related revenues are earned. WEX’s October 28 release quantified a $57.3 million favorable fuel-price effect on Q3 revenue. That represented approximately 65% of its $88.3 million year-over-year revenue increase. Mobility processing transactions increased only 1.7%, versus 20.6% segment revenue growth, illustrating the distinction between price exposure and underlying transaction activity.
Mastercard’s October commentary therefore supports persistence of a known revenue tailwind into Q4. It is not a new explanation for WEX’s already-reported Q3 result. Higher fuel-related receivables can also increase funding and working-capital requirements, so the revenue benefit should not be treated as an equal cash-flow gain.
American faces the opposite mechanism: fuel is a direct operating input. Its October 22 release disclosed a $1.9 billion year-over-year increase in Q3 fuel expense. Its Q4 outlook assumed approximately $4.70 per gallon using the October 19 forward curve, implying approximately $2.8 billion of additional fuel expense versus the prior-year quarter. That price assumption is dated guidance, not a current market quotation.
This creates a particularly important cross-portfolio distinction. Strong premium spending and co-brand engagement can coexist with weak airline profitability. American’s positive loyalty read-through does not neutralize its fuel burden, while WEX can benefit from the same nominal-price environment. Online travel agencies generally lack the airline’s direct fuel-consumption exposure, although higher ticket prices can ultimately constrain trip demand.
The near-term catalysts are fuel-price developments, WEX’s Q4 payment economics, and American’s revenue recovery relative to its fuel bill. The longer-duration risk is that sustained high energy prices constrain travel capacity and discretionary budgets. WEX’s fuel benefit can reverse if prices normalize, so its current revenue growth should not be treated as entirely structural.
SOURCE BASIS AND INTERPRETATION
The conclusions are anchored in Mastercard’s October 29 call and supporting operating disclosures, cross-checked against relevant company releases, product announcements, reporting calendars, and the EU’s approved small-parcel duty rules available by October 29. Previously announced partnerships and already-reported peer results are identified as confirmation rather than fresh earnings surprises. The material does not support assigning Mastercard’s cybersecurity wins to particular listed security vendors, converting stablecoin transfer volume into reserve income, or inferring semiconductor demand from unquantified agentic-commerce activity.
Report record
- Sector
- Financials
- Industry
- Financial Services
- Fiscal period end
- September 30, 2026
- Report date
- October 29, 2026
- Analysis
- 6656 words
- Read-throughs
- 3494 words
- Content fingerprint (PDF)
6684ec083811- Content fingerprint (analysis)
8b99413b0f98- Content fingerprint (read-throughs)
773843fbc7d2
Prepared from the company's earnings release and earnings call transcript. Figures as reported by the company. For information only. Not investment advice.
More from Mastercard
No other reports yet.
More in Financials
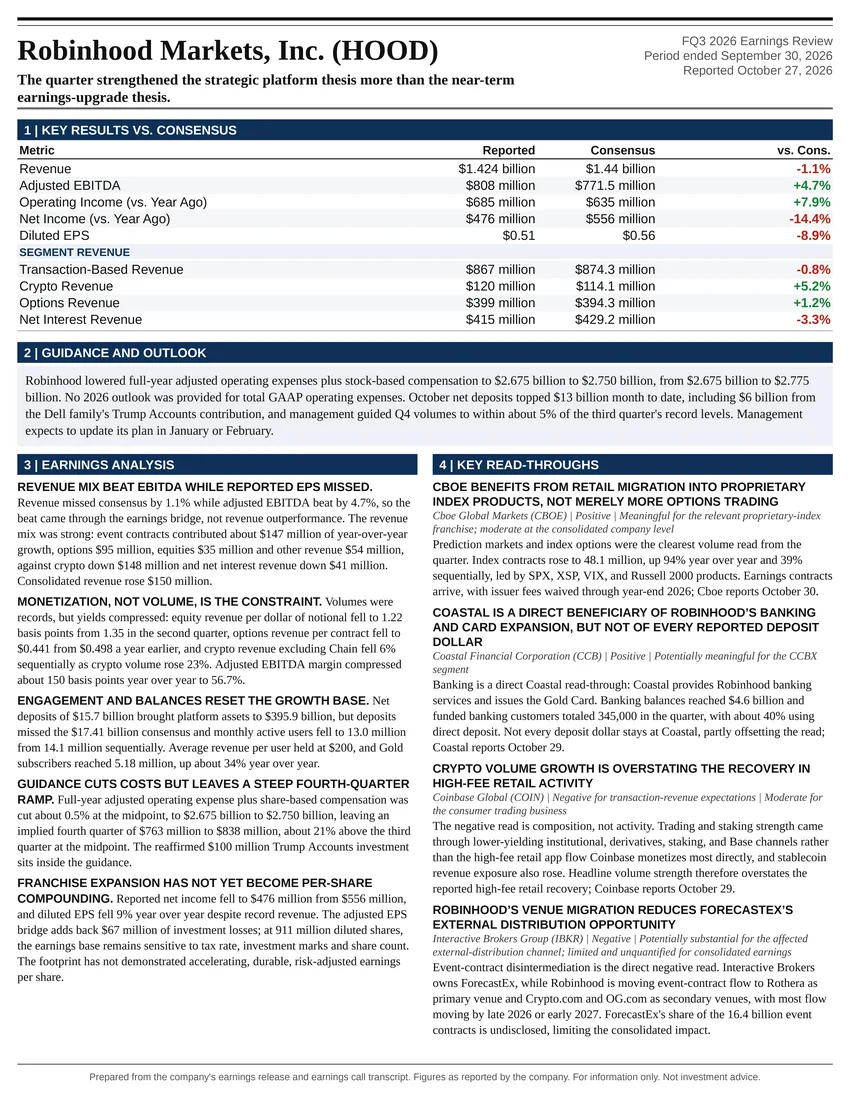
The quarter strengthened the strategic platform thesis more than the near-term earnings-upgrade thesis.
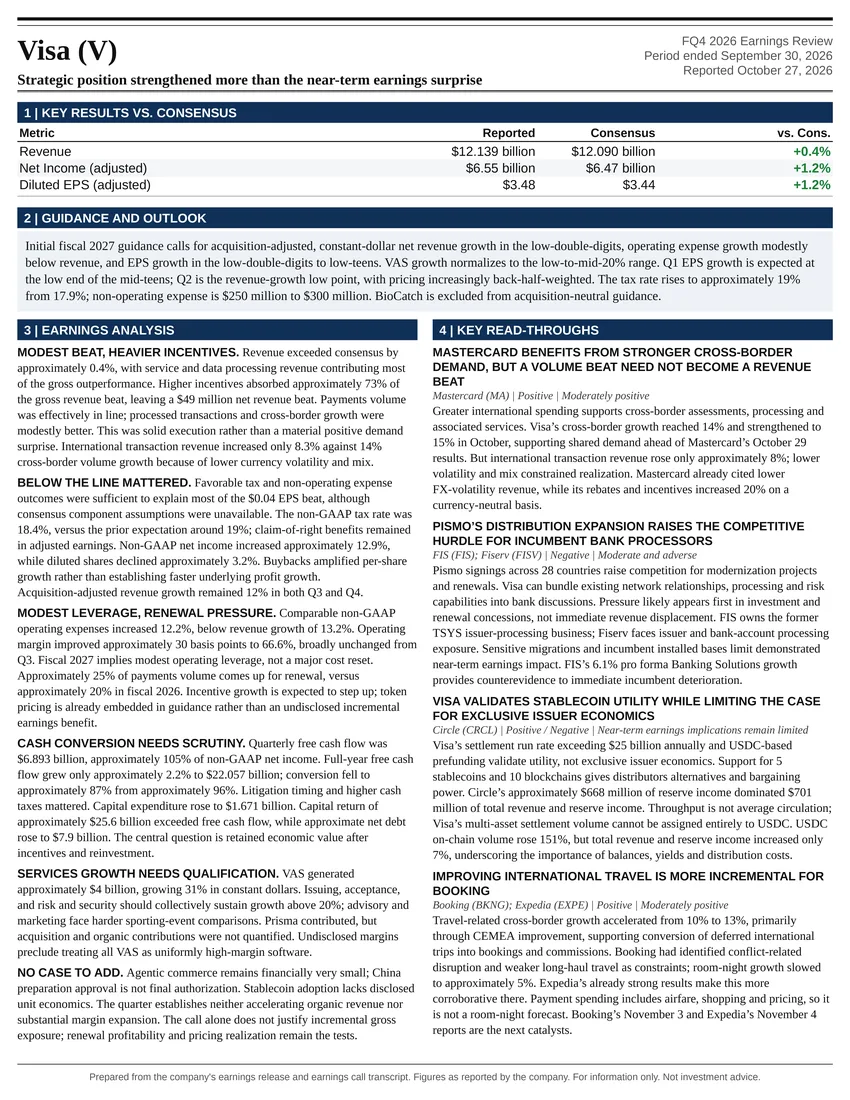
Strategic position strengthened more than the near-term earnings surprise
Follow @AtlasPeakRes on X for new earnings reports as they publish.
