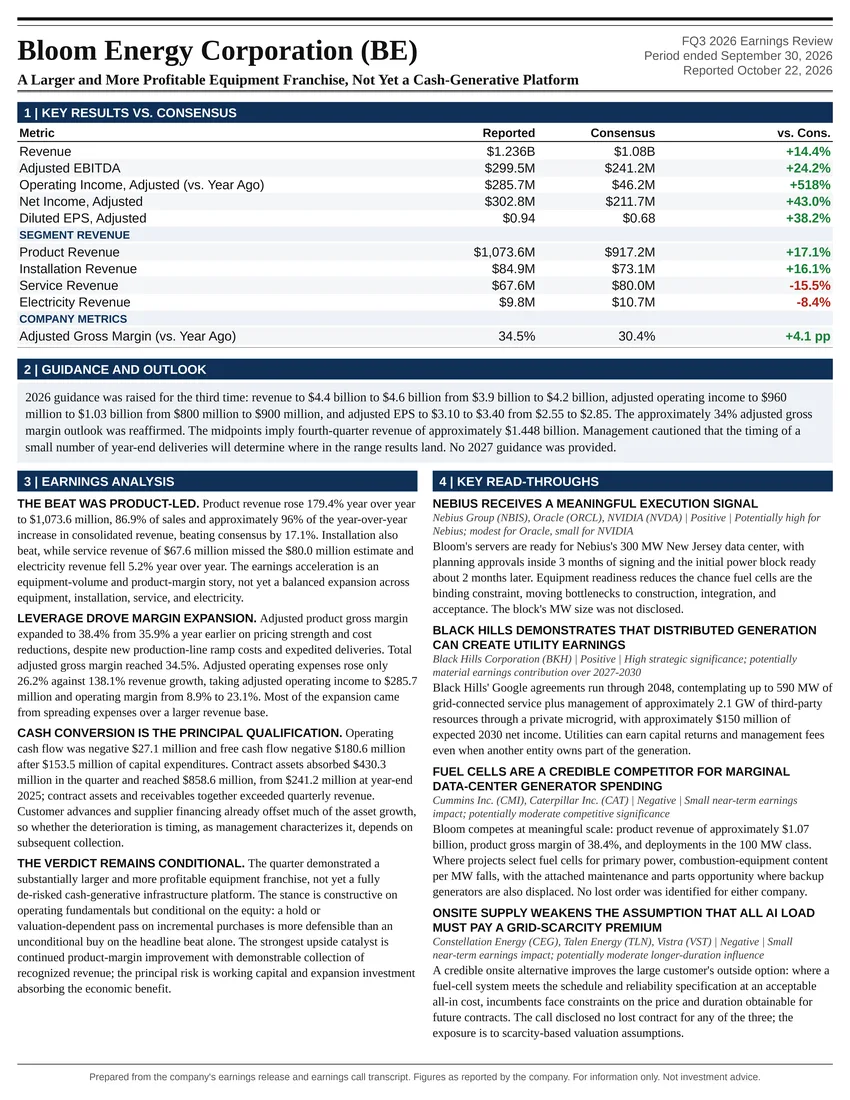
A Larger and More Profitable Equipment Franchise, Not Yet a Cash-Generative Platform
Earnings Reports
3M Co FQ3 2026 Earnings Report
3M Co (MMM) FQ3 2026 earnings: Confidence in Operating Capabilities Rose More Than Near-Term Intrinsic Value. Full earnings analysis, key read-throughs, and the one-page exhibit from Atlas Peak Research.
3M Co (MMM)
Sector: Industrials · FQ3 2026 · Period end September 30, 2026 · Reported October 20, 2026
3M’s Q3 2026 earnings call strengthened the investment case for a sustained operating turnaround, but it did not establish that the company has already transitioned into a structurally high-growth industrial technology business.
Download the one-page report (PDF)
View one-page exhibit
Download analysis (.md)
Download read-throughs (.md)
Post to X
One-Page Exhibit
Earnings Analysis
EXECUTIVE CALL SUMMARY: 3M Company (10/20/26)
3M’s Q3 2026 earnings call strengthened the investment case for a sustained operating turnaround, but it did not establish that the company has already transitioned into a structurally high-growth industrial technology business. The most consequential developments were continued productivity gains, strong Safety and Industrial performance, improved confidence in exceeding the 2027 operating-margin target, and commercial validation of Expanded Beam Optical technology through Amazon. These positives were tempered by deteriorating consumer electronics demand, continued weakness in consumer sell-in, a substantial gap between adjusted and actual cash generation, and the absence of binding purchase commitments underpinning the widely publicized $6 billion Amazon milestone.
The appropriate investment stance is to maintain a measured positive exposure to the operating turnaround rather than aggressively capitalize an unproven AI revenue stream. At the $169.81 share price cited in the accompanying Bloomberg earnings notice, which represents an event-time reference rather than a verified closing price, the shares traded at approximately 18.6 times the revised 2026 adjusted EPS midpoint. That valuation can be supported by continued margin expansion and approximately 4% organic growth, but it leaves less room for execution disappointment than the headline earnings beat and Amazon announcement might suggest.
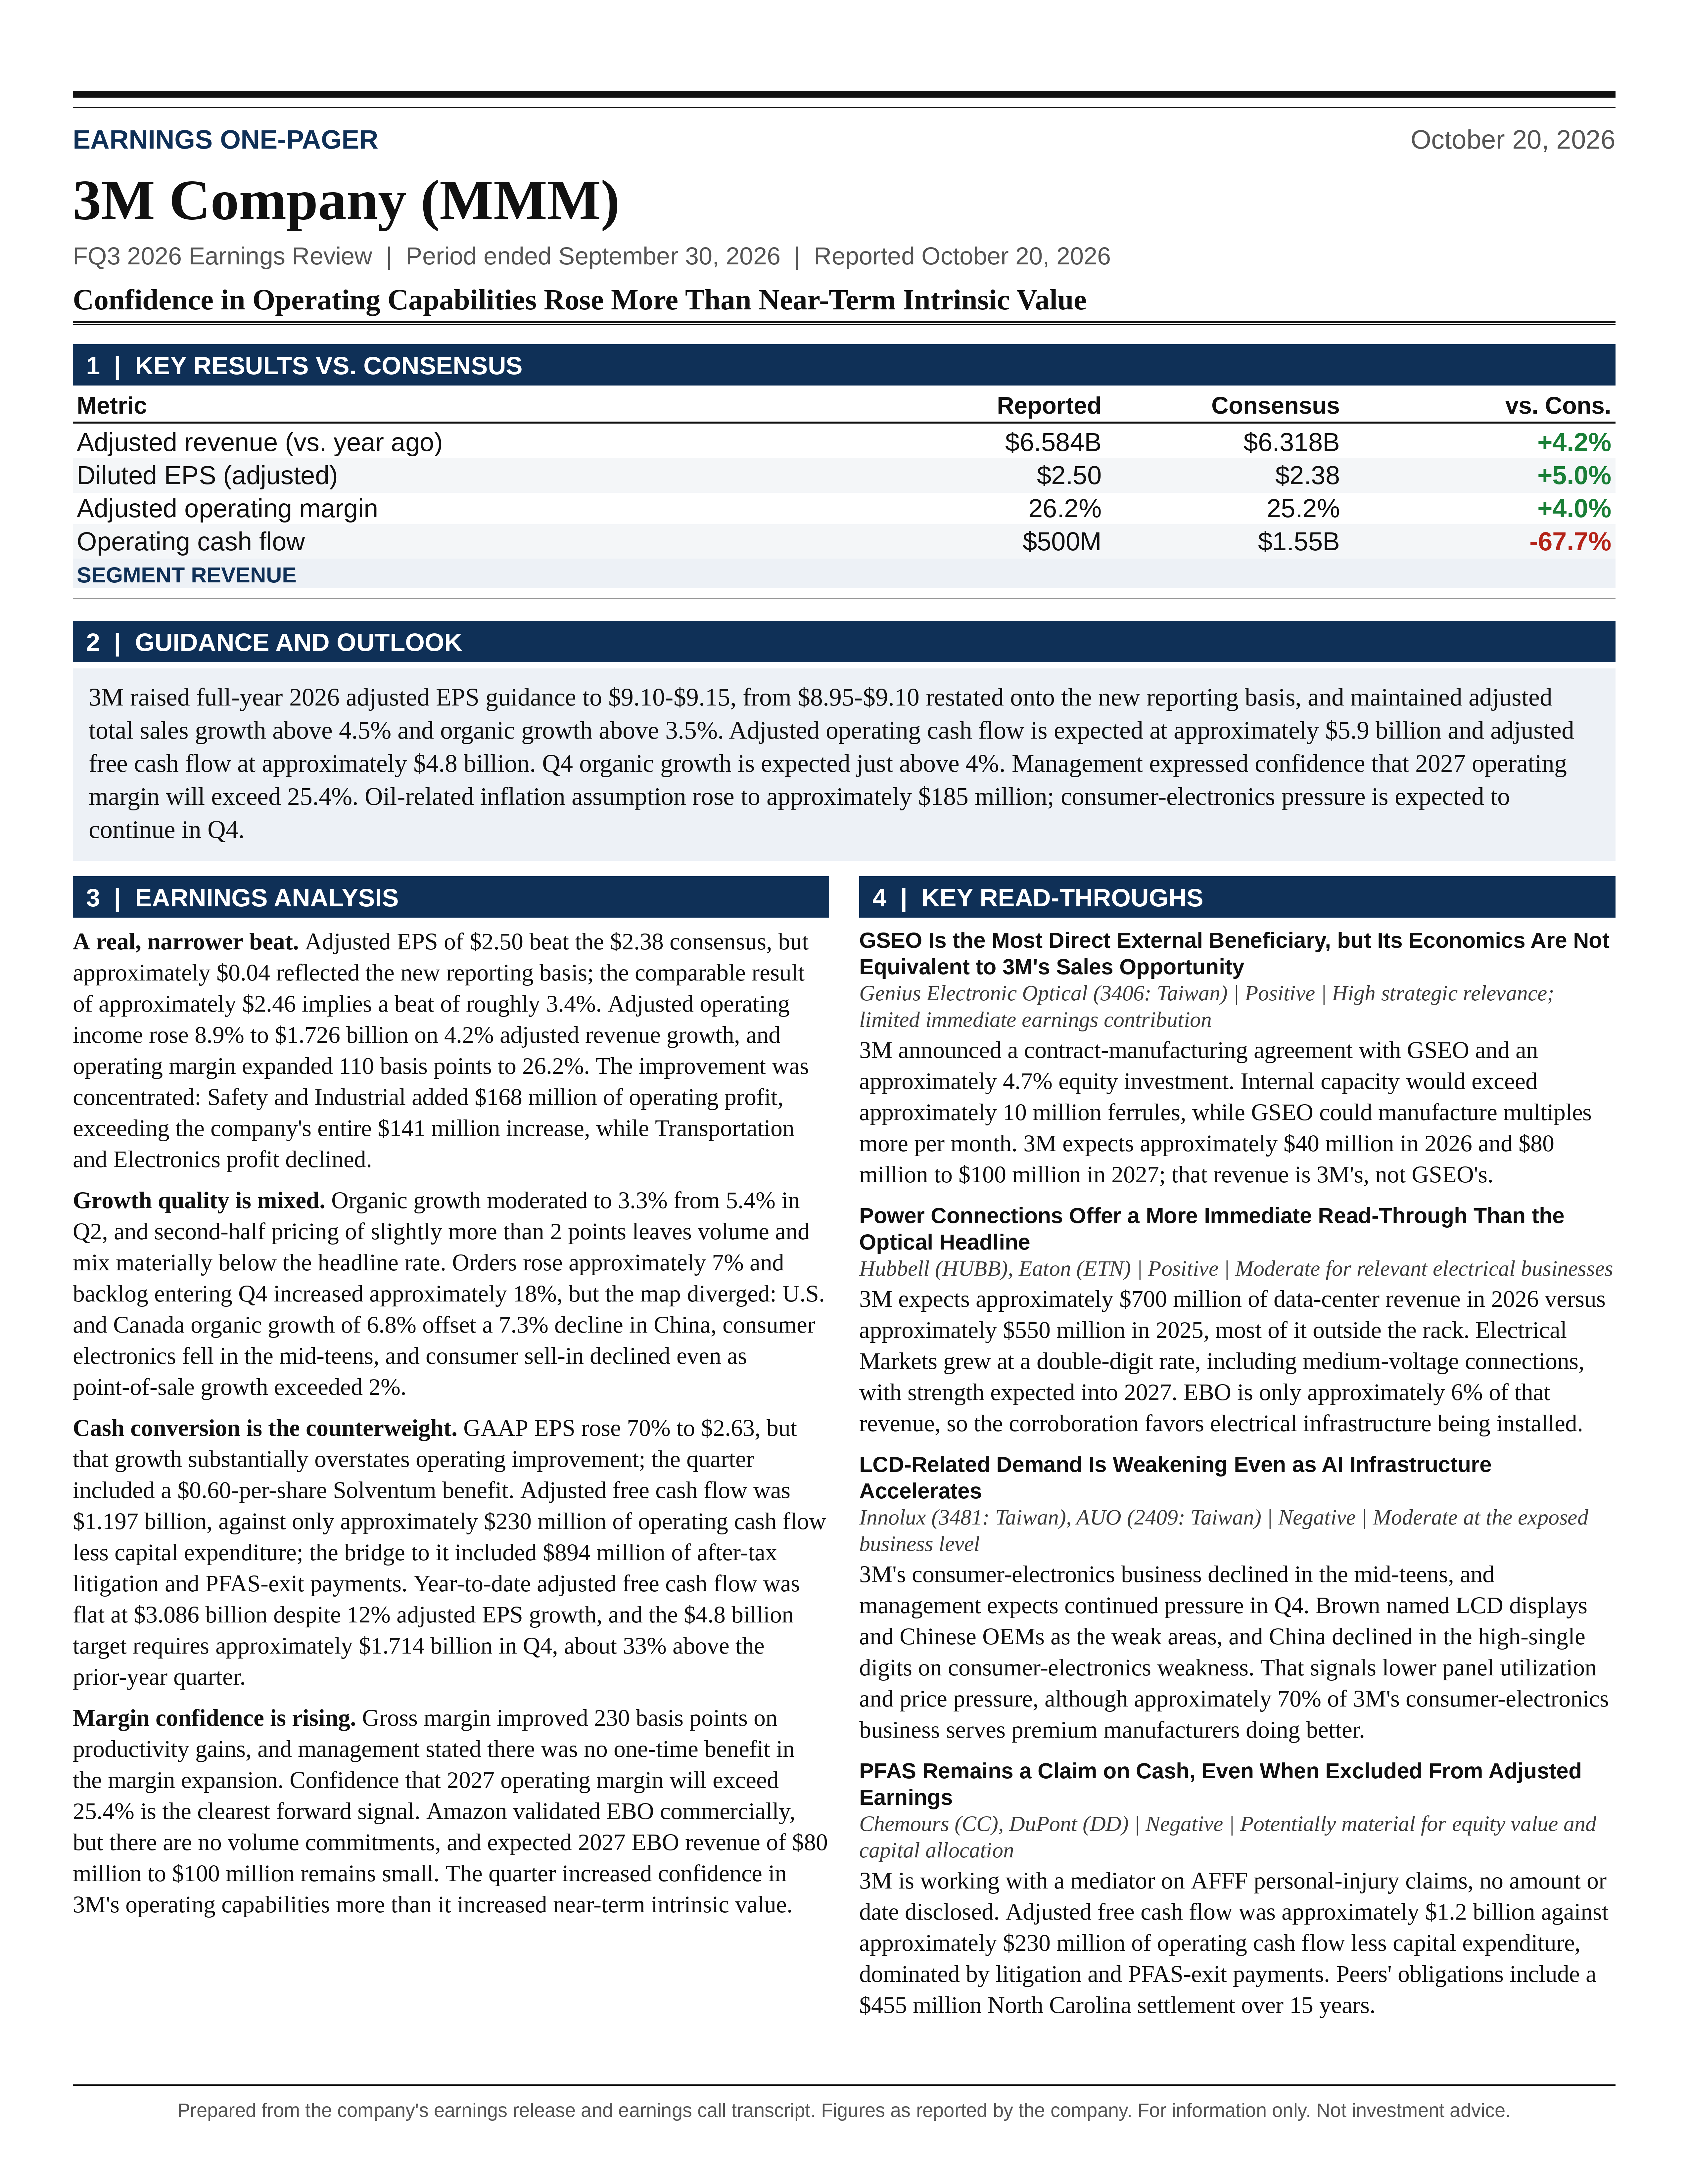
Adjusted EPS of $2.50 exceeded the supplied $2.38 consensus estimate, although approximately $0.04 reflected a reporting change. Removing that disclosed base effect produces an indicative comparable result of approximately $2.46, implying a roughly 3.4% beat rather than the headline 5.0%. The full-year EPS midpoint increased by $0.10, or approximately 1.1%, relative to the prior guidance restated onto the new accounting basis. Organic growth guidance remained above 3.5%, operating-margin expectations were effectively maintained, and adjusted free cash flow remained approximately $4.8 billion. This was a genuine earnings improvement, but not a broad-based upgrade across the financial outlook.
The strongest evidence supporting the turnaround was operational. Adjusted operating income increased approximately 8.9% to $1.726 billion on 4.2% adjusted revenue growth, and operating margin expanded 110 basis points to 26.2%. Management attributed $0.22 of the $0.27 year-over-year EPS increase to operating performance. However, the improvement was highly concentrated: Safety and Industrial generated $168 million of additional operating profit, exceeding the entire company’s $141 million increase, while Transportation and Electronics profitability declined.
The principal near-term test is Q4 cash conversion and backlog execution. Achieving the $4.8 billion annual adjusted free-cash-flow target requires approximately $1.714 billion in Q4, about 33% above the comparable 2025 quarter. The principal medium-term test is whether 2027 organic growth remains around the Q4 exit rate while operating margin exceeds 25.4%, without depending on an outsized EBO contribution. EBO revenue is expected to reach only $80 million to $100 million in 2027. Its strategic significance substantially exceeds its near-term earnings contribution.
RESULTS QUALITY AND REPORTING COMPARABILITY
Q3 adjusted revenue was $6.584 billion, compared with $6.318 billion in Q3 2025, representing 4.2% growth. Adjusted organic growth was 3.3%, net acquisition and divestiture activity contributed approximately 0.9%, and currency was effectively neutral. GAAP revenue increased only 1.0%, from $6.517 billion, because the prior-year reported revenue base included manufactured PFAS products that are excluded from adjusted comparisons.
The difference between GAAP and adjusted growth is economically important. Adjusted organic growth provides a more relevant measure of the continuing portfolio, but the removal of exited PFAS revenue does not extinguish associated environmental obligations or cash payments. The continuing operating business and the legacy liability burden must therefore be valued separately. Applying an adjusted earnings multiple while disregarding the associated legacy cash claims would overstate equity value.
Beginning in Q3, 3M excluded acquired intangible-asset amortization from adjusted earnings and retrospectively restated historical results. Management described the base effect as approximately 40 basis points of operating margin and $0.04 of quarterly EPS. Q3 2025 adjusted EPS was consequently restated from $2.19 to $2.23, and adjusted operating margin from 24.7% to 25.1%. The reported 12% EPS increase and 110-basis-point margin improvement are therefore substantially comparable year over year, rather than being created by the accounting change.
Consensus comparisons are less straightforward. The Bloomberg notice explicitly states that the $2.38 EPS estimate was not directly comparable with the new reporting basis. Using the disclosed approximate $0.04 base adjustment produces the indicative $2.46 comparable result. Similarly, subtracting approximately 40 basis points from the reported 26.2% operating margin gives approximately 25.8%, still above the supplied 25.2% consensus estimate. The earnings and margin beats survive normalization, but their magnitudes are smaller than the unadjusted headlines imply. These calculations are approximations, not complete acquisition-specific consensus reconciliations.
The accounting change also affects the interpretation of valuation. A higher adjusted EPS denominator mechanically lowers the apparent price-to-earnings multiple without increasing cash flow. Comparisons with historical 3M valuation multiples should therefore use consistently restated earnings. Otherwise, the shares can appear to have become cheaper merely because an expense has been excluded.
GAAP EPS increased 70% to $2.63 from $1.55, but that growth rate substantially overstates operating improvement. The current quarter included a $0.60-per-share benefit from the change in value of the Solventum ownership position, compared with a $0.13-per-share adverse adjustment in Q3 2025. That $0.73 swing represented approximately 68% of the $1.08 increase in GAAP EPS. The absence of the prior-year $0.30-per-share divestiture loss also benefited the comparison.
The current-quarter reconciliation excluded $0.19 per share of litigation and PFAS-exit costs, $0.08 of transformation costs, and $0.20 of amortization and acquisition-related items, while removing the $0.60 Solventum benefit. The $0.20 acquisition-related adjustment should not be interpreted as the amortization-policy change alone. It encompasses a broader collection of transaction-related items, including effects associated with the venture structure.
Adjusted net income increased approximately 9.0%, while diluted weighted-average shares declined approximately 2.9%. Share repurchases therefore contributed meaningfully to the difference between net-income growth and EPS growth. Nevertheless, the quarterly earnings bridge was predominantly operational: approximately 81% of the $0.27 EPS increase came from operating profit, with the remaining $0.05 reflecting below-the-line items, including lower share count partly offset by a higher tax rate. The adjusted tax rate increased to 21.1% from 19.9%, making the operating result more persuasive than an EPS beat driven by favorable tax timing.
GROWTH TRAJECTORY: IMPROVING OVER TIME, BUT NOT LINEARLY
The historical growth progression remains constructive. On the company’s current presentation, organic growth increased from 1.2% in 2024 to 2.1% in 2025, with more than 3.5% expected in 2026. This supports the argument that commercial execution, product development, and customer-service improvements are raising the company’s growth capability.
The quarterly pattern is more uneven. Organic growth was 1.2% in Q1 2026, accelerated to 5.4% in Q2, and moderated to 3.3% in Q3. Q3 therefore represented a 210-basis-point deceleration from Q2, not a continuation of that quarter’s growth rate. Management expects growth to reaccelerate to just above 4% in Q4, supported by backlog conversion and easier comparisons.
The annual outlook was maintained despite a change in the composition of growth. General industrial and safety expectations improved from the July outlook, with H2 growth now expected in the high-single digits. Consumer electronics weakened, while consumer recovery remained slower than anticipated. The unchanged consolidated forecast therefore reflects stronger execution in selected businesses offsetting deterioration elsewhere, rather than uniformly improving demand.
Pricing is an important component of the acceleration. Management now expects slightly more than 1.5 percentage points of pricing for 2026, compared with approximately 1.5 points previously, and slightly more than 2 points in H2 versus approximately 1 point in H1. Against H2 organic growth close to 4%, this suggests that underlying volume and mix growth remain materially below the headline organic rate, broadly around 1.5% to 2% depending on the precise pricing outcome.
The distinction matters for the through-cycle thesis. Price increases that reimburse input inflation preserve dollar earnings but do not necessarily indicate stronger real demand or structurally greater pricing power. A higher-quality growth transition would involve sustained volume gains, improving customer retention, and incremental product content, with less dependence on inflation-related price realization.
Brown linked pricing success to operating execution rather than inflation alone, emphasizing “significantly better responsiveness, service, delivery rates, product availability.” This is a credible mechanism: greater delivery reliability can lower customers’ switching incentives and improve acceptance of price increases. However, the call did not quantify customer elasticity, retention improvement, or market-share gains sufficiently to establish how much pricing can be retained if input inflation reverses.
Orders and backlog provide support for the Q4 outlook. Management described quarterly order growth of approximately 7%, year-to-date order momentum above 8%, and backlog entering Q4 approximately 18% above the prior year. Around 25% of expected quarterly revenue was already represented in backlog.
That is useful visibility, but not comprehensive protection. Approximately 75% of quarterly revenue still depends on orders converting and shorter-cycle demand materializing. Backlog growth also exceeds revenue growth by a meaningful margin. This can indicate future acceleration, but it can also reflect delivery timing, project scheduling, mix, or customer order behavior. Backlog aging, cancellations, shipment conversion, and price versus unit content remain important monitoring variables.
Geographically, adjusted organic growth was 6.8% in the U.S. and Canada, 7.7% in Latin America, 1.3% in other Asia, and 1.0% in Europe, the Middle East and Africa. China declined 7.3%, reversing the strong growth described in Q2. The geographic mix reinforces the central conclusion: U.S. industrial strength is offsetting weakness in China-linked consumer electronics, rather than 3M participating in a synchronized global recovery.
SAFETY AND INDUSTRIAL: THE PRIMARY EARNINGS ENGINE
Safety and Industrial delivered the strongest combination of growth and profitability. Revenue increased 9.1% to $3.182 billion, including 7.0% organic growth, approximately 1.9% from net acquisition and divestiture activity, and 0.2% from currency. Operating income increased 21.2% to $960 million, and operating margin expanded 300 basis points to 30.1%.
The segment generated approximately 56% of consolidated adjusted operating income despite representing approximately 48% of adjusted revenue. Its $168 million operating-profit increase exceeded the company’s total $141 million improvement. Consumer contributed another $8 million, while Transportation and Electronics declined $16 million and corporate results deteriorated approximately $19 million.
This concentration is simultaneously encouraging and a risk. The turnaround has a demonstrably productive core, but consolidated earnings momentum remains more dependent on Safety and Industrial than a broad portfolio narrative might imply. Sustaining industrial orders, pricing, and productivity in this segment is more important to near-term earnings than the absolute size of the EBO opportunity.
Electrical Markets continued to grow at a double-digit rate, supported by data-center infrastructure demand. Safety, industrial adhesives, abrasives, and industrial specialties collectively grew at high-single-digit rates. The breadth across these businesses argues against attributing the entire performance to AI infrastructure. Commercial coverage, lower churn, cross-selling, and product launches appear to be producing benefits across conventional industrial markets.
Automotive aftermarket grew in the mid-single digits despite a soft collision-repair claims market. New products and wins with large multi-shop operators provide evidence of customer-specific execution overcoming unfavorable end-market conditions. This is a more differentiated growth signal than simply benefiting from an expanding vehicle-production market.
Organic growth nevertheless moderated from 8.2% in Q2 to 7.0% in Q3. The segment remains strong, but the sequential direction should not be ignored. Its year-to-date organic growth of 6.1%, together with double-digit orders and backlog growth, supports continued expansion without requiring an assumption that the Q2 growth rate is the sustainable baseline.
The Madison transaction contributed to reported growth and operating profit, but it should not be credited with the entire margin expansion. Management described the venture’s margin as somewhat above the company’s 26.2% level, which does not establish that it exceeds Safety and Industrial’s 30.1% margin. The acquisition’s mix contribution and the legacy segment’s productivity contribution are distinct.
TRANSPORTATION AND ELECTRONICS: THE MAIN OPERATING VULNERABILITY
Transportation and Electronics revenue increased only 0.4% to $1.999 billion, with organic growth of 0.5%. Operating income declined 3.4% to $468 million, and margin contracted 90 basis points to 23.4%. This was a meaningful deterioration from Q2 organic growth of 5.9%.
The segment’s weakness demonstrates that innovation and commercial execution have not eliminated its sensitivity to consumer-device cycles. Semiconductor, data-center, aerospace, and commercial-branding strength was insufficient to prevent a year-over-year decline in operating profit.
Management stated that the business excluding consumer electronics grew approximately 5%, while consumer electronics declined in the mid-teens. Using 5% and negative 15% as illustrative growth rates implies a prior-period consumer-electronics weight of roughly 23% within the segment. This is only an approximation, but it illustrates how a comparatively modest portion of consolidated sales can materially suppress a segment’s growth and profitability.
Consumer-electronics weakness was concentrated in LCD displays and Chinese device manufacturers. Management indicated that approximately 70% of its consumer-electronics business serves premium manufacturers, where thermal management, foldable devices, and other new applications are performing better. That provides a plausible route back to growth, but it does not establish the timing or magnitude of recovery.
The call also left an important technical question unresolved. The presentation referenced industry-wide memory shortages, and the analyst question explicitly raised memory conditions, but management’s answer focused on LCD exposure, Chinese OEM weakness, and premium-device innovation. The relative contributions of component constraints, device-unit demand, customer inventory, and technological substitution were not quantified.
This uncertainty matters because cyclical destocking and structural product displacement have different valuation implications. A temporary device-production slowdown can reverse without significant reinvestment. A sustained migration away from products with relatively high 3M content requires replacement technologies and new design wins. Management’s premium-device positioning is encouraging, but the call did not provide enough evidence to eliminate that distinction.
Aerospace remained a positive offset, supported by defense, civil aircraft production, and space materials. Commercial branding grew in the mid-single digits, while automotive OEM exposure declined in the mid-single digits on softer builds. These businesses provide diversification, but they did not neutralize the consumer-electronics earnings drag in Q3.
The expected Q4 acceleration rests on double-digit backlog growth, continued strength in aerospace, semiconductors and data centers, commercial-branding execution, and selected automotive wins. Importantly, management is not assuming a consumer-electronics rebound in Q4. That makes the forecast less dependent on an immediate device recovery, but more dependent on converting the stronger backlog in the rest of the segment.
CONSUMER: BETTER PROFITABILITY, BUT RECOVERY REMAINS UNCONFIRMED
Consumer revenue declined 0.4% to $1.307 billion, with organic growth of negative 0.2%, described as approximately flat on the call. This improved from negative 2.1% organic growth in Q2, but fell short of management’s expectation for positive Q3 growth.
Brown explicitly acknowledged the miss: “Of course, we thought Q3 was going to be positive. It didn’t happen.” That statement is important because the projected Q4 improvement should be treated as a renewed expectation rather than confirmation that a recovery has already occurred.
U.S. point-of-sale growth exceeded 2%, while company sell-in declined in the low-single digits. Management attributed the difference to inventory reductions at selected large retailers, including approximately 0.5 week of inventory reduction in Q2 and another 0.5 week in Q3. International sales continued to grow in the mid-single digits, but approximately 70% of the consumer business remains U.S.-oriented.
The sell-through and sell-in divergence provides a reasonable explanation for weak reported sales without requiring a collapse in end-demand. However, positive point-of-sale growth does not guarantee imminent replenishment. Retailers can operate with lower inventory targets, improve replenishment systems, or prioritize working-capital reduction. Inventory stabilization remains a forecast rather than a demonstrated outcome.
Profitability was more encouraging than sales. Operating income increased 2.9% to $300 million, and margin expanded 80 basis points to 23.0% despite slightly lower revenue. This indicates that cost and mix actions can improve earnings without a meaningful demand recovery.
Given the segment’s approximately 20% revenue weight, modest positive growth would help the consolidated result but would not transform it. A shift from flat to 2% growth would contribute only approximately 0.4 percentage point to company growth before mix and other effects. Consumer is therefore best viewed as a potential drag reduction rather than the principal engine of the investment thesis.
PRODUCTIVITY AND MARGIN EXPANSION
Management reported 230 basis points of gross-margin improvement, supported by procurement savings, higher throughput, lower downtime, improved quality, and better asset utilization. Cost of poor quality improved 40 basis points, while overall equipment effectiveness improved 20 basis points.
These indicators are consistent with operational improvement, but they should not be mechanically added together. They have different measurement bases, and procurement, throughput, quality, and utilization can overlap economically. The call did not provide enough detail to independently reconstruct the entire gross-margin bridge.
The difference between 230 basis points of gross-margin improvement and 110 basis points of operating-margin expansion indicates that part of the manufacturing benefit was absorbed by investments, stranded costs, corporate expenses, and other operating factors. This is not inherently negative. Reinvestment can improve the durability of growth. It does mean that gross-margin progress should not be assumed to flow entirely into earnings.
The operating-profit bridge was constructive. Approximately $260 million of benefit from growth and productivity was partly offset by approximately $120 million of stranded costs and investments. The resulting improvement was not dependent on a strong consolidated volume cycle.
Maheshwari characterized the expansion directly: “There is no one-time benefit in terms of the margin expansion.” The subsequent explanation emphasized cost control, supply-chain productivity, automation, and procurement. This supports a structural interpretation, but the statement applies to adjusted operating performance. It does not mean that achieving the improvement required no cash restructuring expenditure or excluded charges.
The distinction is material. Q3 adjusted earnings excluded $58 million of transformation costs, and year-to-date adjusted earnings excluded $224 million. The cash-flow reconciliation added back $50 million of after-tax transformation payments in Q3 and $93 million year to date. The recurring cost base may be improving, but the investment required to obtain those savings remains an economic cost.
Management has closed or exited 16 manufacturing and distribution sites year to date and is taking action on another 10 over the next 12 months. G&A transformation is already contributing, while manufacturing consolidation is expected to become more meaningful in 2028, reflecting typical paybacks of approximately 3 to 5 years.
The timing prevents an overly aggressive 2027 earnings bridge. A significant portion of the announced factory restructuring is a longer-duration benefit rather than an immediate source of next-year margin upside. Site transfers also introduce execution risks involving qualification, inventory buffering, customer service, production yields, and temporary duplication of costs.
Brown indicated that gross margin has progressed from the low-40% range toward the mid-40% range and could potentially reach the high-40% range over approximately 4 to 5 years. This provides a credible long-term opportunity, but it is an aspiration rather than formal annual guidance. The achievable operating-margin benefit will depend on reinvestment needs, pricing, mix, and the durability of manufacturing savings.
2026 GUIDANCE: A MODEST ECONOMIC UPGRADE
The October EPS forecast increased to $9.10 to $9.15 from the July range of $8.80 to $8.95 on the original basis. Comparing those ranges directly produces a $0.25 midpoint increase, but approximately $0.15 reflects the accounting-basis change.
Management restated the July forecast to $8.95 to $9.10. Against that comparable baseline, the midpoint increased from $9.025 to $9.125, an improvement of $0.10, or approximately 1.1%. Approximately 60% of the apparent midpoint increase versus the originally published July range was therefore attributable to the reporting change.
The new lower end equals the old upper end on the comparable basis. The range also narrowed from $0.15 to $0.05. The practical message is improved confidence in delivering near or above the prior best-case annual outcome, rather than a major acceleration in the earnings trajectory.
Organic growth remained above 3.5%, and adjusted total revenue growth remained above 4.5%. Adjusted free cash flow moved from the July range of $4.7 billion to $4.9 billion to approximately $4.8 billion, preserving the midpoint. Adjusted operating cash flow similarly moved from $5.8 billion to $6.0 billion to approximately $5.9 billion.
The current approximately 24.6% operating-margin forecast is broadly consistent with the July 24.1% to 24.2% forecast after allowing for the approximately 40-basis-point reporting change and rounding. The higher reported margin target should not be treated as an equivalent economic upgrade.
Oil-related inflation increased to approximately $185 million from the July range of $150 million to $175 million. The new assumption is $10 million above the prior high end and $22.5 million above the prior midpoint. Management expects pricing to offset the additional dollar cost, preserving the earnings outlook.
The company continues to estimate approximately 20 basis points of margin-rate dilution from dollar-neutral inflation pass-through. This is economically logical: adding equal amounts of revenue and cost preserves operating profit dollars but increases the revenue denominator. Productivity must therefore offset that dilution before reported margin can expand.
Year-to-date adjusted EPS of $7.11 implies approximately $1.99 to $2.04 in Q4 to achieve the annual forecast, subject to quarterly versus annual share-weighting effects. That compares with recast Q4 2025 EPS of $1.87, implying approximately 6% to 9% growth. It also represents a substantial sequential decline from Q3’s $2.50, consistent with seasonality and the disclosed expense cadence.
An illustrative full-year revenue level of approximately $25.4 billion and the 24.6% annual margin forecast imply a Q4 operating margin around 22.7%, after subtracting year-to-date revenue and operating income. This is an analytical approximation, not management guidance. It illustrates why annualizing Q3’s 26.2% margin would overstate near-term earnings.
Q4 is expected to include approximately $125 million of stranded costs and investments, comprising $50 million of stranded costs and $75 million of investments. The full-year assumptions remain $150 million and $225 million, respectively. There was no meaningful change to that expense cadence.
2027 FRAMEWORK: STRONGER CONFIDENCE, NOT COMPLETE GUIDANCE
The most important forward-looking statement was management’s confidence that 2027 operating margin will exceed 25.4%. That threshold is the prior approximately 25.0% Investor Day target restated for the amortization-policy change. The 40-basis-point increase in the numerical target is not itself an operating upgrade.
The genuine improvement is the expressed confidence in exceeding the restated target despite inflation, tariffs, stranded costs, and continued investment. Relative to the approximately 24.6% 2026 outlook, exceeding 25.4% requires more than approximately 80 basis points of annual expansion.
The growth framework was less precise. Prepared remarks indicated growth broadly consistent with the H2 exit rate, while Q&A suggested acceleration from approximately 4% as innovation, commercial initiatives, and pricing contribute. Formal guidance will not be issued until January 2027. A reasonable interpretation is that approximately 4% organic growth represents the emerging planning reference, not a formally committed floor.
Maheshwari stated that volume incrementals are moving toward the upper end of the historical 30% to 40% range: “I think we are more closer to the 40% right now in incrementals.” That is important operating leverage, but it should be applied to incremental volume rather than indiscriminately to all revenue growth. Inflation-reimbursement pricing can carry little incremental profit, and acquired revenue requires separate financing and ownership adjustments.
On an illustrative $25.4 billion revenue base, 100 basis points of operating-margin improvement represents approximately $254 million of additional operating profit. At a 20% tax rate and approximately 520 million diluted shares, that equates to roughly $0.39 of EPS before noncontrolling interests and other changes. Consequently, the margin program is a much larger 2027 earnings lever than the expected EBO revenue increase.
The stranded-cost discussion requires careful interpretation. Management described approximately $100 million of headwind in 2025, $150 million in 2026, and another incremental $50 million in 2027. The $50 million should not be interpreted as a reduction of the existing $150 million cost burden to $50 million. It is an additional headwind that productivity must absorb.
The presentation also identified potential 2027 headwinds from interest expense and non-operating pension items, with share repurchases providing a tailwind and the tax rate remaining around 20%. Operating-profit growth should therefore not be translated mechanically into identical EPS growth.
The call did not supply a quantified 2027 productivity target, detailed investment budget, complete volume assumption, buyback amount, or non-operating bridge. Management’s confidence is stronger than the precision of the available forecast. The January guidance will be a substantive information event rather than a routine confirmation.
INNOVATION: BETTER LEADING INDICATORS, WITH ATTRIBUTION LIMITS
3M launched 87 products in Q3, up 24%, and expects more than 350 launches for 2026, approximately 23% above the prior year. Management also expects to exceed the Investor Day objective of 1,000 launches over 3 years.
Sales from products introduced within the preceding 5 years increased 34% year to date to nearly $3 billion. The new-product vitality index has recovered into the mid-teens from 11% in 2024. These are meaningful signs that the innovation system is becoming more productive.
However, the nearly $3 billion figure is a rolling cohort measure, not incremental revenue created during 2026. It includes sales from products launched across multiple years, can include replacement products, and is affected by products entering and leaving the measurement window. Adding this amount to the revenue forecast would materially double count existing sales.
The more relevant economic questions are how much of the cohort represents genuinely new applications, net market-share gains, higher content per customer, or improved pricing, and how much replaces older products. Management stated that new products generally become margin-accretive as they reach scale, but did not quantify the uplift.
Development cycle times have improved approximately 20%, while on-time launch attainment is around 80% to 81%. The development funnel is being replenished faster than products are launched, according to management. Together, these indicators suggest that current launch growth is not simply exhausting an inherited pipeline.
The growing mix of more complex projects could lengthen average development cycles even if execution improves. A temporary deterioration in aggregate cycle-time statistics would therefore need to be evaluated alongside project mix and expected commercial value, rather than automatically interpreted as weaker R&D discipline.
AI-enabled development offers a plausible productivity opportunity through virtual prototyping, simulation, and better access to internal materials and process data. Management is codifying patent information, technical papers, specifications, safety information, and manufacturing knowledge. The investment proposition is more output per development dollar, but no quantified AI-specific earnings or cash-flow benefit was disclosed.
Cross-selling also appears ahead of plan, with $140 million of booked wins and another $120 million in the pipeline versus an original $100 million objective over 3 years. The result supports the commercial-execution thesis, although booked wins and pipeline should not be treated as interchangeable with current recognized revenue or added separately to growth already embedded in guidance.
EBO AND AMAZON: COMMERCIAL VALIDATION WITHOUT GUARANTEED REVENUE
The Amazon announcement was the call’s most significant strategic development. It complements the previously announced Microsoft deployment and reduces uncertainty about whether a major hyperscaler considers EBO commercially relevant.
The key qualification was explicit. When asked whether the $6 billion represented a minimum purchase commitment, Brown stated: “There is no volume commitments here.” He added: “We have got to earn a right to that.”
The $6 billion amount is therefore a commercial milestone associated with warrant vesting, not contracted backlog, a take-or-pay obligation, or guaranteed cumulative revenue. No customer-funded capacity commitment or other mechanism materially underwriting the manufacturing expansion was disclosed.
The October 19 Form 8-K provides greater precision than the rounded call description. Amazon received a warrant to purchase up to 3,162,015 shares at $164.89 per share over 7 years. Approximately 85% of the warrant shares vest based on payments for optical connectivity and other data-center products, with full vesting of that portion at $6 billion of cumulative payments. The remaining 15% depends on event-based milestones.
Several distinctions matter. The milestone is based on customer payments, which are not necessarily synchronized with revenue recognition. It encompasses other data-center products as well as optical connectivity. It is not an EBO-only sales target. The commercial trajectory is expected to be back-end weighted, rather than evenly distributed across the period.
Dividing $6 billion by 7 yields approximately $857 million annually, but that is only an arithmetic average. It is not annual guidance. Similarly, the analyst’s suggestion of approximately $1 billion of 2028 EBO revenue was not endorsed. Management explicitly declined to size EBO beyond 2027.
The warrant’s approximately 0.6% headline share count understates neither nor fully describes its economic cost. Amazon must pay the exercise price if the warrant is exercised for cash, which would generate approximately $521 million of proceeds at full exercise. That amount is not the value of a free share grant. Conversely, a long-dated option has economic value even when its exercise price is near the prevailing stock price.
The agreement can be attractive if it accelerates profitable customer adoption, but the relationship’s return must incorporate warrant economics, manufacturing investment, customer concentration, pricing, and any relevant customer-consideration accounting. Those elements were not quantified sufficiently to verify management’s claim of significant accretion.
The strategic interpretation is nevertheless favorable. Amazon creates another major route to deployment, provides an incentive for scaled purchasing, and increases confidence in commercial applicability. The appropriate valuation treatment is a higher probability of successful commercialization, not recognition of $6 billion as secured sales.
EBO REVENUE, MANUFACTURING, AND ECOSYSTEM RISKS
Management expects approximately $40 million of EBO revenue in 2026 and $80 million to $100 million in 2027. The implied growth rate is impressive, but the absolute contribution remains small.
Against an illustrative $25.4 billion company revenue base, the $40 million to $60 million increase would contribute approximately 0.16 to 0.24 percentage point to consolidated growth. Even assuming an illustrative 40% incremental operating margin, a 20% tax rate, and 520 million shares, the incremental EPS contribution would be only approximately $0.025 to $0.037. That margin assumption is analytical, not company guidance.
EBO therefore cannot independently explain a substantial 2027 earnings upgrade. Its principal valuation contribution is the possibility of a larger 2028-and-beyond business and evidence that 3M’s innovation system can establish positions in faster-growing applications.
Management reiterated an approximately $2 billion addressable market around 2028. That is an opportunity estimate rather than a company revenue forecast. A $1 billion EBO business in that period would imply approximately 50% penetration of the stated market, making customer adoption, competitive positioning, product scope, and ecosystem economics critical assumptions.
The technology addresses practical deployment problems. Its patented ferrule enables contactless optical coupling with lower sensitivity to contamination and handling, supporting faster installation and maintenance in dense architectures and difficult-to-access backplanes. The economic value proposition concerns deployment speed, reliability, and serviceability as well as optical performance.
The manufacturing agreement with GSEO addresses a significant scaling constraint. 3M has doubled internal capacity to more than approximately 10 million ferrules annually. Management indicated that GSEO’s existing precision-optics capabilities could support multiples of that volume per month.
Potential manufacturing scale should not be confused with qualified production capacity. Precision-optics expertise does not automatically establish acceptable yields, consistency, reliability, or customer approval for every EBO configuration. The near-term manufacturing milestones are process qualification, product quality, unit economics, and shipment acceptance.
The October 19 GSEO announcement described the approximately 4.7% equity investment as expected to close in Q4, subject to customary conditions. That is more conditional than the call’s shorthand description of an acquired stake. The investment supports strategic alignment, but it does not establish that the entire capacity expansion is already operational.
The EBO Multi-Source Agreement expanded from 17 members in May to 44 in July and 63 currently. This broadens the ecosystem and reduces dependence on bilateral arrangements. However, membership is not equivalent to committed purchasing or commercial qualification.
Brown emphasized that 3M manufactures the ferrule, while other parties terminate fibers, assemble connectors, integrate equipment, and install systems. Hyperscalers and server manufacturers also control architectural choices. Adoption therefore depends on coordinated execution across a value chain rather than 3M’s manufacturing capacity alone.
Supply diversity is especially important. Multiple qualified sources can increase hyperscaler willingness to adopt EBO, but may also distribute manufacturing economics across more participants. The long-term value captured by 3M will depend on its proprietary technology, component position, potential licensing economics, and ability to remain central to the standard. Those economics were not fully disclosed.
BROADER DATA-CENTER AND SPACE OPPORTUNITIES
Management expects approximately $700 million of data-center revenue in 2026, compared with approximately $550 million in 2025, implying roughly 27% growth. The approximately $150 million increase is materially larger than the current EBO business.
EBO represents only approximately 6% of expected 2026 data-center revenue. Most of the exposure remains outside the rack, including electrical connections and related infrastructure. This is important because the near-term data-center earnings contribution is more dependent on conventional materials and electrical products than the optical-connectivity discussion suggests.
The company’s exposure spans power connections, thermal management, vibration, acoustics, copper connectivity, optics, and selected behind-the-meter applications. This creates more diversification than an EBO-only thesis, but does not eliminate dependence on data-center construction and spending cycles.
Nextel ceramic fibers were identified as a growth opportunity in certain behind-the-meter applications, with capacity being expanded and a potential step-up in 2027 followed by greater contribution in 2028. The call did not disclose revenue, margins, customer concentration, or enough application detail to justify assigning a specific financial value.
Space materials provide another example of extending existing technologies into higher-value applications. Products address reflectivity, thermal protection, energy generation, and weight reduction across low-Earth-orbit and geosynchronous systems. A reflective film launched in Q3, and a moisture-barrier product for solar panels is planned for Q4.
These opportunities are strategically credible because they use existing films, adhesives, and manufacturing capabilities. However, no addressable-market estimate, content-per-satellite figure, or quantified revenue outlook was supplied. Qualification cycles, constellation deployment, government programs, and customer concentration could all influence commercialization. Space should remain a longer-duration option rather than a major component of the 2027 earnings bridge.
MADISON FIRE AND RESCUE: CONSOLIDATED GROWTH IS NOT SHAREHOLDER ACCRETION
The Madison transaction is more complex than a conventional wholly owned acquisition. The quarterly filing states that the business was acquired for approximately $1.9 billion, net of acquired cash and subject to adjustments. 3M contributed its self-contained breathing apparatus business to a venture with Bain Capital, which contributed approximately $1.3 billion. The venture also used a term-loan facility.
3M holds 50.1% of the voting interest and consolidates the venture. Consequently, consolidated revenue and operating income include amounts that are not wholly attributable to 3M shareholders.
Management stated that the transaction is expected to be EPS-neutral in both 2026 and 2027. Higher consolidated operating profit is offset by financing expense and noncontrolling interests. This is the most important modeling conclusion: neither the acquired revenue nor its operating margin can be translated directly into incremental shareholder earnings.
The approximately $200 million of additional Madison revenue discussed for 2027 represents an incremental contribution versus 2026, not the acquired business’s entire annual revenue base. The filing disclosed approximately $90 million of Madison revenue in Q3. The Fire Safety and Rescue division’s larger reported revenue includes the pre-existing SCBA business.
The venture adds financial complexity. Bain’s interest is puttable to 3M after 5 years, with contractual floors and caps, and distributions require both parties’ approval. The September balance sheet included approximately $971 million of redeemable noncontrolling interest, while the filing disclosed an approximately $340 million derivative liability associated with the partner’s net put right.
These features are relevant to valuation and future cash claims even when excluded from adjusted earnings. The transaction can enhance growth and strategic positioning, but its shareholder return must be evaluated after financing, minority economics, and potential future redemption obligations.
CASH FLOW: THE MOST IMPORTANT COUNTERWEIGHT TO THE EARNINGS NARRATIVE
The call emphasized $1.2 billion of free cash flow, but the relevant measure was adjusted free cash flow. The financial supplement reported $486 million of GAAP operating cash flow and $256 million of capital expenditure, leaving only approximately $230 million of operating cash flow less capital expenditure.
The bridge to $1.197 billion of adjusted free cash flow included $967 million of cash adjustments. These consisted primarily of $894 million of after-tax litigation and PFAS-exit payments, plus $23 million of acquisition-related payments and $50 million of transformation payments.
Those adjustments can help isolate the continuing operation’s cash-generating capability. They do not make the excluded payments economically irrelevant. Litigation, restructuring, and acquisition obligations still consume cash otherwise available for debt reduction, distributions, or reinvestment.
The year-over-year comparison was also weaker than the absolute cash figure suggests. Adjusted operating cash flow declined approximately 4.5%, from $1.522 billion to $1.453 billion. Adjusted free cash flow declined approximately 8.6%, from $1.310 billion to $1.197 billion. GAAP operating cash flow fell from $1.756 billion to $486 million, heavily influenced by the timing and direction of special-item cash flows.
The Bloomberg notice’s approximately $500 million operating cash-flow result versus a $1.55 billion estimate indicates a substantial headline shortfall. However, the estimate’s treatment of litigation and other adjustments is not specified. The shortfall cannot automatically be interpreted as an equivalent miss in underlying operating cash generation, and adjusted free cash flow should not be compared directly with an operating cash-flow estimate.
Year-to-date adjusted free cash flow was effectively unchanged at $3.086 billion versus $3.083 billion, despite 12% adjusted EPS growth. On adjusted net income attributable to shareholders, cash conversion was approximately 83%, compared with approximately 90% a year earlier. The earnings improvement has not yet translated proportionately into cash.
Management attributed the shortfall to inventory and sales timing and expects reversal in Q4. The filing showed year-to-date cash absorption of approximately $557 million from receivables and $344 million from inventories, partly offset by $315 million from payables. Higher sales, acquisition activity, and production changes can influence these balances, but the inventory increase warrants scrutiny during a period of site consolidation and weak consumer electronics.
Achieving $4.8 billion of annual adjusted free cash flow requires approximately $1.714 billion in Q4, compared with approximately $1.291 billion in Q4 2025. The required approximately 33% increase makes working-capital release an important execution dependency.
The longer comparison is also relevant. The 2026 adjusted free-cash-flow target is slightly below the approximately $4.877 billion generated in 2024, while the revised adjusted EPS midpoint is approximately 22% above recast 2024 EPS. This does not invalidate the earnings turnaround, but it demonstrates that higher adjusted earnings have not yet produced a proportionately higher cash-flow base.
CAPITAL ALLOCATION AND LEGAL EXPOSURE
3M returned approximately $4.4 billion to shareholders during the first 9 months, including approximately $3.2 billion of repurchases and $1.2 billion of dividends. That exceeded adjusted free cash flow by approximately $1.4 billion and actual operating cash flow less capital expenditure by approximately $3.1 billion.
The difference does not imply that repurchases alone caused the increase in borrowing, because acquisition funding, partner contributions, asset transactions, and other cash flows also affected the balance sheet. It does establish that shareholder distributions were not fully funded by cash remaining after current-period operating, capital, and legacy payments.
Gross debt increased to approximately $15.0 billion from $12.6 billion at year-end 2025. Cash and current marketable securities totaled approximately $5.1 billion, producing approximately $9.9 billion of net debt on that definition, versus approximately $6.7 billion previously. The retained Solventum investment, valued at approximately $2.3 billion, provides an additional asset but is not equivalent to cash.
Repurchases slowed sharply to approximately $200 million in Q3 from approximately $3.0 billion in H1. That could reflect timing, valuation, or competing capital requirements. It also means that the unusually strong H1 repurchase pace should not be extrapolated automatically into 2027.
Management highlighted approximately $9.3 billion returned to shareholders since the beginning of 2025 versus a $10 billion Investor Day target. Exceeding that target now requires only approximately $700 million of additional distributions. The milestone is therefore not evidence of a newly aggressive capital-return commitment.
Legal risk remains central to equity valuation. The filing reported approximately $7.5 billion of PFAS-related environmental liabilities and approximately $1.1 billion of Combat Arms Earplugs liabilities at September 30. Approximately $3.4 billion of those combined categories was classified as current. These figures do not encompass every potential legal exposure.
The AFFF personal-injury mediation is a potentially important catalyst, but no settlement amount or timing was disclosed. The filing described substantial claims vetting and dismissals without prejudice. Such dismissals should not be equated with final extinguishment of claims.
A settlement could reduce the valuation discount by narrowing the range of possible outcomes, even while requiring additional cash. Conversely, a larger-than-expected settlement could reduce buyback capacity and increase leverage. Inability to estimate an additional loss range is not evidence that the incremental exposure is immaterial.
At the September share count, each additional $1 billion of net present-value equity cost is approximately $1.94 per share. This provides a useful sensitivity, although legal developments can also affect the valuation multiple by changing perceived tail risk.
A coherent valuation must either deduct the present value of excluded obligations from a normalized operating valuation or include the cash payments in an equity cash-flow model. Applying both treatments would double count the burden. Applying neither would overstate value.
INVESTMENT SCENARIOS AND VALUATION
At the supplied $169.81 reference price and approximately 516.7 million period-end shares, equity value was approximately $87.7 billion. The revised $9.125 EPS midpoint implies approximately 18.6 times 2026 adjusted earnings. The $4.8 billion adjusted free-cash-flow target implies approximately a 5.5% adjusted cash-flow yield, before the excluded cash obligations discussed above.
The following scenarios are analytical assumptions, not management guidance or consensus forecasts. Their purpose is to distinguish operating improvement from speculative commercialization and valuation expansion.
The base case, assigned a 55% probability, assumes approximately 4% organic growth in 2027, operating margin around 25.6%, modest share-count reduction, and EBO revenue within the disclosed $80 million to $100 million range. Consumer electronics stabilizes without a sharp recovery, Safety and Industrial remains the principal earnings driver, and no material unexpected legal deterioration occurs. Adjusted EPS of approximately $10.10 and an 18.5-times multiple imply approximately $187 per share, or approximately 10% price appreciation from the reference.
The bull case, assigned a 25% probability, assumes approximately 5% to 6% organic growth, operating margin around 26.2% to 26.6%, stronger consumer-electronics recovery, continued industrial execution, and additional hyperscaler validation that raises confidence in the 2028 opportunity. Adjusted EPS of approximately $10.80 and a 20.5-times multiple imply approximately $221 per share, or approximately 30% appreciation. The higher multiple requires evidence that faster growth is durable and not primarily inflation-driven.
The bear case, assigned a 20% probability, assumes approximately 0% to 1% organic growth, operating margin around 23.5% to 24.3%, weaker backlog conversion, persistent consumer-electronics pressure, and disappointing cash conversion. An EBO delay or adverse legal development would reinforce valuation pressure. Adjusted EPS of approximately $9.00 and a 14.5-times multiple imply approximately $131 per share, or approximately 23% downside.
These illustrative scenarios produce a probability-weighted value of approximately $184, around 8.5% above the reference price. Maintaining the current $0.78 quarterly dividend would add approximately 1.8% annual income yield. The resulting approximately 10% expected total-return framework is constructive, but not sufficiently asymmetric to justify aggressive concentration given the legal and execution risks.
The most attractive valuation outcome does not require treating 3M as a pure-play AI infrastructure supplier. A sustained approximately 4% organic-growth rate, margin expansion above 25.4%, and improving cash conversion can support a sound industrial compounder thesis. A materially higher multiple requires evidence that innovation has durably changed the company’s growth profile and that legacy liabilities are becoming more predictable.
RECOMMENDATION, CATALYSTS, AND RISK PARAMETERS
Maintaining a modest existing long position is supported by the quarter. Aggressively adding at the event-time reference price solely because of the Amazon announcement is not supported. The fundamental earnings improvement is real, but the comparable guidance increase is modest and the commercial agreement does not guarantee the headline revenue milestone.
A prospective accumulation range of approximately $155 to $160 would improve the expected-return profile, assuming the operating thesis remains intact. At those levels, the shares would trade at approximately 15.3 to 15.8 times the illustrative base-case 2027 EPS. The relevant holding period is approximately 12 to 18 months for operating execution and guidance delivery, with the more material EBO commercialization opportunity extending into 2028.
An initial exposure of approximately 0.5% to 1.0% of portfolio net asset value, capped around 1.5% before stronger cash-conversion and legal visibility, would be consistent with the identified uncertainty. A 15% position-loss limit would imply approximately 15 to 23 basis points of portfolio loss at 1.0% to 1.5% sizing, before gap risk. Actual sizing remains dependent on portfolio composition, liquidity constraints, and existing factor exposure.
The position would add industrial-cycle, manufacturing-productivity, pricing, and U.S. capital-spending exposure. Its growing data-center contribution may increase correlation with AI infrastructure holdings rather than provide a wholly independent source of return. PFAS and other legal exposures introduce idiosyncratic downside that cannot be assumed to diversify normal market risk.
The next major catalyst is the January 2027 earnings release and formal outlook. Confirmation of organic growth near 4%, operating margin above 25.4%, and a credible cash-flow bridge would support the base case. A weaker revenue assumption, larger reinvestment requirement, or less favorable non-operating bridge would reduce the expected EPS upside.
Q4 adjusted free cash flow near the approximately $1.7 billion implied requirement is the most immediate operating validation point. Failure to deliver the expected working-capital reversal, particularly alongside further inventory accumulation, would weaken the claim that current cash conversion is primarily timing-related.
During 2027, EBO milestones should include qualified GSEO production, shipment conversion, additional hyperscaler deployments, and delivery against the $80 million to $100 million revenue expectation. Further partnership announcements without corresponding production and revenue evidence would not justify equivalent increases in valuation.
Thesis-review triggers include sustained organic growth below approximately 3%, deterioration in Safety and Industrial orders or margins, a 2027 margin outlook that does not exceed 25.4%, repeated cash-flow misses, material legal costs beyond the assumed valuation burden, or an EBO ramp delayed beyond the disclosed timetable.
Exit or reduction criteria should include a break in the operating thesis, breach of the position-loss budget, or appreciation into approximately $185 to $195 without a corresponding increase in sustainable earnings expectations. A move into that range would realize much of the base-case value and require reassessment rather than automatic capitalization of the bull case.
The central conclusion is that Q3 increased confidence in 3M’s operating capabilities more than it increased near-term intrinsic value. Productivity, commercial execution, and innovation indicators are improving. The unresolved issue is whether those improvements will translate into sustained cash available to shareholders after investment, financing, minority interests, and legacy liabilities. Amazon enhances the longer-term opportunity, but the investment case over the next 12 to 18 months remains primarily an industrial execution and cash-conversion thesis.
COMPANY EMPLOYEES ON THE CALL
• Bill Brown, Chairman and Chief Executive Officer. • Anurag Maheshwari, Executive Vice President and Chief Financial Officer. • Chinmay Trivedi, Senior Vice President, Investor Relations and Financial Planning & Analysis.
RESEARCH ANALYSTS ON THE CALL
• Scott Davis, Melius Research. • Amit Mehrotra, UBS. • Joseph O’Dea, Vertical Research Partners. • Julian Mitchell, JPMorgan. • Andrew Obin, Bank of America. • Joe Ritchie, Goldman Sachs. • Nigel Coe, Wolfe Research. • Stephen Tusa, Wells Fargo. • Andrew Kaplowitz, Citi Research. • Varun Govindaraj, Bernstein. • Brandon Knutson, Morgan Stanley. • Nicole DeBlase, Deutsche Bank. • Brett Linzey, Mizuho Securities. • Jeff Reive, RBC Capital Markets.
Key Read-Throughs
KEY READ-THROUGHS FROM 3M’S Q3 2026 EARNINGS CALL
3M’s October 20 earnings call supports a selective industrial and AI-infrastructure expansion, not a synchronized recovery across manufacturing and consumer markets. The strongest positive signals concern optical-connectivity commercialization, electrical infrastructure, U.S. industrial consumables, and Indian demand. The clearest negatives concern LCD-related electronics, collision-repair activity, and consumer-product suppliers dependent on retailer replenishment. The critical distinction is between company-specific execution and underlying market growth: 3M’s innovation, pricing, and customer wins are allowing selected businesses to outperform weak end markets. Its results therefore cannot be transferred mechanically to competitors. Similarly, Amazon’s $6 billion warrant milestone validates a commercial opportunity but does not establish committed spending. Impact assessments below describe business and valuation relevance, not predicted share-price changes. Country labels identify the markets associated with the quoted tickers.
OPTICAL CONNECTIVITY AND PRECISION MANUFACTURING
GSEO IS THE MOST DIRECT EXTERNAL BENEFICIARY, BUT ITS ECONOMICS ARE NOT EQUIVALENT TO 3M’S SALES OPPORTUNITY (READ-THROUGH 1)
Affected company: Genius Electronic Optical (3406: Taiwan). Direction: Positive. Magnitude: High strategic relevance; limited immediate earnings contribution, with potentially material longer-duration diversification.
The supporting evidence is unusually direct. 3M announced a contract-manufacturing agreement with GSEO and an approximately 4.7% strategic equity investment. Brown stated that internal EBO capacity would exceed approximately 10 million ferrules annually, while GSEO could potentially manufacture multiples of that quantity per month. Management expects EBO revenue of approximately $40 million in 2026 and $80 million to $100 million in 2027, with the Amazon relationship becoming more meaningful in 2028.
The transmission mechanism is the transfer of precision-optics manufacturing capabilities into AI connectivity. GSEO gains a named commercial partner, access to 3M’s proprietary ferrule technology, and a route into hyperscaler infrastructure that is distinct from its premium consumer-device component business. Successful qualification could diversify revenue, improve the durability of its customer relationships, and support a broader valuation framework than dependence on consumer-device product cycles alone.
The important limitation is value capture. 3M’s EBO revenue is not GSEO’s manufacturing revenue, and the $6 billion Amazon milestone includes products beyond EBO. GSEO’s actual opportunity depends on its manufacturing allocation, unit pricing, yields, utilization, capital requirements, and the economics retained by 3M and other ecosystem participants. None was sufficiently quantified to support a defensible EPS uplift.
Near-term catalysts are completion of the equity investment, which the October 19 announcement expected in Q4 subject to closing conditions, and manufacturing qualification during Q4 and early 2027. The larger fundamental shift requires commercial shipments and sustained utilization during 2027 and 2028. This is a direct supplier relationship, but not evidence that GSEO already holds a guaranteed multiyear production backlog.
OPEN STANDARDS IMPROVE THE POSITION OF ADAPTABLE CONNECTOR INCUMBENTS (READ-THROUGH 2)
Affected companies: Amphenol (APH: U.S.) and TE Connectivity (TEL: U.S.). Direction: Positive for optical-connectivity positioning. Magnitude: Modest near-term consolidated impact; potentially moderate longer-term relevance within high-speed connectivity.
3M reported that EBO Multi-Source Agreement membership increased from 17 to 63. Its original coalition announcement identified both Amphenol and TE Connectivity as participants. Brown also explained that 3M manufactures the ferrule, while other participants terminate fibers, assemble connectors, and integrate those products into data-center systems. The opportunity therefore extends beyond the proprietary component itself.
The transmission mechanism is an expanding market for qualified optical cable assemblies, connectors, and system-level integration. Standardization can reduce customer qualification friction and encourage adoption across multiple equipment architectures. Existing connectivity suppliers possess manufacturing expertise, customer access, and integration capabilities that can remain valuable as the underlying connector technology changes.
The non-consensus implication is that EBO adoption does not justify a blanket negative view on established connector manufacturers. Participation in the emerging standard gives Amphenol and TE a route to adapt their portfolios rather than simply lose legacy physical-contact connector content. Conversely, MSA membership does not establish a specific Amazon award, exclusive supply position, or incremental revenue allocation.
Near-term catalysts are qualified product introductions and customer design wins. The fundamental benefit is more likely to emerge during 2027 and beyond as optical deployment broadens. The call does not justify transferring its EBO market estimate to every optical component supplier, nor does it establish the timing of displacement of short-reach copper connections. Product mix and architectural participation matter more than generic exposure to the optics theme.
HYPERSCALE CLOUD PLATFORMS
HYPERSCALERS GAIN DEPLOYMENT OPTIONALITY WITHOUT A DISCLOSED PURCHASE GUARANTEE (READ-THROUGH 3)
Affected companies: Amazon (AMZN: U.S.) and Microsoft (MSFT: U.S.). Direction: Positive operationally. Magnitude: Potentially meaningful at the infrastructure-deployment level, but negligible identifiable near-term consolidated EPS impact.
The call confirmed the previously announced Microsoft deployment and the expanded Amazon relationship. Brown described EBO’s advantages in installation, durability, density, and difficult-to-access optical backplanes. The most consequential commercial clarification was: “There is no volume commitments here.”
For hyperscalers, the transmission mechanism is lower deployment and maintenance friction. Dense optical infrastructure creates substantial cleaning, inspection, handling, and serviceability requirements. A connector architecture that reduces those requirements can shorten installation schedules and improve access to equipment after deployment. Where expensive compute infrastructure is awaiting connectivity or maintenance, improvements in installation reliability can have value beyond the component’s purchase price.
Amazon also receives contingent equity participation while retaining purchasing flexibility. The October 19 filing specifies a warrant for approximately 3.16 million shares, with 85% vesting linked to customer payments and the balance linked to event-based milestones. This aligns incentives without establishing that Amazon has underwritten 3M’s capacity investment.
The positive read-through is therefore operational optionality and procurement leverage, not a quantifiable cloud-margin increase. The negative implication for supplier-side expectations is equally important: the announcement should not be treated as a new, binding $6 billion addition to Amazon’s infrastructure spending commitments.
Near-term trading relevance is limited because the agreement is small relative to either hyperscaler’s consolidated operations. The longer-duration benefit depends on reliable deployment at scale. It is supportive of infrastructure efficiency, but not evidence of a change in either company’s aggregate capex budget or AI monetization trajectory.
ELECTRICAL EQUIPMENT AND DATA-CENTER POWER
POWER CONNECTIONS OFFER A MORE IMMEDIATE READ-THROUGH THAN THE OPTICAL HEADLINE (READ-THROUGH 4)
Affected companies: Hubbell (HUBB: U.S.) and Eaton (ETN: U.S.). Direction: Positive. Magnitude: Moderate for relevant electrical businesses; more immediately relevant than the prospective EBO ramp.
3M expects approximately $700 million of data-center revenue in 2026 versus approximately $550 million in 2025, implying roughly 27% growth. Brown emphasized that most of this exposure is outside the data center rather than inside the rack. Electrical Markets continued to grow at a double-digit rate, including medium-voltage connections, and management expects that strength to continue into 2027.
The transmission mechanism is physical electrical infrastructure demand. Additional data-center capacity requires power connections, protection, distribution, and associated equipment regardless of which optical architecture ultimately wins. Hubbell’s connector and electrical-infrastructure exposure and Eaton’s power-distribution and switchgear exposure address this same spending chain.
The distinction is substantial. EBO accounts for only approximately 6% of 3M’s expected 2026 data-center revenue. The stronger near-term earnings corroboration is therefore for electrical infrastructure already being purchased and installed, not solely for a technology expected to become materially larger after 2027.
For Hubbell, the signal is particularly relevant to connection and electrical-infrastructure products. For Eaton, it supports the persistence of demand surrounding facility power distribution. These are shared-end-market read-throughs, not evidence that either company receives orders from 3M or captures a specified share of its customers’ projects.
Near-term catalysts are upcoming orders, backlog-conversion commentary, and 2027 outlooks. The fundamental support extends through 2027, subject to utility interconnection schedules, project delays, and manufacturing capacity. The call reinforces existing demand visibility; it does not independently establish a new acceleration in industry-wide data-center spending.
U.S. INDUSTRIAL DISTRIBUTION
INDUSTRIAL CONSUMABLES ARE IMPROVING, BUT NOMINAL GROWTH OVERSTATES THE VOLUME SIGNAL (READ-THROUGH 5)
Affected companies: Fastenal (FAST: U.S.) and W.W. Grainger (GWW: U.S.). Direction: Positive. Magnitude: Moderate operating corroboration, with a stronger connection to manufacturing consumables than to discretionary capital equipment.
3M reported approximately 7% growth in the U.S. and Canada, double-digit U.S. industrial growth, and high-single-digit growth across safety, adhesives, abrasives, and industrial specialties collectively. Quarterly orders increased approximately 7%, while backlog entering Q4 increased approximately 18%. These categories overlap with the recurring production, maintenance, and safety purchases served by industrial distributors.
The transmission mechanism is increased replenishment of products consumed in manufacturing and maintenance, combined with higher selling prices. Stronger throughput increases consumption of abrasives, adhesives, protective equipment, and related supplies. Better product availability can also improve distributor service levels and order fulfillment.
The qualification is pricing. Management expects slightly more than 2 percentage points of price contribution in H2. Organic revenue growth therefore should not be interpreted as equivalent unit growth. For distributors, supplier price increases can support nominal sales and gross-profit dollars if passed through, but can also increase inventory investment and create timing pressure on gross margins.
The actionable conclusion is greater confidence in recurring industrial demand, not confirmation of an indiscriminate manufacturing boom. Fastenal’s manufacturing exposure offers a relatively direct demand connection. Grainger benefits through a broader maintenance and repair portfolio, making the company-wide read-through somewhat less concentrated.
Near-term relevance lies in monthly sales trends, customer purchasing activity, and Q4 updates. The longer-duration question is whether volumes remain positive after inflation-related pricing moderates. 3M’s approximately 40% incremental-margin commentary should not be transferred to distributors, whose economics and working-capital requirements differ materially.
INDIA OFFERS A DIRECT LISTED EXPOSURE TO THE GEOGRAPHIC DIVERGENCE (READ-THROUGH 6)
Affected company: 3M India (3MINDIA: India). Direction: Positive. Magnitude: Moderate operating relevance, without an independently established valuation or EPS upgrade.
Management reported another double-digit quarter in India, supported by increased penetration in automotive, industrial applications, and a growing consumer market. This contrasted with a high-single-digit decline in China and only modest growth in Europe and other Asian markets.
The transmission mechanism is direct operating exposure through 3M’s listed, majority-owned Indian subsidiary. Greater penetration of industrial and automotive applications can increase local demand for materials, adhesives, safety products, and related solutions. The parent’s technology portfolio and commercial capabilities provide a more specific connection than a generalized positive view on Indian industrial equities.
The differentiation matters across portfolios. The call does not support treating Asia as a homogeneous demand region. India’s industrial and consumer expansion is occurring alongside weakness in China-linked consumer electronics. Geographic diversification can therefore improve earnings resilience even within a common technology and materials platform.
The limitation is reporting scope. Parent-company country commentary is not a complete financial disclosure for the listed subsidiary. Double-digit growth in the parent’s Indian activity should not automatically be copied into 3M India’s reported revenue or earnings forecast. Currency, product mix, intercompany charges, and the precise perimeter of operations can alter the result.
Near-term confirmation should come from the subsidiary’s next results and segment disclosures. The longer-duration opportunity is continued penetration of industrial and automotive applications. No allocation of Amazon-related EBO manufacturing or revenue to 3M India was disclosed.
CONSUMER ELECTRONICS AND DISPLAYS
LCD-RELATED DEMAND IS WEAKENING EVEN AS AI INFRASTRUCTURE ACCELERATES (READ-THROUGH 7)
Affected companies: Innolux (3481: Taiwan) and AUO (2409: Taiwan). Direction: Negative for consumer-display exposure. Magnitude: Moderate at the exposed business level, with company-wide sensitivity dependent on diversification and panel pricing.
3M’s consumer-electronics business declined in the mid-teens, and management expects continued pressure in Q4. Brown identified LCD displays and Chinese OEMs as the principal weak areas. China declined in the high-single digits overall, largely because of consumer-electronics weakness.
The transmission mechanism is reduced demand for materials incorporated into display production. Weakness in optical films and related display materials is an adverse signal for downstream production schedules and inventory absorption. If panel manufacturers face weaker order conversion, lower utilization can pressure fixed-cost absorption. If supply is not reduced sufficiently, pricing pressure can compound the volume effect.
This is not evidence that Innolux or AUO will experience the same percentage decline as 3M’s consumer-electronics business. Product mix, customer exposure, inventory timing, and 3M-specific content changes differ. Nevertheless, the direction is a credible negative signal for conventional consumer-display demand.
The distinction between mature display exposure and premium-device content is important. Management said approximately 70% of its consumer-electronics business serves premium manufacturers and highlighted better performance in thermal management, foldable devices, and other differentiated applications. The call therefore does not support a blanket negative conclusion for all semiconductor or smartphone suppliers.
Near-term catalysts are panel shipment data, pricing developments, and upcoming outlooks. The longer-duration issue is whether differentiated applications can offset weakness in mature LCD-related demand. AUO’s broader application mix can temper consolidated sensitivity, but it does not eliminate exposure to consumer-display utilization.
CONSUMER PRODUCTS AND RETAIL CHANNELS
POS IMPROVEMENT DOES NOT ESTABLISH A WHOLESALE RESTOCKING CYCLE (READ-THROUGH 8)
Affected company: Newell Brands (NWL: U.S.). Direction: Negative for restocking-driven earnings upside. Magnitude: Moderate risk to wholesale-sales assumptions, not evidence of an inevitable guidance miss.
3M’s U.S. consumer point-of-sale growth exceeded 2%, but its U.S. sell-in declined in the low-single digits. Selected retailers reduced inventory by approximately 0.5 week in Q2 and another 0.5 week in Q3. Brown acknowledged: “Of course, we thought Q3 was going to be positive. It didn’t happen.”
The transmission mechanism is the difference between consumer purchases and retailer orders. A branded-products manufacturer can experience improving end-demand while shipments remain weak if retailers lower inventory targets. For Newell, whose products include writing instruments, household goods, and other retail-distributed categories, this is a relevant warning against assuming that positive sell-through will immediately produce accelerated wholesale growth.
The distinction also affects cash flow. Lower retailer inventories can improve retailers’ working capital while transferring adjustment pressure to suppliers through smaller orders, production changes, and potentially slower inventory absorption. A supplier’s revenue recovery may therefore lag the apparent improvement in consumer demand.
Newell’s own Q2 disclosure identified tight retailer inventory control as an operating issue, providing independent corroboration of the mechanism. Its 2.3% Q2 core-sales growth also demonstrates that innovation and execution can offset that pressure. The 3M signal is consequently negative for assumptions of automatic channel replenishment, not a contradiction of Newell’s company-specific turnaround.
The near-term catalyst is Newell’s scheduled October 30 results and its distinction between sell-through, shipments, and retailer inventories. The longer-duration risk is that lower channel inventory becomes structural rather than temporary. The retailers responsible for 3M’s reductions were not identified, so the call does not justify attributing the behavior to a particular listed retailer.
AUTOMOTIVE AFTERMARKET AND REFINISH
3M’S AFTERMARKET GROWTH DOES NOT SIGNAL A RECOVERY IN COLLISION REPAIR (READ-THROUGH 9)
Affected companies: LKQ (LKQ: U.S.) and Axalta Coating Systems (AXTA: U.S.). Direction: Negative for underlying collision-repair demand. Magnitude: Moderate for LKQ’s North American collision exposure and low to moderate for Axalta’s consolidated earnings, subject to pricing and share gains.
3M’s automotive-aftermarket business grew in the mid-single digits, but management explicitly attributed the improvement to new products and wins with large multi-shop operators while stating that the repair-claims market remained soft. This is a clear case in which supplier growth should not be mistaken for end-market recovery.
For LKQ, the transmission mechanism is the number of repairable collision events and the resulting demand for replacement parts. Persistent claims weakness can constrain parts volumes and distribution-network utilization. Alternative-parts penetration and commercial execution can offset some pressure, but those are separate drivers from repair-market growth.
For Axalta, fewer repair jobs reduce underlying refinish-coatings consumption. Pricing, premium systems, distribution execution, and customer wins can protect revenue and profit, but 3M’s aftermarket growth does not independently establish better industry paint volumes.
The non-consensus implication is that customer consolidation can produce stronger results for selected suppliers without improving the overall market. Winning a large multi-shop operator can increase a supplier’s sales through account penetration, product adoption, and procurement share. It does not increase the number of vehicles requiring repair. The call also does not establish that either LKQ or Axalta lost the accounts won by 3M.
Near-term relevance is strongest around upcoming quarterly results, including LKQ’s scheduled October 29 report, and commentary on claims, repair volumes, and customer activity. The longer-duration distinction is between companies able to win share in a weak market and those requiring an industry-volume recovery to meet expectations.
SPECIALTY CHEMICALS AND ENVIRONMENTAL LIABILITIES
PFAS REMAINS A CLAIM ON CASH, EVEN WHEN EXCLUDED FROM ADJUSTED EARNINGS (READ-THROUGH 10)
Affected companies: Chemours (CC: U.S.) and DuPont (DD: U.S.). Direction: Negative for valuation approaches that disregard legacy liabilities. Magnitude: Potentially material for equity value and capital allocation; no defensible immediate peer EPS adjustment follows from this call.
Brown stated that 3M is actively working with a court-appointed mediator on AFFF personal-injury claims. No settlement amount or completion date was disclosed. The accompanying financial reconciliation also showed the economic importance of excluded payments: Q3 adjusted free cash flow was approximately $1.2 billion, but operating cash flow less capital expenditure was only approximately $230 million. The difference was dominated by litigation and PFAS-exit cash adjustments.
The transmission mechanism for other exposed chemical companies is valuation and financing capacity, not an automatic reduction in operating demand. Legacy payments compete with debt repayment, dividends, acquisitions, and reinvestment. Excluding them from adjusted EPS does not remove their impact on equity cash flows or financial flexibility.
The relevance to Chemours and DuPont is established by their own PFAS-related obligations. Their September North Carolina announcement described a $455 million settlement payable over 15 years and continued to identify personal-injury and other unresolved claims as risks. This illustrates why the scope of releases, payment schedules, cost-sharing arrangements, and counterparties’ ability to perform matter more than a generic declaration that PFAS has been “settled.”
The high-conviction negative read-through is to an undifferentiated clean-balance-sheet re-rating. The call does not establish that either peer’s ultimate liability has increased, that its exposure matches 3M’s, or that a future 3M settlement would determine its legal outcome. Those would be unsupported extrapolations.
Near-term catalysts are unscheduled mediation, settlement, and litigation developments. Over a longer horizon, a sufficiently comprehensive settlement can be positive by reducing uncertainty even while requiring cash. Until the scope and economics are known, normalized earnings should be valued alongside the relevant legacy obligations rather than in isolation.
SOURCE LIMITATIONS
Several supplementary peer investor-relations pages returned 403 or 429 access errors, and an Eaton announcement request timed out. Their full contents were not verified. The conclusions above rely on the supplied call, previously retrieved 3M financial disclosures, accessible partnership and peer announcements, and clearly identified end-market inferences. No undisclosed supplier award, guaranteed customer purchase, or quantified peer earnings revision has been assumed.
Report record
- Sector
- Industrials
- Fiscal period end
- September 30, 2026
- Report date
- October 20, 2026
- Analysis
- 7799 words
- Read-throughs
- 3039 words
- Content fingerprint (PDF)
06e145b3fbed- Content fingerprint (analysis)
53195acd1f55- Content fingerprint (read-throughs)
bc587c5be971
Prepared from the company's earnings release and earnings call transcript. Figures as reported by the company. For information only. Not investment advice.
More from 3M Co
No other reports yet.
More in Industrials
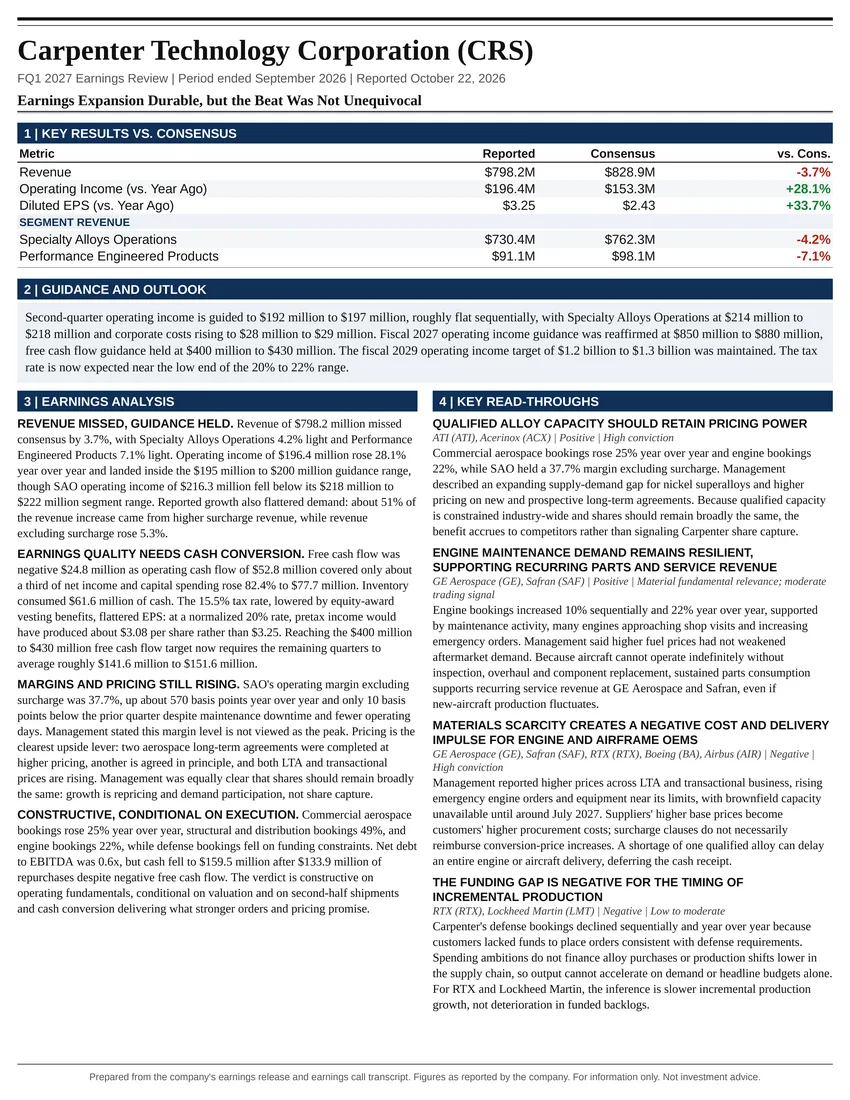
Earnings Expansion Durable, but the Beat Was Not Unequivocal
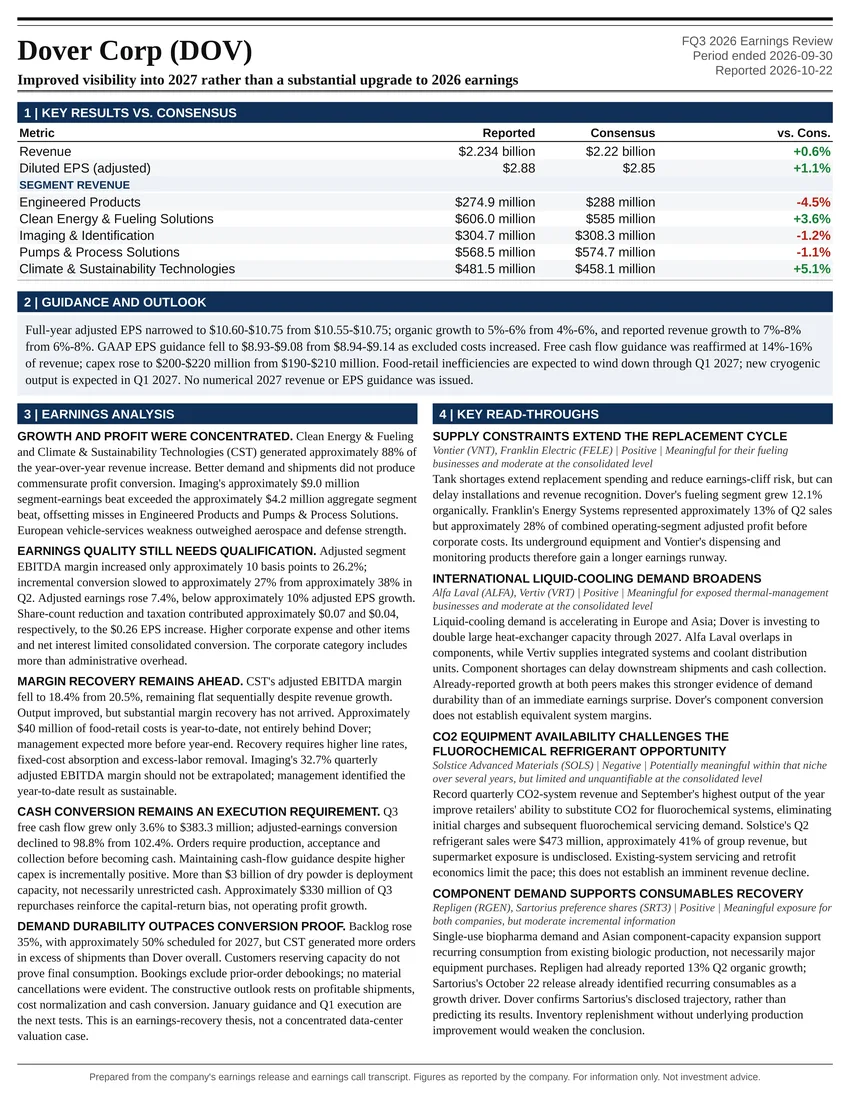
Improved visibility into 2027 rather than a substantial upgrade to 2026 earnings
Follow @AtlasPeakRes on X for new earnings reports as they publish.