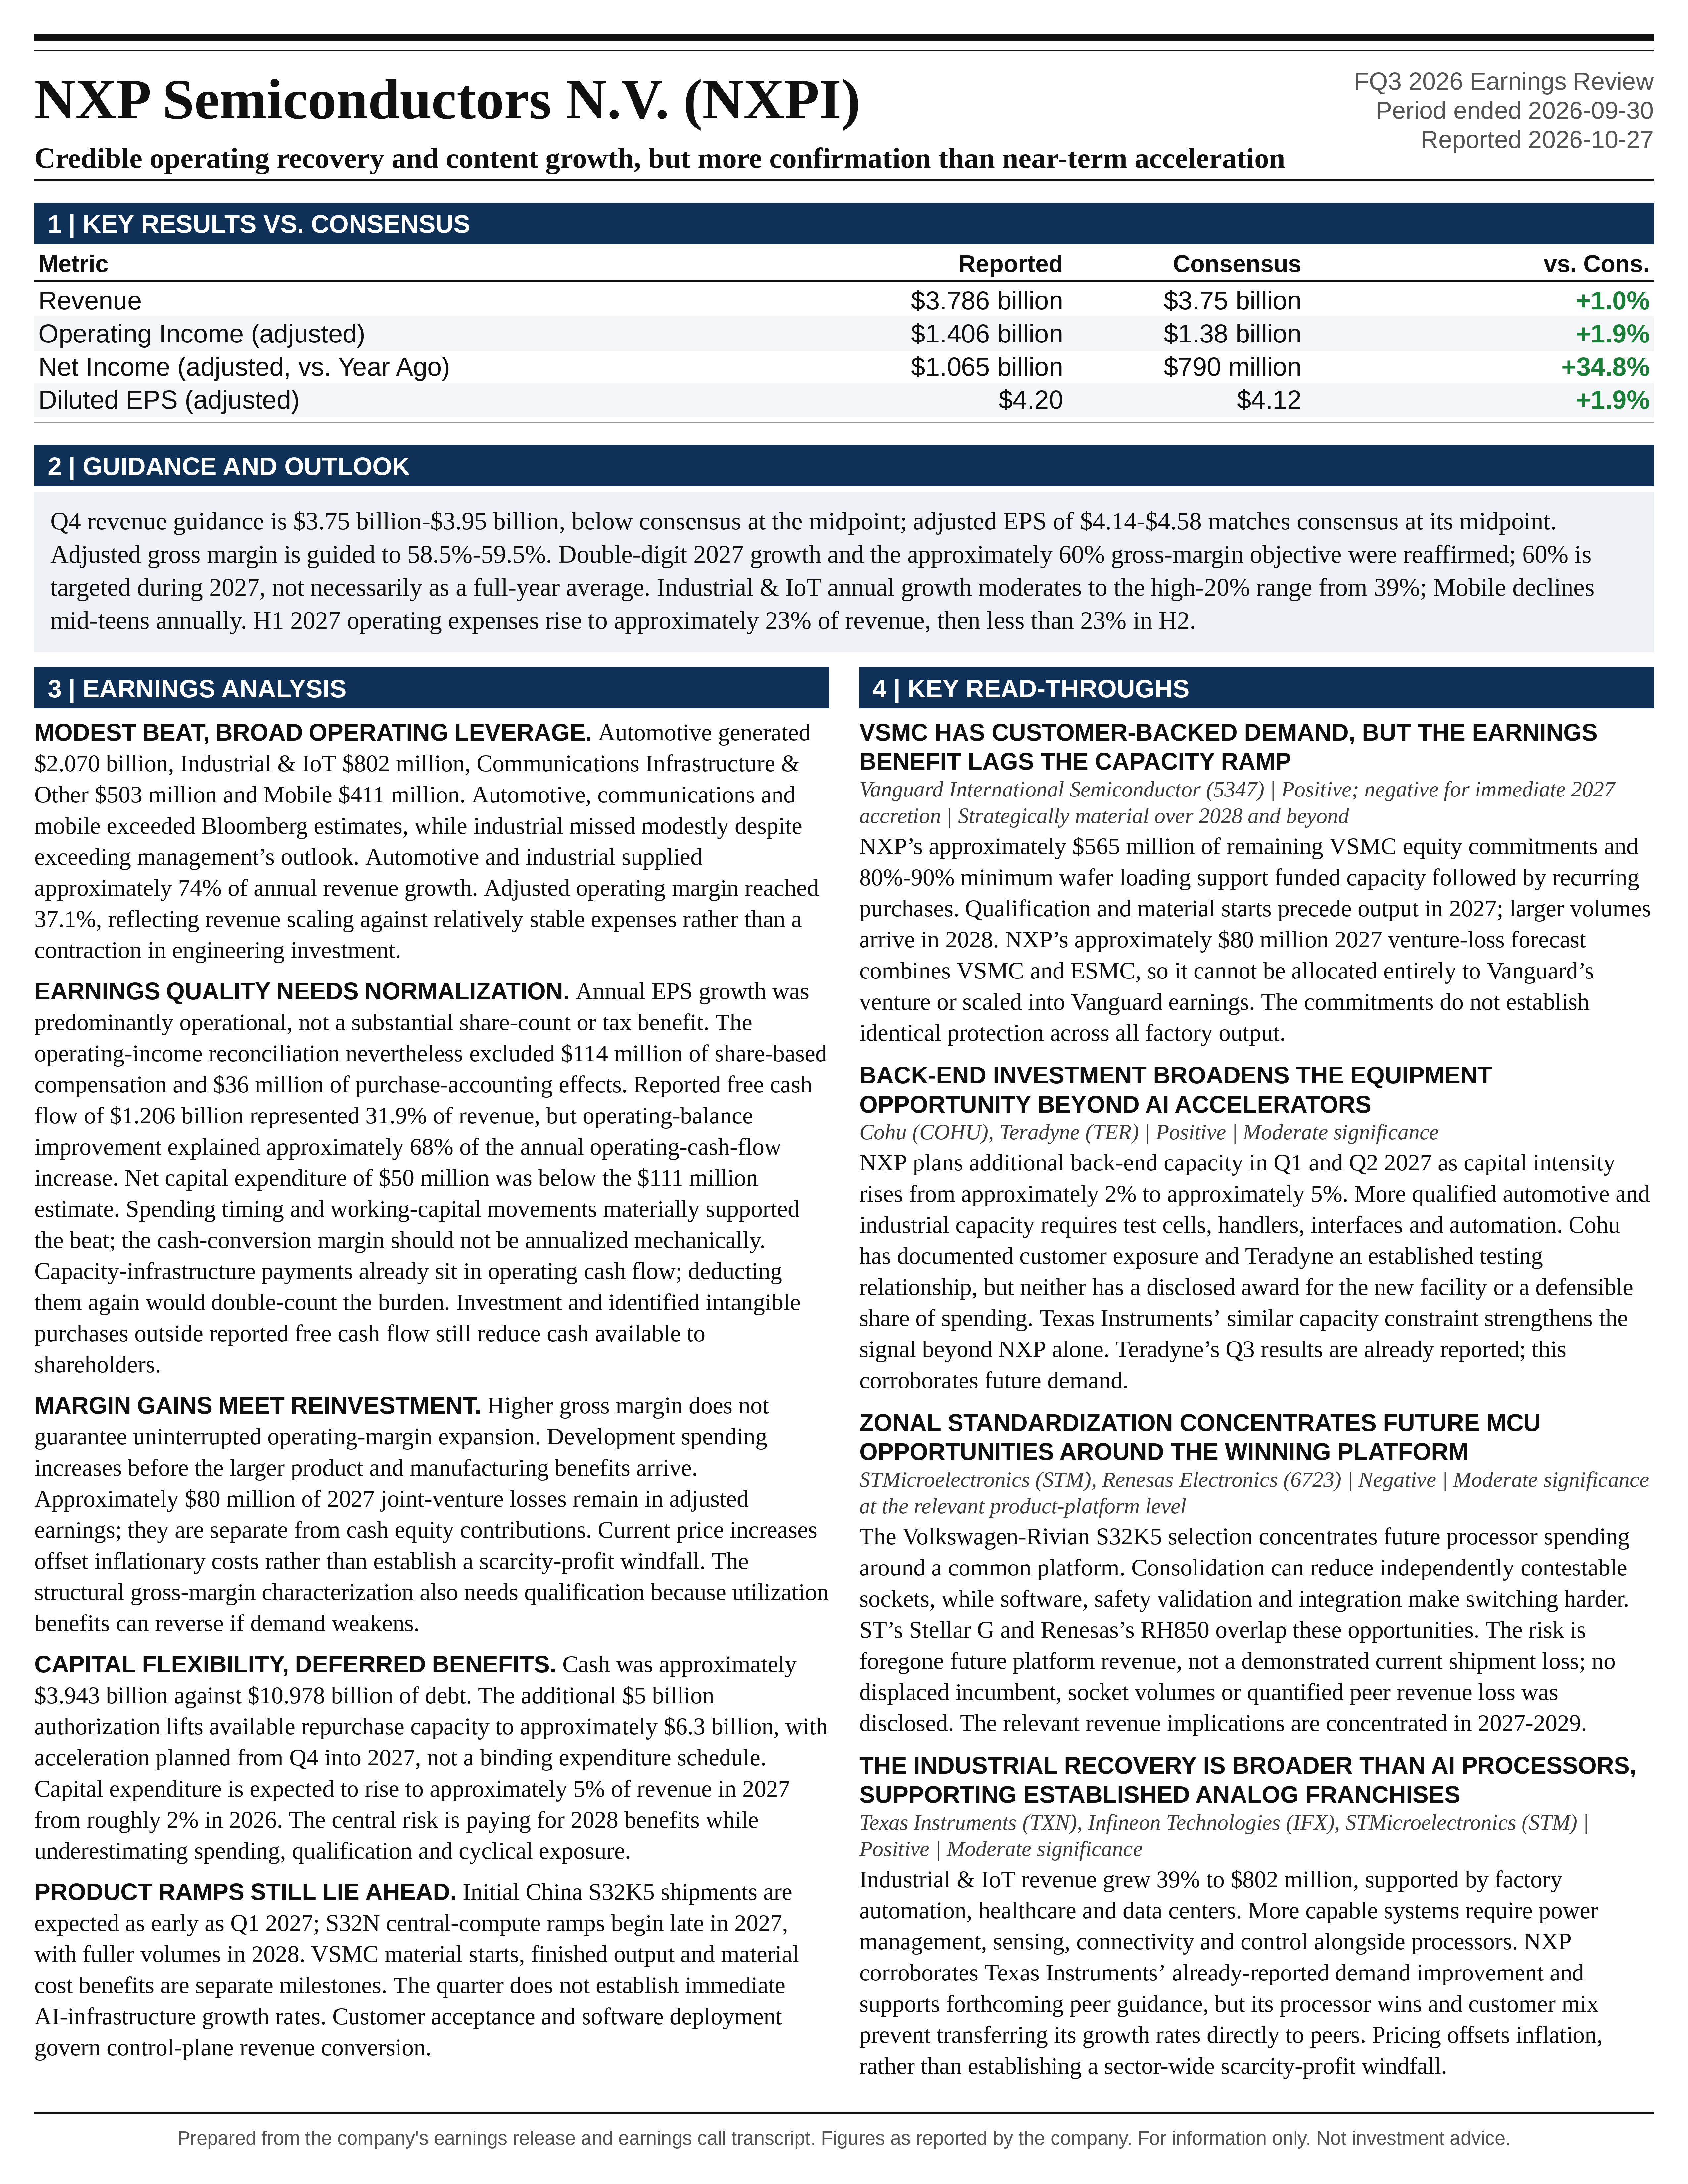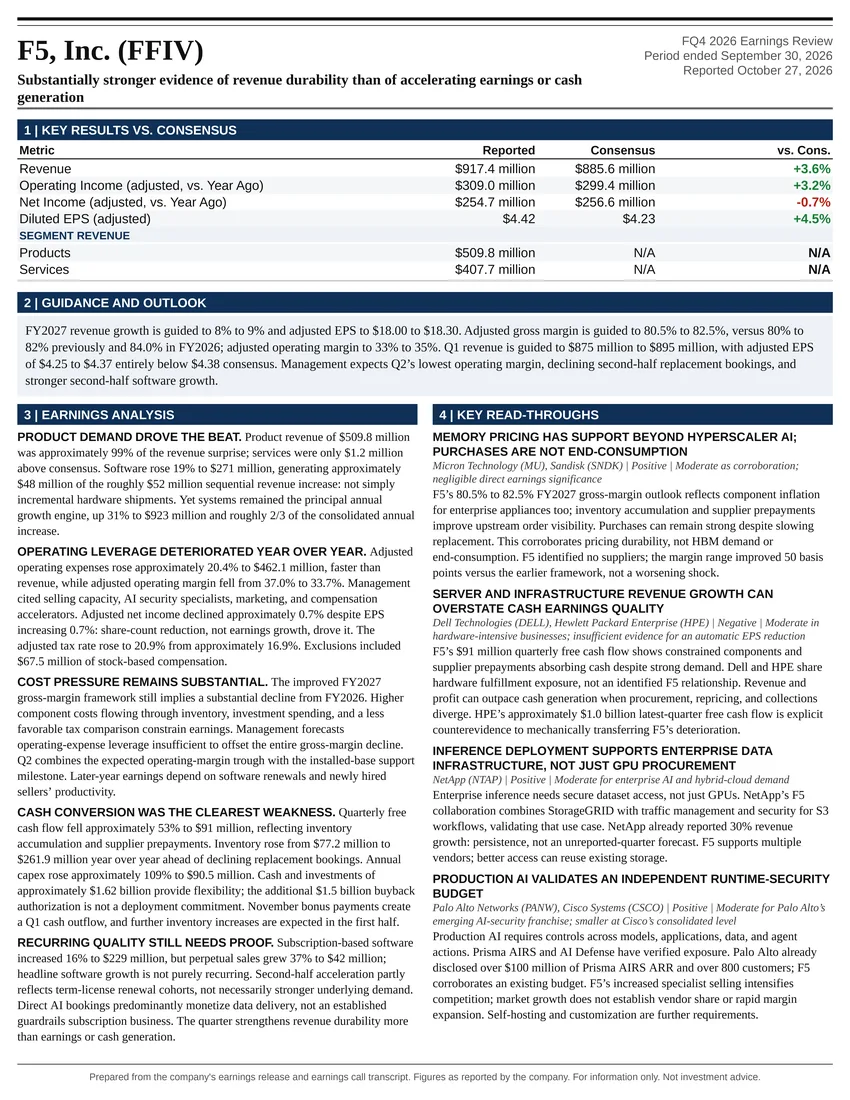
Substantially stronger evidence of revenue durability than of accelerating earnings or cash generation
Earnings Reports
NXP Semiconductors N.V. FQ3 2026 Earnings Report
NXP Semiconductors N.V. (NXPI) FQ3 2026 earnings: Credible operating recovery and content growth, but more confirmation than near-term acceleration. Full earnings analysis, key read-throughs, and the one-page exhibit from Atlas Peak Research.
NXP Semiconductors N.V. (NXPI)
Sector: Information Technology · FQ3 2026 · Period end September 30, 2026 · Reported October 27, 2026
NXP’s Q3 2026 results support a cautiously positive investment stance, with selective accumulation justified by improving automotive content, industrial demand, operating leverage, and capital-return capacity.
Download the one-page report (PDF)
View one-page exhibit
Download analysis (.md)
Download read-throughs (.md)
Post to X
One-Page Exhibit
Earnings Analysis
EXECUTIVE CALL SUMMARY: NXP Semiconductors N.V. (10/27/26)
NXP’s Q3 2026 results support a cautiously positive investment stance, with selective accumulation justified by improving automotive content, industrial demand, operating leverage, and capital-return capacity. The quarter does not, however, establish an immediate transition to AI-infrastructure growth rates or uninterrupted margin expansion. Revenue and earnings exceeded expectations modestly, while Q4 guidance was essentially in line with consensus. The principal investment issue is the timing and economic quality of the 2027-2028 growth cycle: important product ramps and manufacturing benefits remain ahead, while higher operating expenses, capital expenditures, and joint-venture losses arrive earlier.
Revenue reached $3.786 billion, increasing 19% year over year and 8% sequentially. Adjusted operating income increased 31% to $1.406 billion, adjusted operating margin reached 37.1%, and adjusted EPS increased 35% to $4.20. Automotive revenue exceeded $2 billion for the 1st time, Industrial & IoT grew 39%, and Communications Infrastructure & Other grew 54%. These results demonstrate substantial earnings leverage and increasingly diversified growth within NXP’s existing franchises. They do not eliminate cyclicality: factory utilization, inventory normalization, and recovery from depressed comparison periods remain important alongside structural content gains.
The distinction between strong absolute performance and incremental upside is critical. Detailed revenue exceeded the prior management midpoint and Bloomberg consensus by approximately $36 million, or 1%. Adjusted EPS exceeded consensus by $0.08, or 1.9%. Q4 revenue guidance of $3.85 billion was approximately 0.5% below consensus, while adjusted EPS guidance of $4.36 matched consensus. Moreover, several prominently discussed strategic targets were already established. Double-digit growth and approximately 60% gross margin in 2027 had been discussed previously, and the Q2 call already anticipated more than $500 million of 2026 data-center revenue. The most meaningful additional disclosures were the $1 billion data-center ambition for 2028, more specific product-ramp timing, detailed 2027 spending assumptions, and the additional $5 billion repurchase authorization.
The Bloomberg notice records an approximately 8%-9% after-hours decline, including a $230.34 transaction reference on only 20,099 shares. That reaction is consistent with disappointment relative to expectations for a larger forward upgrade, faster data-center expansion, or stronger near-term earnings leverage. It is not evidence that the reported operating trajectory deteriorated. Thin after-hours trading also limits the significance of that price as a settled market assessment. At the supplied $230.34 reference, valuation appears reasonable for a differentiated automotive and industrial semiconductor franchise, but an AI-infrastructure premium requires additional evidence of scale, share gains, and cash returns on investment.
QUARTERLY PERFORMANCE AND THE QUALITY OF THE EARNINGS BEAT
The detailed earnings release reports revenue of $3.786 billion, compared with $3.496 billion in Q2 2026 and $3.173 billion in Q3 2025. The sequential increase was $290 million, while the annual increase was $613 million. Automotive contributed $233 million of annual growth, Industrial & IoT contributed $223 million, and Communications Infrastructure & Other contributed $176 million. Mobile declined by $19 million. Automotive and industrial therefore generated approximately 74% of the consolidated annual revenue increase, while communications infrastructure contributed another 29%, offset partly by mobile.
Growth was broad geographically, with management reporting double-digit annual expansion in every region. That breadth reduces dependence on an isolated regional recovery. Nevertheless, geographic growth does not establish uniform end-customer strength, because shipment locations, distribution channels, and ultimate consumption can differ. Management’s statement is best interpreted as evidence of broad commercial participation rather than proof that every underlying economy or application is expanding at comparable rates.
Automotive revenue of $2.070 billion exceeded the $2.060 billion consensus estimate by approximately 0.5%. Industrial & IoT revenue of $802 million was approximately 0.5% below the $806.1 million estimate. Mobile revenue of $411 million exceeded expectations by approximately 1.2%, and Communications Infrastructure & Other revenue of $503 million exceeded expectations by approximately 2.1%. Thus, management’s statement that every end market exceeded its outlook should not be confused with a consensus beat in every category. Industrial & IoT exceeded management’s internal expectations but modestly missed the Bloomberg estimate.
The revenue improvement translated effectively into profits. Adjusted gross profit increased $407 million annually to $2.217 billion, representing approximately 66% incremental gross margin. Adjusted operating income increased $335 million, representing approximately 55% incremental operating margin. Sequential incremental gross and operating margins were approximately 65% and 61%, respectively. These conversion rates demonstrate substantial fixed-cost leverage and favorable economics on incremental sales.
Adjusted operating expenses were $810 million, compared with $794 million in Q2, while revenue increased much faster. The expense ratio declined from approximately 22.7% to 21.4%. This is a major explanation for the sequential operating-margin increase from 35.1% to 37.1%. The quarter benefited from revenue scaling against a relatively stable expense base, rather than an aggressive reduction in absolute development spending.
GAAP R&D expense increased approximately 7% annually to $615 million, although it was below the $624.5 million consensus estimate. Adjusted R&D increased from $515 million to $557 million. Development spending therefore continued to grow, but materially more slowly than revenue. This supports operating leverage without suggesting that the current earnings improvement was achieved through an outright contraction in engineering investment.
The EPS increase was predominantly operational rather than a share-count effect. Adjusted net income attributable to shareholders increased from $790 million to $1.065 billion, while diluted weighted-average shares declined only approximately 0.2%, from 254.310 million to 253.831 million. Financial expense declined modestly, and the adjusted tax rate remained approximately 18%. The absence of a substantial share-count or tax benefit strengthens the quality of the annual EPS growth.
GAAP results also improved materially. GAAP EPS increased 40% to $3.48, and GAAP operating margin increased from 28.1% to 32.4%. Nevertheless, adjusted EPS exceeded GAAP EPS by $0.72. The $178 million operating-income reconciliation included $114 million of share-based compensation and $36 million of purchase-accounting effects, alongside other adjustments. Share-based compensation remains an economic cost and a source of dilution, notwithstanding its exclusion from adjusted earnings. The results demonstrate genuine operating improvement, but adjusted profitability should not be treated as identical to distributable owner earnings.
GUIDANCE RECONCILIATION: WHAT CHANGED AND WHAT DID NOT
The Q2 earnings release guided Q3 revenue to $3.65 billion-$3.85 billion, with a $3.75 billion midpoint; adjusted gross margin to a 58.5% midpoint; adjusted operating income to $1.382 billion; and adjusted EPS to $4.11. Actual Q3 revenue exceeded the midpoint by $36 million, adjusted gross margin exceeded it by 10 basis points, adjusted operating income exceeded it by $24 million, and adjusted EPS exceeded it by $0.09. This was a clean but relatively modest beat, not a major upward discontinuity in the earnings trajectory.
Q4 revenue guidance is $3.75 billion-$3.95 billion, with a $3.85 billion midpoint. The midpoint represents approximately 2% sequential growth and 15% reported annual growth, or approximately 18% annual growth excluding the divested sensor business. The company expects its 4th consecutive quarter of double-digit annual growth. Against Bloomberg consensus of $3.87 billion, however, the revenue midpoint is $20 million lower.
Adjusted gross-margin guidance of 58.5%-59.5%, with a 59% midpoint, matches consensus. Adjusted operating income of $1.442 billion at the midpoint is approximately $8 million below consensus, while the 37.5% operating-margin midpoint is approximately 20 basis points below the 37.7% estimate. Adjusted EPS guidance of $4.14-$4.58, with a $4.36 midpoint, matches consensus. The appropriate characterization is continued operating improvement with little aggregate forward earnings surprise.
The sequential EPS bridge contains modest non-operating support. Adjusted operating income increases approximately $36 million, contributing roughly $0.12 per share after tax. Financial expense declines from $85 million to $79 million, adding approximately $0.02 per share. The tax rate declines from approximately 18% to 17.5%, adding approximately $0.03. Changes in joint-venture losses and non-controlling interests broadly offset each other. Consequently, the $0.16 sequential EPS increase should not be attributed entirely to operating-margin expansion.
The 2027 revenue and gross-margin framework is principally a reaffirmation. On the Q2 call, management reaffirmed previously discussed double-digit growth and the approximately 60% gross-margin objective. August conference commentary also referenced approximately $16 billion of 2027 revenue and 60% gross margin, subject to normal variability. The current call provides greater operational detail, but it should not be represented as introducing these ambitions for the 1st time.
There is also an important measurement distinction. The current commitment is to reach 60% gross margin “during 2027,” not necessarily to average 60% across the full year. That wording supports a progression toward the target rather than immediate achievement in Q1. It does not, by itself, prove a reduction from prior guidance, because the earlier framework was not consistently expressed as a precise full-year average.
Combining reported Q1-Q3 revenue with the Q4 midpoint produces approximately $14.313 billion of 2026 revenue. Summing quarterly adjusted EPS with the Q4 midpoint produces approximately $15.22, although annual EPS can differ slightly because quarterly weighted-average share counts vary. Growth of 10% from the implied revenue base would produce approximately $15.74 billion in 2027. Revenue of $16 billion would represent approximately 11.8% growth. These calculations indicate that management’s qualitative growth framework remains broadly consistent with the previously discussed revenue ambition.
AUTOMOTIVE: CONTENT GROWTH IS REAL, BUT RAMP TIMING MATTERS
Automotive revenue increased approximately 13% annually and 6.8% sequentially to $2.070 billion, representing 54.7% of total revenue. Excluding the sensor divestiture, annual growth was approximately 17%. The constant-perimeter comparison is the more relevant measure of the retained franchise’s performance, although it should not automatically be labeled fully organic or constant currency.
The key investment observation is that this growth occurred against management’s characterization of a broadly flat vehicle-production environment. NXP is therefore generating meaningful revenue growth through semiconductor content, product mix, and potentially market share rather than relying on a strong global vehicle-unit cycle. Automotive growth excluding sensors was also approximately 17% in Q2, indicating continuity rather than a sudden Q3 acceleration.
Software-defined vehicles are central to that divergence. Management reported SDV revenue running above $1.5 billion on an annualized basis and reiterated the $2 billion 2027 target. If the annualization refers to the quarterly revenue pace, the disclosed run rate implies more than $375 million of quarterly SDV revenue, equivalent to more than 18% of automotive revenue. That is a material existing franchise, not merely a collection of prospective design wins.
The $2 billion target should nevertheless be distinguished from an exit-rate target. If it represents recognized full-year 2027 revenue, it requires an average quarterly contribution of approximately $500 million. That is approximately 33% above the $375 million reference pace associated with a $1.5 billion annualization, although the actual required increase is lower because management said the current annualized rate exceeds $1.5 billion. The target requires continued execution across the existing portfolio and upcoming launches, not simply achievement of a higher December run rate.
Management expects zonal and centralized architectures to support 2-3 times greater NXP content per vehicle than traditional architectures. The economic rationale is credible: higher-performance real-time processors, automotive networking, security, power management, and associated system components can raise supplier content even as vehicle manufacturers consolidate electronic control units. Fewer control boxes do not necessarily imply lower semiconductor value.
The content multiplier is not a multiplier on the entire current automotive business. Adoption will be phased across platforms, regions, and vehicle generations. Some legacy content will be displaced, and the realized opportunity depends on processor selection, networking architecture, ancillary attach rates, pricing, and NXP’s share of each system. Furthermore, the SDV content multiplier and the electrification-related semiconductor-content multiplier should not be multiplied together without accounting for overlap.
The Volkswagen-Rivian announcement provides a stronger commercial validation point than generalized design-win commentary. Volkswagen’s October 26 announcement identifies S32K5 microcontrollers as core processors for zonal controllers in the architecture developed by Rivian and Volkswagen Group Technologies. These controllers connect sensors and actuators and consolidate functions such as lighting, body electronics, comfort, chassis, and safety-related control. The intended use across both companies creates potential platform leverage and software reuse.
The announcement does not establish an award for NXP’s entire automotive portfolio, guaranteed deployment across all Volkswagen production, or an S32N central-compute win at the same customer. Contract value, unit commitments, pricing, and model-level deployment volumes were not disclosed. The strategic validation is substantial, but the near-term revenue contribution remains insufficiently specified for a precise earnings forecast.
Timing is particularly important. Initial S32K5 shipments in China are now expected as early as Q1 2027. S32N central-compute ramps are expected late in 2027, with fuller volume ramps for both platforms in 2028. This supports a multiyear investment case but limits the contribution that can reasonably be assigned to the newest products in early 2027. Initial shipments, customer qualification, vehicle production, and broad platform deployment are distinct commercial milestones.
The announced S32K5 design win in humanoid robotics extends the architecture beyond vehicles and supports the portability of NXP’s safety, real-time-control, and connectivity capabilities. The customer was not identified beyond being a leading US technology company, and no production schedule or revenue commitment was supplied. The win therefore supports strategic optionality rather than a material near-term earnings addition. Assigning a specific customer identity or substantial robotics revenue would exceed the disclosed evidence.
Electrification also recovered from prior inventory digestion and delayed product introductions. Management cited increasing penetration of electrified vehicles, including hybrids, despite slightly lower overall vehicle production. This is directionally supportive because electrified platforms generally require more power-management, control, sensing, and connectivity content. However, the transcript’s penetration arithmetic is inconsistent: 47.5% versus 41% represents a 6.5-percentage-point increase and approximately 15.9% relative growth, not 12%. The figures are best treated as management’s approximate market framing rather than a precisely reconciled industry forecast.
INDUSTRIAL AND IOT: STRONG CURRENT GROWTH, EARLIER-STAGE AI MONETIZATION
Industrial & IoT revenue increased approximately 39% annually and 6.2% sequentially to $802 million. This follows approximately 38% annual growth in Q2, demonstrating sustained strength rather than an isolated quarterly rebound. Management stated that the industrial portion grew nearly 50% and now represents approximately 70% of the category. That implies roughly $560 million of quarterly industrial revenue, with the remainder associated with broader IoT applications.
Data centers, factory automation, and healthcare led the industrial contribution. This mix is favorable relative to a recovery concentrated in discretionary consumer devices. Nevertheless, end-market revenue growth combines cyclical recovery, content increases, product introductions, and customer adoption. The call does not quantify the contribution of each factor sufficiently to describe the entire 39% increase as structural AI growth.
Management reiterated that AI-enabled products should represent approximately 15% of Industrial & IoT processor revenue in 2026, more than doubling from the prior year. The denominator is processor revenue within Industrial & IoT, not total Industrial & IoT revenue and not consolidated NXP revenue. Applying 15% directly to the $802 million category would overstate the disclosed AI revenue base.
The current monetization mechanism is principally the sale of more capable embedded processors and associated system content. The disclosure does not establish a material recurring software subscription stream or a separately identifiable AI revenue surcharge. Investment value depends on higher product content, stronger design retention, broader platform adoption, and the economics of supporting fragmented industrial applications.
The discrete AI accelerator remains a later-stage opportunity, with production expected in 2028. The supplied draft inconsistently renders the product acronym, so the reliable conclusion is the production timing and application focus rather than a specific transcribed label. Current proofs of concept and customer engagement should not be converted directly into booked orders. The Q2 call had already described a substantial opportunity funnel, but a funnel is not contracted revenue and does not establish customer conversion rates.
Q4 Industrial & IoT growth is expected to moderate to the high-20% range annually, with low-single-digit sequential growth. That is still strong, but it represents deceleration from Q3. The appropriate interpretation is continued expansion against a progressively tougher comparison base, not indefinite extrapolation of approximately 40% growth.
DATA CENTERS: A CREDIBLE ADDITIONAL BUSINESS, NOT A DIRECT GPU-CAPEX PROXY
The data-center opportunity is strategically significant but remains relatively small. Revenue above $500 million in 2026 would represent more than approximately 3.5% of the implied full-year revenue base. The $1 billion 2028 ambition would be meaningful, but even that level would remain below 10% of consolidated revenue under a reasonable growth trajectory.
The 2026 guidance comparison requires particular care. The current call describes an expectation to exceed an earlier $500 million outlook. However, the Q2 call had already stated that 2026 data-center revenue was expected to exceed $500 million. Relative to the latest quarterly commentary, no additional quantified 2026 increase was disclosed. The more substantive extension is the approximately $1 billion 2028 objective.
Moving from $500 million to $1 billion over 2 years represents approximately 41% compound annual growth. Because the 2026 starting point is expected to exceed $500 million, reaching exactly $1 billion would require a somewhat lower rate. Management also used language indicating potential revenue above $1 billion, so the precise growth path remains open-ended. In either case, the implied expansion is attractive in absolute terms without matching the faster growth being discussed in certain AI power and accelerator-related categories.
The distinction is architectural. NXP is focused on control-plane processing, management, networking, security, and reliable operation within data-center systems. Its participation in top-of-rack infrastructure should not be interpreted as ownership of the principal data-plane switching silicon. Similarly, management explicitly distinguished the portfolio from discrete power exposure.
The bullish argument is that increasingly complex compute infrastructure requires more capable supervisory processing, monitoring, secure management, and coordination. Software integration and qualification can make these sockets sticky. Once a processor is embedded in a customer’s management architecture, replacement may require software changes, validation, and operational risk that exceed the processor’s purchase cost.
The limiting factor is that control-plane content does not necessarily scale linearly with accelerator spending, rack power, or total data-center capital expenditure. Accelerator prices can rise faster than supervisory processor content. Higher rack density can alter the number of controllers required per unit of compute. Product selection and software deployment can also delay NXP’s revenue relative to infrastructure construction.
Management’s response to the UBS question was therefore economically relevant: “The growth relies on acceptance and design-wins and also relies on customers deploying software into our products.” This explains why a broad industry doubling assumption cannot simply be applied to NXP. It also confirms that the revenue trajectory remains dependent on customer-specific conversion and implementation, rather than solely on aggregate infrastructure demand.
The company did not establish a 2027 doubling objective, a target for data centers to reach a particular percentage of consolidated revenue, or a need for a major acquisition. The additional buyback authorization therefore should not be read as abandonment of investment in this market. Equally, the authorization does not resolve whether organic development will be sufficient to establish a much larger competitive position.
A measured valuation treatment is appropriate. Data centers can support faster growth, better diversification, and potentially stronger customer retention. They do not yet justify valuing the entire company as a direct AI-infrastructure supplier. Under an illustrative consolidated revenue trajectory growing 10% annually from the implied 2026 base, $1 billion would represent approximately 5.8% of 2028 revenue. Automotive and industrial applications would still dominate NXP’s fundamental risk profile.
COMMUNICATIONS INFRASTRUCTURE, MOBILE, AND THE REPORTING REALIGNMENT
Communications Infrastructure & Other revenue increased approximately 54% annually and 11.3% sequentially to $503 million. Its $176 million annual increase represented approximately 29% of consolidated revenue growth. This was a substantial contributor, but the category contains businesses with different growth drivers and economic characteristics.
Management described the category’s 2025 exit mix as approximately 50% secure cards, 25% digital networking, and 25% RF power. Digital networking is expected to exceed 30% of the category by the end of 2026, while RF power is expected to fall below 20%. NXP has exited next-generation RF power development, not necessarily all existing RF power revenue. Consequently, legacy RF weakness can coexist with strong digital-networking and secure-card growth.
Data-center revenue is reported across more than this category. Management indicated that approximately half comes through digital networking, with other exposure elsewhere in the company. Data-center revenue must therefore not be added to reported end-market revenue or treated as wholly incremental to the Industrial & IoT and communications totals.
The planned 2027 reporting realignment should improve visibility if it separates businesses with materially different growth and capital characteristics. The required analytical standard is a sufficiently detailed historical recast. Without comparable prior-period data, changes in classification could obscure organic growth, disposal effects, and the actual contribution of data-center expansion.
Mobile revenue increased 17% sequentially to $411 million but declined 4.4% annually. Q4 is expected to show only slight sequential growth and a mid-teens annual decline. Mobile therefore remains a meaningful offset to the stronger businesses. The call did not establish whether the weakness reflects customer product cycles, market demand, content changes, or share movement. A structural share-loss conclusion would be unsupported, but assuming that the weakness is entirely temporary would also be premature.
ORDER QUALITY, INVENTORY, AND THE RESTOCKING DEBATE
Demand indicators strengthened materially. Management reported book-to-bill comfortably above 1 across all end markets and regions, a growing backlog extending further into 2027, increasing customer escalations, and longer lead times. Approximately 80% of lead times now exceed 16 weeks, compared with 25% a year earlier. This is a substantial change in supply-demand conditions.
Management nevertheless rejected the proposition that automotive growth was being driven by broad-based replenishment: “we’re not seeing anything noticeable that will suggest a broad-based restocking.” Direct engagement with vehicle manufacturers has increased, improving visibility into platform requirements and product demand. Approximately 40% of automotive revenue is serviced through distribution, where NXP states that it has good visibility.
The evidence supports improving demand visibility, but not the elimination of ordering risk. Longer lead times can themselves encourage earlier ordering, larger buffers, or duplicate demand signals. Backlog growth is less conclusive when delivery windows lengthen, and the company did not disclose a numerical book-to-bill ratio, backlog value, cancellation protections, or the proportion of orders tied to non-cancellable commitments.
Channel inventory was stable sequentially at 11 weeks, compared with 9 weeks a year earlier. The stable sequential coverage is inconsistent with an obvious Q3 surge in distribution inventory weeks. However, the annual increase in coverage and the possibility of higher absolute channel inventory alongside rising sales should not be ignored. Stable inventory weeks do not prove that no inventory accumulation is occurring anywhere in the customer chain.
NXP’s internal inventory days declined from 156 to 148. Excluding disclosed factory-consolidation prebuilds, inventory days declined from approximately 147 in Q2 to approximately 135 in Q3. This indicates improved underlying inventory efficiency despite increasing prebuild requirements. The absolute inventory balance nevertheless increased $39 million sequentially to $2.596 billion. The improvement in days therefore reflects faster throughput and the sales/cost denominator, not a liquidation of inventory dollars.
Management’s structural-growth argument is supported by identifiable design wins and higher-content products. It should not be interpreted as evidence that the semiconductor cycle has disappeared. Content growth, restocking, customer financing constraints, and supply bottlenecks can coexist. The most useful future evidence will be order conversion, sell-through, cancellation behavior, and inventory coverage as capacity becomes more available.
PRICING: BETTER THAN THE ORIGINAL PLAN, BUT NOT YET A SCARCITY WINDFALL
NXP entered 2026 expecting low-single-digit annual price declines. Management now expects pricing to be approximately neutral for the full year, with roughly 1% contributions cited for Q3 and Q4. This is a favorable development relative to the original assumption, although the Q2 call had already indicated improving pricing and selective adjustments.
The company was explicit about the near-term economics: “all we’re doing with the price increases is offsetting the higher inflationary costs that we’re passing on to our customers.” The gross-margin improvement should therefore be attributed principally to revenue, utilization, mix, and operating efficiency rather than an assumed inflation-driven profit windfall.
The distinction between like-for-like pricing and richer product mix is essential. Higher-priced SDV processors can lift average selling prices because they perform more functions and contain more value. That is not equivalent to increasing the price of an unchanged product. Conversely, an increase that only compensates for higher manufacturing costs may protect gross-profit dollars without automatically increasing the gross-margin percentage.
Management also argued that the historical pattern of annual semiconductor price erosion should moderate as semiconductors account for more system-level innovation. This is a credible strategic hypothesis, particularly in differentiated and software-intensive products, but it remains a hypothesis about future bargaining power. Competitive alternatives, customer purchasing leverage, localization, and product substitution will still constrain value capture.
Supply-demand pricing remains potential upside rather than an embedded assumption. Management described current back-end tightness and possible front-end tightening in 2027, while leaving open the possibility of future scarcity-related increases. A base case should not combine full inflation recovery, persistent scarcity pricing, and uninterrupted unit growth without evidence that those benefits can coexist.
MARGIN OUTLOOK AND THE 2027 REINVESTMENT BURDEN
Adjusted gross margin increased to 58.6% from 58.0% in Q2 and 57.0% in Q3 2025. Q4 guidance implies a further increase to 59%. Using the detailed release tables, approximately $56 million of incremental gross profit is expected on $64 million of sequential revenue growth, implying approximately 88% incremental gross margin. That unusually high conversion demonstrates that the forecast includes more than simple proportional scaling of the revenue base.
Management described the improvement as structural: “our gross margin improvements are very structural in nature.” The supporting factors include product mix, manufacturing efficiency, internal utilization, and future production transfers. Internal utilization is currently in the mid-80% range and is expected to move into the high-80% range in 2027.
The structural characterization should be qualified. Improved manufacturing architecture and product mix can create durable benefits, but utilization is inherently sensitive to demand. Higher utilization provides favorable absorption during expansion and can reverse during a slowdown. The company did not quantify the separate contributions of mix, fixed-cost absorption, productivity, and manufacturing transfers.
The more immediate 2027 issue is operating-expense intensity. Management expects approximately 23% of revenue in H1 and less than 23% in H2, compared with approximately 21.4% in Q3 and 21.6% implied for Q4. This means the current expense ratio is not an appropriate flat-line assumption for 2027.
The arithmetic is important: 60% gross margin less 23% operating expenses produces approximately 37% operating margin before minor other operating items. That is below the Q4 midpoint of 37.5%. Reaching the gross-margin milestone therefore does not guarantee that operating margin immediately exceeds the 2026 exit rate. Higher development spending can absorb the manufacturing benefit while still supporting attractive full-year earnings growth.
At the Q4 revenue level, increasing the expense ratio from approximately 21.6% to 23% would add roughly $56 million of quarterly expenses, equivalent to approximately $0.18 per share after tax. This is a sensitivity rather than a forecast, but it illustrates why revenue growth alone is insufficient to model the 2027 earnings trajectory.
Joint-venture investee losses are expected to reach approximately $80 million in 2027, including approximately $10 million in Q1 and $20 million in Q2. The remaining approximately $50 million is implicitly weighted to H2. At the current share base, the annual amount represents approximately $0.32 per share, or roughly $0.24 more than annualizing the Q4 loss assumption. These losses remain within NXP’s adjusted earnings framework because foundry investments are considered part of core operations.
The losses should not be confused with cash equity contributions. Equity-accounted losses reduce earnings; funding commitments affect cash separately. Forecasts that add back the losses and also ignore funding obligations would overstate the shareholder economics of the manufacturing transition.
Q1 commentary was explicitly seasonal rather than formal guidance. Bill Betz stated, “this is not guidance,” before describing a typical mid-single-digit sequential revenue decline, driven by a mid-teens decline in mobile and approximately 3%-5% declines in automotive and Industrial & IoT. Applying a 5% decline to the Q4 midpoint yields approximately $3.66 billion, still approximately 15% above Q1 2026. A sequential decline of that magnitude would therefore not automatically contradict the annual growth framework.
MANUFACTURING: ATTRACTIVE UNIT ECONOMICS WITH LONG-DURATION OBLIGATIONS
The manufacturing strategy combines internal capacity optimization, front-end joint ventures, and back-end expansion. The economic objective is to lower wafer and assembly costs, improve supply assurance, and capture more manufacturing value without funding every facility through consolidated capital expenditures.
The draft transcript appears to misidentify the recently opened Singapore facility as ESMC. NXP’s September 28 announcement identifies that facility as VSMC. It entered risk production with volume production scheduled for Q1 2027. NXP-specific technology qualification, wafer starts, finished output, and material revenue contribution are separate milestones, so the factory’s initial production date should not be treated as the date when all NXP cost benefits begin.
The call indicates NXP material starting in H1 2027, output in H2, and the more substantial volume benefit in 2028. Management expects gross margin to move above 60% in 2028 as the manufacturing program scales. This aligns the larger benefit with the fuller SDV product ramps, but it also concentrates execution requirements across products and manufacturing.
Moving suitable products from 200mm to 300mm production can improve die economics, while the joint-venture structure can reduce the margin paid to an external foundry. Neither benefit is automatic. Qualification, yield, utilization, depreciation, product compatibility, and the transition of existing customers all influence realized savings.
Back-end spending is more immediate. Capital expenditures are expected to increase to approximately 5% of revenue in 2027, compared with roughly 2% in 2026. Capacity additions in Q1 and Q2 are intended to support growth, while the expanded Malaysia assembly-and-test facility is targeted for production in early 2028.
At $16 billion of annual revenue, 5% capital intensity implies approximately $800 million of capital expenditure. Maintaining a 2% ratio at the same revenue would imply approximately $320 million. The difference is approximately $480 million of annual cash outflow before considering joint-venture equity commitments or intangible purchases. Earnings can therefore grow strongly while free-cash-flow growth is moderated by the investment cycle.
The quarterly filing adds an important qualification to the asset-light narrative. At September 27, remaining equity commitments were approximately $565 million for VSMC through 2027 and $351 million for ESMC through 2029. The filing also disclosed a VSMC minimum-loading purchase commitment of 80%-90%, corresponding to approximately $14.096 billion of purchases over 37 years once wafer production begins.
That purchase commitment is not equivalent to immediately payable debt and should not simply be added to net debt. It represents future purchases of production output rather than an entirely incremental financing liability. Nevertheless, it creates long-duration demand and utilization exposure. Reduced foundry margin stacking is accompanied by a commitment to absorb capacity through the cycle, rather than a cost benefit without corresponding risk.
CASH FLOW: EXCELLENT REPORTED CONVERSION, WITH IMPORTANT NORMALIZATION ITEMS
Operating cash flow reached $1.256 billion, compared with $860 million in Q2 and $585 million a year earlier. Net capital expenditures were $50 million, producing reported free cash flow of $1.206 billion, or 31.9% of revenue. Trailing-12-month free cash flow increased to $3.504 billion, reaching approximately 25% of revenue and recovering the long-term target.
The quarterly result is strong, but the 31.9% margin should not be annualized mechanically. Changes in operating assets and liabilities contributed approximately $71 million in Q3, compared with an approximately $384 million use of cash a year earlier. That $455 million improvement explains approximately 68% of the $671 million annual increase in operating cash flow. Higher earnings contributed, but the operating-balance swing was also material.
The cash-conversion cycle improved from 129 days in Q2 to 116 days, compared with 134 days a year earlier. Inventory days declined by 8, receivable days declined by 3, and payable days increased by 2 sequentially. This is broad improvement across operating balances, although longer payment periods and liability accrual timing should not be mistaken for permanent increases in underlying profitability.
Capital spending also contributed to the free-cash-flow surprise. The $50 million net expenditure was well below the $111 million Bloomberg estimate and the approximately 3% of revenue previously discussed for Q3. The $61 million shortfall relative to consensus represents approximately 29% of the roughly $208 million free-cash-flow beat. Spending timing, therefore, explains a meaningful part of the outperformance.
The treatment of joint-venture payments is particularly important. Management reported $218 million of combined equity and access-related investment during Q3. The full amount should not be deducted again from reported free cash flow. The filing shows that capacity-infrastructure payments are included in operating cash flow through other non-current assets. Subtracting those payments again would double-count the cash burden.
A separately defined measure can deduct investment purchases and intangible purchases that sit outside reported free cash flow. The quarterly release reports $124 million of investment purchases and $36 million of identified intangible purchases. Deducting those amounts from $1.206 billion produces approximately $1.046 billion, or 27.6% of revenue, before shareholder distributions and other financing uses. This remains excellent cash generation, but it is not the company’s reported free-cash-flow measure and does not assume that every investment purchase was a joint-venture equity contribution.
NXP had funded the disclosed $1.2 billion VSMC capacity-infrastructure commitment by quarter-end. This reduces a specific future cash burden, although remaining equity obligations and minimum wafer purchases continue. The decline in access-related funding requirements can help offset higher consolidated capital expenditures, but the net annual cash effect depends on payment schedules.
Q4 uses of cash include capital expenditure of approximately 3% of revenue, or roughly $116 million at the midpoint, plus $86 million of VSMC equity and $60 million of ESMC equity. These identified requirements total approximately $262 million before other investment and shareholder-return uses. They are manageable relative to recent operating cash generation, but reinforce the distinction between reported free cash flow and cash immediately available for repurchases.
CAPITAL RETURNS AND BALANCE-SHEET FLEXIBILITY
NXP ended Q3 with approximately $3.943 billion of cash and $10.978 billion of debt, producing approximately $7.035 billion of net debt. Net leverage declined to 1.3 times trailing adjusted EBITDA, compared with 1.5 times in Q2 and 1.8 times a year earlier. This provides meaningful flexibility to finance growth and increase shareholder returns.
The board’s additional $5 billion authorization increases total available repurchase capacity to approximately $6.3 billion. Management stated that repurchases would accelerate beginning in Q4 and continue into 2027. The authorization is substantial, but it is permission to purchase shares, not a binding expenditure schedule or an immediate reduction in the share count.
Actual Q3 capital returns were $359 million, comprising $256 million of dividends and $103 million described in the release as buybacks. The filing indicates that the treasury-share cash line also encompasses a small amount of employee tax withholding. Capital returns represented approximately 30% of quarterly reported free cash flow. Trailing-12-month returns of approximately $1.7 billion were approximately 49% of reported free cash flow.
At the supplied $230.34 reference, $1 billion would purchase approximately 4.34 million shares before transaction effects, equivalent to approximately 1.7% of the Q3 diluted share base. Actual EPS accretion would depend on purchase timing, employee equity issuance, foregone interest income, and funding costs. The full authorization would theoretically cover approximately 10.8% of that share base at an unchanged price, but treating this as an immediate EPS uplift would be inappropriate.
Capital allocation is therefore an increasingly important catalyst. The balance sheet and cash generation support faster returns, but the investment case should distinguish actual net share reduction from gross repurchase announcements. The near-flat annual diluted share count demonstrates that buybacks have not yet been a major driver of the reported earnings growth.
VALUATION, SCENARIOS, AND INVESTMENT IMPLICATIONS
At $230.34, the stock trades at approximately 15.1 times the mechanically implied 2026 adjusted EPS of $15.22 and approximately 13.2 times annualized Q4 adjusted EPS of $17.44. The latter is an exit-rate calculation, not a 2027 forecast. Applying the price to the Q3 diluted share base produces an approximate equity value of $58.5 billion and a trailing reported free-cash-flow yield of approximately 6%. That yield does not deduct all investment purchases and intangible expenditures outside the company’s free-cash-flow definition.
These metrics suggest that the post-release reference price does not require a high-growth AI valuation to support a constructive case. However, the earnings denominator benefits from a strong utilization phase, while the cash-flow denominator reflects favorable operating-balance movements and low recent capital expenditures. The appropriate valuation anchor is sustainable earnings and cash generation through the manufacturing transition, not the best quarterly conversion rate.
An illustrative base case, assigned a 55% probability, assumes 2027 revenue of $16 billion, approximately 11.8% growth; average gross margin of 59.5%; operating expenses of 22.8% of revenue; $316 million of financial expense; a 17.5% tax rate; $80 million of equity-accounted losses; $56 million of non-controlling interests; and 248 million diluted shares. These assumptions produce approximately $17.9 of adjusted EPS. A 16 times multiple implies approximately $287 per share, or approximately 25% appreciation from $230.34. This case assumes progress toward the gross-margin milestone without requiring a full-year 60% average or immediate large-scale monetization of the newest products.
An illustrative bull case, assigned a 20% probability, assumes $17 billion of revenue, approximately 18.8% growth; 60.5% average gross margin; operating expenses of 22%; $300 million of financial expense; the same tax rate, joint-venture losses, and non-controlling interests; and 242 million diluted shares. Adjusted EPS would be approximately $20.7. A 19 times multiple implies approximately $394 per share, or approximately 71% upside. This outcome requires stronger product conversion, favorable manufacturing execution, accelerated net repurchases, and a justified valuation premium. Both earnings and multiple expansion contribute materially to the result.
An illustrative bear case, assigned a 25% probability, assumes $14.75 billion of revenue, approximately 3.1% growth; 57.5% gross margin; operating expenses of 24%; $340 million of financial expense; the same tax rate, joint-venture losses, and non-controlling interests; and 252 million diluted shares. Adjusted EPS would be approximately $14.5. A 12 times multiple implies approximately $174 per share, or approximately 24% downside. This scenario reflects delayed vehicle platforms, weaker industrial demand, less favorable utilization, and limited operating-expense flexibility.
The probability-weighted value is approximately $280, implying approximately 22% price upside before dividends. These probabilities and multiples are analytical assumptions, not management guidance, Bloomberg consensus, or observed peer valuation statistics. The wide scenario dispersion is appropriate because the operating model combines attractive structural content growth with substantial semiconductor-cycle exposure.
Sensitivity remains high. At $16 billion of revenue and approximately 250 million shares, a 100-basis-point change in gross margin or operating-expense intensity changes annual EPS by approximately $0.53 after tax. Relatively small differences in utilization, product mix, or development spending can therefore materially affect earnings, even if the revenue framework is broadly achieved.
A selective accumulation strategy is preferable to an immediate full-sized position. An illustrative initial allocation of 1%-1.5% of NAV around $225-$235, with a 2% ceiling pending further evidence, reflects the favorable base-case economics without ignoring the transition risk. A price-based review or reduction threshold near $200 would represent approximately 13% downside from the supplied reference. At a 1.5% position, that corresponds to approximately 0.20% of NAV before gaps and slippage; the modeled bear value would imply approximately 0.37% of NAV loss. These are sizing references, not guaranteed loss limits.
The holding period should extend through the 2027 operating progression and into initial 2028 manufacturing and product validation, approximately 12-18 months. Profit-taking becomes appropriate around the base-case valuation unless evidence supports the bull case. A reduction or exit is warranted if the double-digit 2027 framework is withdrawn, the 60% gross-margin milestone is materially delayed, major platform ramps slip beyond the relevant investment horizon, or weakening sell-through coincides with rising customer inventories.
Portfolio exposure remains predominantly automotive and industrial semiconductor risk. A position adds sensitivity to global manufacturing, vehicle production, China-related demand and competition, and semiconductor utilization. Data-center participation provides diversification within NXP but does not make the position independent of existing AI-capex exposure. Portfolio-specific concentration and covariance cannot be quantified without holdings data.
CATALYSTS, DISCONFIRMING EVIDENCE, AND THE CENTRAL INVESTMENT DEBATE
The next earnings release should clarify Q1 seasonality, the initial impact of higher development spending, actual repurchase acceleration, and the new reporting structure. The March 3, 2027 Investor Day in Boston is the most important strategic catalyst. Relevant disclosures include a comparable historical revenue recast, a quantified data-center roadmap, the annual progression toward 60% gross margin, and the relationship between capital investment and sustainable cash returns.
Operational milestones are distributed across the investment horizon. Initial China S32K5 shipments are expected in Q1 2027. Back-end capacity additions are planned for Q1 and Q2. More substantial SDV ramps are expected in H2, with S32N beginning late in the year. Fuller S32K5 and S32N volumes, larger VSMC benefits, the Malaysia facility, and discrete AI-accelerator production are primarily 2028 developments. These milestones should not be collapsed into a uniform 2027 growth assumption.
The strongest disconfirming evidence would be rising backlog without corresponding shipment conversion, greater cancellations as lead times stabilize, higher channel coverage despite weaker sell-through, persistent operating expenses above the stated framework, or manufacturing delays that push savings out while spending continues. A requirement for materially more capital than disclosed would also weaken the free-cash-flow and repurchase thesis.
The strongest confirming evidence would be named production awards converting into revenue on schedule, demonstrable ancillary content around SDV processors, data-center growth tied to deployed products rather than opportunity funnels, gross-margin improvement despite the expense reset, and measurable net share-count reduction. Those outcomes would support a more durable growth profile and justify a higher valuation than a conventional cyclical recovery alone.
The central conclusion is that NXP’s operating recovery and content-growth strategy are credible, but the earnings call delivered more confirmation than near-term acceleration. The opportunity lies in purchasing a differentiated semiconductor franchise at a valuation that can work without assuming immediate AI-scale revenue. The principal risk is paying for 2028 benefits while underestimating the spending, qualification, and cyclical exposure required to reach them.
SOURCE AND MEASUREMENT QUALIFICATIONS
Financial comparisons use the detailed Q3 and Q2 earnings releases, the current call, prior management commentary, and the supplied Bloomberg consensus snapshot. The draft contains transcription and speaker-attribution errors. Mobile revenue is $411 million, not $411 billion; the relevant automotive architecture is zonal; and the newly opened Singapore factory is VSMC. Quotations are drawn from the supplied current-quarter call. Data-center, SDV, AI-enabled processor, and end-market disclosures overlap and are not additive. The $230.34 valuation reference is the supplied after-hours observation, not a subsequently verified trading price.
COMPANY EMPLOYEES ON THE CALL
• Rafael Sotomayor, President and Chief Executive Officer. • Bill Betz, Executive Vice President and Chief Financial Officer. • Mike Lucarelli, Senior Vice President of Investor Relations.
RESEARCH ANALYSTS ON THE CALL
• Jim Schneider, Goldman Sachs. • Thomas O’Malley, Barclays. • Joshua Buchalter, TD Cowen. • Blayne Curtis, Jefferies. • Harlan Sur, JPMorgan. • Matthew Prisco, Cantor. • Vivek Arya, Bank of America Securities. • Francois Xavier Bouvignies, UBS.
Key Read-Throughs
KEY READ-THROUGHS FROM NXP SEMICONDUCTORS’ Q3 2026 EARNINGS CALL
NXP’s call supports a selective semiconductor expansion rather than an indiscriminate recovery trade. The strongest positive implications concern conventional back-end equipment, committed specialty-foundry capacity, and higher semiconductor content in automotive and industrial systems. The most important negatives are the delay between manufacturing investment and earnings contribution, and the concentration of future automotive processor opportunities around fewer architectural winners. NXP’s growth does not establish stronger vehicle production, and its data-center trajectory should not be imposed on suppliers with different exposure to power, connectivity, or compute. The most actionable signals are specific capacity commitments and named platform selections, not broad references to physical AI. Countries below identify the listing markets of the securities shown; magnitude assessments refer to business impact rather than predicted share-price movements.
SEMICONDUCTOR EQUIPMENT AND SPECIALTY FOUNDRIES
BACK-END INVESTMENT BROADENS THE EQUIPMENT OPPORTUNITY BEYOND AI ACCELERATORS (READ-THROUGH 1)
Affected companies: Cohu (COHU: United States); Teradyne (TER: United States).
Directional impact and magnitude: Positive. Moderate significance for automotive and industrial test-equipment demand; potentially meaningful to supplier order momentum, but no defensible company-specific revenue allocation is available.
NXP provided unusually concrete evidence that the recovery is converting into physical capacity investment. Management described back-end capacity as “very, very tight,” plans additional capacity during Q1 and Q2 2027, and expects capital expenditures to increase from approximately 2% of revenue in 2026 to approximately 5% in 2027. The Malaysia assembly-and-test expansion is intended to enter production in early 2028. At an illustrative $16 billion revenue base, those capital-intensity ratios correspond to $800 million versus $320 million of annual spending. The approximately $480 million difference illustrates the scale of the investment shift, not an equipment-order forecast.
The transmission mechanism is increased demand for test cells, handlers, interfaces, inspection, and associated automation as automotive and industrial devices move through additional qualified manufacturing capacity. This is distinct from demand for high-bandwidth-memory or accelerator testing. Cohu’s relevant exposure includes handlers, interfaces, and semiconductor test equipment, with NXP identified among its customers in Malaysian investment-agency material. Teradyne’s relationship is more specifically documented: NXP has used its UltraFLEXplus platform and PortBridge technology for embedded-processor testing and validation.
The signal is strengthened by Texas Instruments’ October 21 commentary that it was not receiving as much capacity as desired from outsourced assembly-and-test partners and was accelerating its own Malaysia ramp. Independent customers identifying the same production constraint makes this more persuasive than an isolated NXP capital project.
The immediate catalyst is Cohu’s scheduled October 28 results and order commentary. Teradyne already released Q3 results on October 27, so NXP’s disclosure is corroboration for future demand and product mix, not a prediction of that completed earnings release. The longer-duration opportunity extends through 2027 equipment installation and 2028 production expansion.
The important limit is supplier allocation. No award for the new NXP facility has been established. Construction spending, equipment payments, orders, and revenue recognition occur at different times. The high-conviction conclusion is a larger, better-supported back-end spending opportunity for established suppliers, not that either company captures a specified percentage of NXP’s capital budget.
VSMC HAS CUSTOMER-BACKED DEMAND, BUT THE EARNINGS BENEFIT LAGS THE CAPACITY RAMP (READ-THROUGH 2)
Affected company: Vanguard International Semiconductor (5347: Taiwan).
Directional impact and magnitude: Positive and strategically material over 2028 and beyond; negative for assumptions of immediate 2027 earnings accretion. The near-term profit drag cannot be quantified from NXP’s disclosures alone.
Vanguard is the 60% owner and operator of VSMC, with NXP holding 40%. NXP’s call confirms an economically important anchor customer advancing toward production: qualification and material starts are expected during H1 2027, output during H2, and the larger volume contribution in 2028. Management also disclosed $218 million of combined equity and access-related payments into its manufacturing ventures during Q3 and another $86 million of VSMC equity funding planned for Q4.
The supporting quarterly filing makes the demand relationship more substantive than a generic customer forecast. NXP disclosed approximately $565 million of remaining VSMC equity commitments through 2027 and a wafer-purchase arrangement incorporating 80%-90% minimum loading, with approximately $14.1 billion of purchases expected over 37 years. These are NXP-specific contractual obligations, not evidence that every portion of VSMC’s factory output is protected on identical terms.
The transmission mechanism is funded manufacturing capacity followed by recurring wafer purchases. Vanguard gains exposure to NXP’s automotive, industrial, analog, and mixed-signal demand through a 300mm manufacturing platform. Customer commitment reduces demand uncertainty relative to building capacity entirely against uncommitted spot-market expectations. It also strengthens the strategic value of Vanguard’s Singapore footprint.
The negative read-through is the timing of profit conversion. NXP expects approximately $80 million of equity-accounted venture losses in 2027, while emphasizing that the larger manufacturing benefits arrive in 2028. Qualification, depreciation, staffing, and ramp inefficiencies can precede adequate production absorption. Consequently, stronger future wafer demand does not imply immediate improvement in Vanguard’s attributable earnings or cash returns.
NXP’s $80 million estimate combines VSMC and ESMC. It cannot legitimately be assigned entirely to VSMC and then scaled into a Vanguard earnings estimate using ownership percentages. Likewise, the $14.1 billion lifetime purchase amount is not present revenue, guaranteed profit, or an immediately payable receivable.
The near-term catalyst is greater disclosure of VSMC depreciation, customer qualification, and initial output in Vanguard’s next operating updates. The longer-duration catalyst is sustained utilization during 2028-2029. The appropriate investment distinction is improved long-term capacity economics alongside a potentially difficult near-term earnings transition. The recently opened Singapore facility is VSMC; the draft transcript’s reference to ESMC in that passage should not redirect the read-through to the Dresden venture.
ANALOG, INDUSTRIAL, AND DATA-CENTER SEMICONDUCTORS
THE INDUSTRIAL RECOVERY IS BROADER THAN AI PROCESSORS, SUPPORTING ESTABLISHED ANALOG FRANCHISES (READ-THROUGH 3)
Affected companies: Texas Instruments (TXN: United States); Infineon Technologies (IFX: Germany); STMicroelectronics (STM: United States).
Directional impact and magnitude: Positive, with moderate significance for industrial and automotive revenue durability. Incremental information is greater for forthcoming guidance than for quarters peers have already reported.
NXP’s Industrial & IoT revenue increased 39% annually to $802 million, while the industrial portion grew nearly 50% and represented approximately 70% of that category. Management identified factory automation, healthcare, and data centers as contributors. Automotive revenue increased approximately 17% excluding sensors despite broadly flat vehicle production. Book-to-bill remained above 1 across end markets and regions.
This combination supports a broader semiconductor-content and industrial-demand improvement rather than a recovery confined to discrete AI accelerators. More capable industrial systems require power management, signal conditioning, sensing, connectivity, and control around their processors. Electrification and increasingly complex vehicle electronics similarly expand the opportunity for analog and power components without requiring strong growth in vehicle units.
Texas Instruments is the clearest corroborated beneficiary. Its October 21 call had already described industrial growth above 40%, stronger automotive demand, and increasing semiconductor content per system. NXP therefore adds independent support to TI’s forward demand outlook; it does not provide a new forecast of TI’s completed Q3 results. Infineon’s August release likewise identified improving automotive orders and grid-infrastructure demand alongside AI power. NXP’s evidence strengthens the breadth and durability of that demand picture.
The implication for STMicroelectronics is supportive ahead of its October 29 results, particularly for the discussion of industrial and automotive orders. However, NXP’s processor design wins, customer mix, and sensor disposal prevent a direct transfer of its growth rates to ST. Any comparison also needs to distinguish NXP’s divestiture-adjusted growth from ST’s acquisition-inclusive results.
The near-term trading relevance is confirmation of order conversion, channel inventory, and Q4 guidance in forthcoming peer updates. The longer-duration benefit is greater semiconductor content per industrial system and vehicle, with improving factory utilization potentially amplifying profit growth.
Pricing is an important constraint on the bullish interpretation. NXP said its increases were “offsetting the higher inflationary costs that we’re passing on to our customers.” Neutral pricing versus originally expected erosion is favorable, but it does not establish a sector-wide scarcity-profit windfall. The stronger conclusion is improving volume and content economics, not automatic expansion in every supplier’s price-cost spread. TI’s own pricing commentary and manufacturing position must be evaluated separately rather than overwritten by NXP’s experience.
NXP’S DATA-CENTER RAMP DOES NOT SET THE GROWTH CEILING FOR POWER AND OPTICAL SUPPLIERS (READ-THROUGH 4)
Affected companies: Infineon Technologies (IFX: Germany); STMicroelectronics (STM: United States).
Directional impact and magnitude: Positive on a relative basis. Moderate significance for differentiated AI-infrastructure growth expectations; limited incremental support for raising numerical earnings estimates solely from this call.
The relevant evidence is NXP’s distinction between its control-plane portfolio and other forms of data-center exposure. Management stated, “We’re not in discrete, we’re not power. We are in the control-plane.” It expects more than $500 million of data-center revenue in 2026 and approximately $1 billion in 2028, with growth dependent on processor ramps, customer acceptance, and software deployment.
That is not a forecast for the entire data-center semiconductor market. Control-plane processor revenue depends on management architecture, processor selection, qualification, and software integration. It need not increase in direct proportion to rack power, accelerator expenditure, optical bandwidth, or aggregate data-center construction.
Infineon’s power-supply exposure has different physical drivers: power levels, conversion stages, efficiency requirements, and semiconductor content in the power-delivery chain. Its own disclosure already identified AI power as its most important growth driver. ST’s data-center opportunity spans a different combination of power, analog, and optical-connectivity products. Those businesses should be assessed against their own customer programs and content requirements, not against the timetable for NXP’s control processors.
The actionable implication is that NXP’s slower trajectory relative to certain peers is not, by itself, a reason to reduce Infineon or ST data-center assumptions. A broad sympathy sell-off based on treating all data-center semiconductor exposure as interchangeable would ignore the distinct revenue mechanisms. Conversely, NXP’s expanding customer engagement does not establish an incremental hyperscaler spending increase that can simply be added to peer forecasts.
ST’s October 29 update is the immediate opportunity to test its own data-center program progression. Infineon’s next annual outlook will provide a separate test of AI-power capacity and revenue conversion. Over 2027-2028, the more important fundamental distinction is whether each supplier’s content scales with power and bandwidth, or depends primarily on the timing of control-platform adoption.
AUTOMOTIVE PLATFORMS AND EMBEDDED PROCESSORS
THE VOLKSWAGEN-RIVIAN SELECTION REDUCES ARCHITECTURAL EXECUTION RISK, NOT VEHICLE-DEMAND RISK (READ-THROUGH 5)
Affected companies: Volkswagen (VOW3: Germany); Rivian Automotive (RIVN: United States).
Directional impact and magnitude: Positive. Moderate significance for platform execution and technology validation; small immediate earnings impact. The strategic relevance is greater for Rivian because the joint architecture is more consequential relative to its scale.
NXP disclosed that the Volkswagen-Rivian technology venture standardized its zonal platform on S32K5 across both companies. Volkswagen’s announcement confirms that the processors are intended as common building blocks for the architecture developed by Rivian and Volkswagen Group Technologies. NXP’s call places initial S32K5 shipments in 2027 and fuller product-family ramps in 2028.
The transmission mechanism is architectural standardization. A common zonal controller can consolidate functions previously distributed across separate electronic control units, simplify interfaces, support reusable software, and reduce the number of hardware variations requiring development and validation. A named production-oriented semiconductor platform provides a more tangible execution milestone than a general partnership announcement.
For Volkswagen, the longer-duration opportunity is reduced development duplication across brands and vehicle programs, together with a more coherent platform for software updates. For Rivian, the selection provides external validation of the joint venture’s architecture and its potential applicability beyond Rivian’s own vehicle volumes. That improves confidence in the industrialization pathway, although it does not establish new licensing income or cash receipts.
The distinction between supplier and customer economics is essential. NXP’s expectation of 2-3 times greater semiconductor content per vehicle is positive for NXP, but it is not automatically positive for OEM gross margins. Vehicle manufacturers benefit only if reduced controller, wiring, integration, validation, and lifecycle costs outweigh more expensive semiconductor content and implementation spending.
The near-term catalyst is management confirmation of vehicle-program timing and architecture deployment in the companies’ next results and product updates. The October 26 partnership announcement was already public before the NXP call, so the call adds supplier-side ramp detail rather than introducing the relationship.
The larger fundamental effect lies in 2027-2028 execution. No volume commitment, per-vehicle savings figure, guaranteed use across Volkswagen’s entire fleet, or incremental payment to Rivian was disclosed. The high-conviction positive is reduced architectural uncertainty, not stronger consumer demand or an immediate earnings upgrade.
ZONAL STANDARDIZATION CONCENTRATES FUTURE MCU OPPORTUNITIES AROUND THE WINNING PLATFORM (READ-THROUGH 6)
Affected companies: STMicroelectronics (STM: United States); Renesas Electronics (6723: Japan).
Directional impact and magnitude: Negative for competitive opportunity on the identified architecture. Moderate significance at the relevant product-platform level; low immediate consolidated earnings impact and no demonstrated current revenue loss.
NXP’s strongest competitive evidence is the S32K5 selection by the Volkswagen-Rivian venture, reinforced by expanding global engagements and potential China shipments in Q1 2027. Management also described software-defined architectures as delivering 2-3 times greater NXP content per vehicle, with fuller S32K5 and S32N ramps expected in 2028.
The relevant competing portfolios are specific. ST markets Stellar G for zone-oriented vehicle architectures, including integrated networking, safety, and hardware virtualization. Renesas markets RH850 products for vehicle control and migration toward domain- and zone-based architectures. These are overlapping architectural opportunities, not merely companies sharing an automotive revenue label.
The transmission mechanism is the concentration of future processor spending. Consolidating functions into fewer, more capable controllers can increase the value of each architectural selection while reducing the number of independently contestable sockets. Once an OEM invests in software, safety validation, tools, and integration around a controller platform, changing suppliers becomes more difficult. Winning an early common platform can therefore influence successive model introductions and software generations.
That creates a negative competitive read-through for rival opportunities within the selected architecture. The important risk is foregone future platform revenue and a less favorable position in subsequent design competitions, rather than an immediate reduction in existing shipments.
The evidence does not establish that either ST or Renesas was the displaced incumbent, that all surrounding components will be sourced from NXP, or that the rival companies are losing automotive share overall. Other controllers, power devices, sensors, and vehicle programs remain available. NXP’s own prospective share gains cannot be converted into a quantified peer revenue loss without incumbent, socket, and volume data.
The near-term catalyst is the quality of rival design-win disclosure: named customers, production timing, platform scope, and software reuse are more informative than aggregate opportunity pipelines. The fundamental effect is longer duration, with the relevant revenue implications concentrated in 2027-2029. China’s early S32K5 timing also matters because it indicates that the competitive contest is not confined to European vehicle architectures.
SEMICONDUCTOR INTELLECTUAL PROPERTY
ARM GAINS A LONGER-DURATION AUTOMOTIVE ROYALTY OPPORTUNITY, NOT AN IMMEDIATE AI REVENUE STEP-UP (READ-THROUGH 7)
Affected company: Arm Holdings (ARM: United States).
Directional impact and magnitude: Positive for architectural adoption and future royalty durability. Small near-term consolidated financial impact; potentially meaningful within automotive over several product generations, but unquantifiable from the disclosed contracts.
The call’s supporting evidence is the S32K5 platform selection, the existing SDV revenue run rate above $1.5 billion annualized, the reiterated $2 billion 2027 SDV target, and fuller next-generation processor ramps in 2028. NXP’s product documentation confirms Arm Cortex CPU cores in S32K5. The relationship is therefore direct IP incorporation, not a thematic association with physical AI.
The economic mechanism is Arm’s licensing and per-chip royalty model. A successful automotive processor platform can generate royalty-bearing shipments over a long vehicle-program life. Qualification requirements and accumulated software investment can extend the commercial duration of those shipments. A common architecture used across multiple brands creates a potentially broader deployment base than an isolated model nomination.
The most useful positive inference is stronger visibility into an Arm-based automotive platform reaching production and scale. The robotics design win provides additional evidence that the architecture can extend into adjacent control applications, but the unnamed customer and absent production volumes do not support a material robotics revenue estimate.
Timing and denominators constrain the magnitude. The processor announcement and associated licensing activity preceded this earnings call, so the design win does not prove a new license payment to Arm in Q3. Production royalties follow relevant chip shipments, with the larger opportunity tied to the 2027-2028 ramp. NXP’s 2-3 times content claim also cannot be applied directly to Arm royalties: that content includes networking, power management, security, and other components, while ECU consolidation can reduce chip counts even as system value increases.
Arm’s November 4 results provide a near-term opportunity for confirmation of automotive licensing and royalty trends. The stronger fundamental catalyst is sustained production adoption, not the earnings date itself. This is a positive extension of Arm’s long-duration embedded royalty base, rather than evidence that automotive is about to replicate the revenue profile or royalty economics of higher-value AI computing platforms.
Report record
- Sector
- Information Technology
- Industry
- Semiconductors & Semiconductor Equipment
- Fiscal period end
- September 30, 2026
- Report date
- October 27, 2026
- Analysis
- 7070 words
- Read-throughs
- 2782 words
- Content fingerprint (PDF)
306ac6e13c8c- Content fingerprint (analysis)
ea3da54df511- Content fingerprint (read-throughs)
1870443ce0c6
Prepared from the company's earnings release and earnings call transcript. Figures as reported by the company. For information only. Not investment advice.
More from NXP Semiconductors N.V.
No other reports yet.
All NXP Semiconductors N.V. reports
More in Information Technology
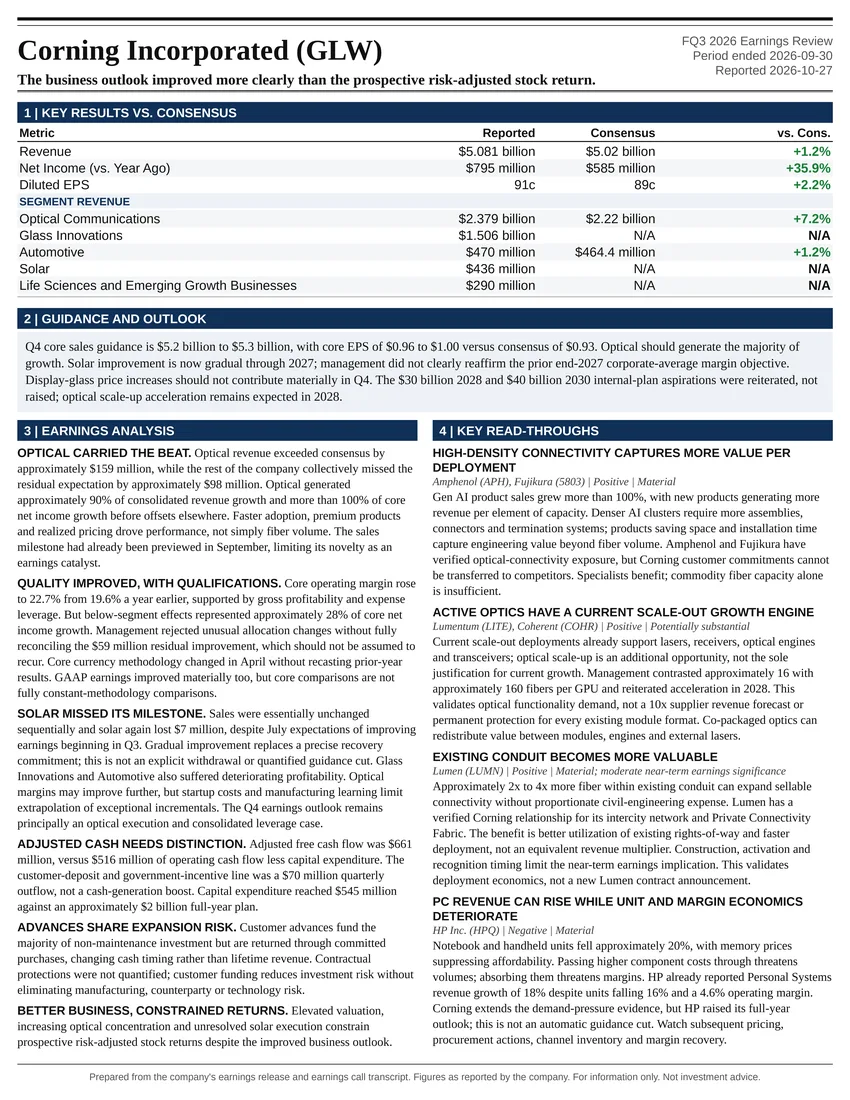
The business outlook improved more clearly than the prospective risk-adjusted stock return.
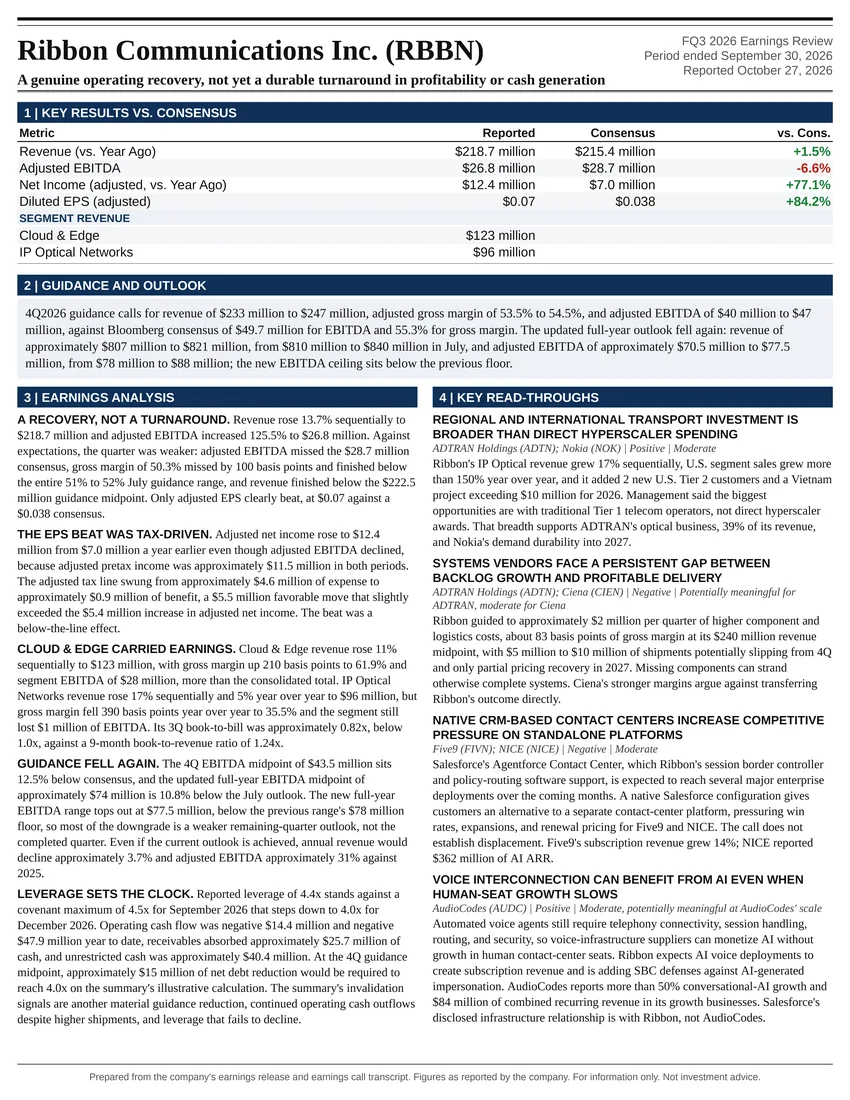
A genuine operating recovery, not yet a durable turnaround in profitability or cash generation
All Information Technology reports
Follow @AtlasPeakRes on X for new earnings reports as they publish.