Substantially stronger evidence of revenue durability than of accelerating earnings or cash generation
Earnings Reports
Ribbon Communications Inc. FQ3 2026 Earnings Report
Ribbon Communications Inc. (RBBN) FQ3 2026 earnings: A genuine operating recovery, not yet a durable turnaround in profitability or cash generation. Full earnings analysis, key read-throughs, and the one-page exhibit from Atlas Peak Research.
Ribbon Communications Inc. (RBBN)
Sector: Information Technology · FQ3 2026 · Period end September 30, 2026 · Reported October 27, 2026
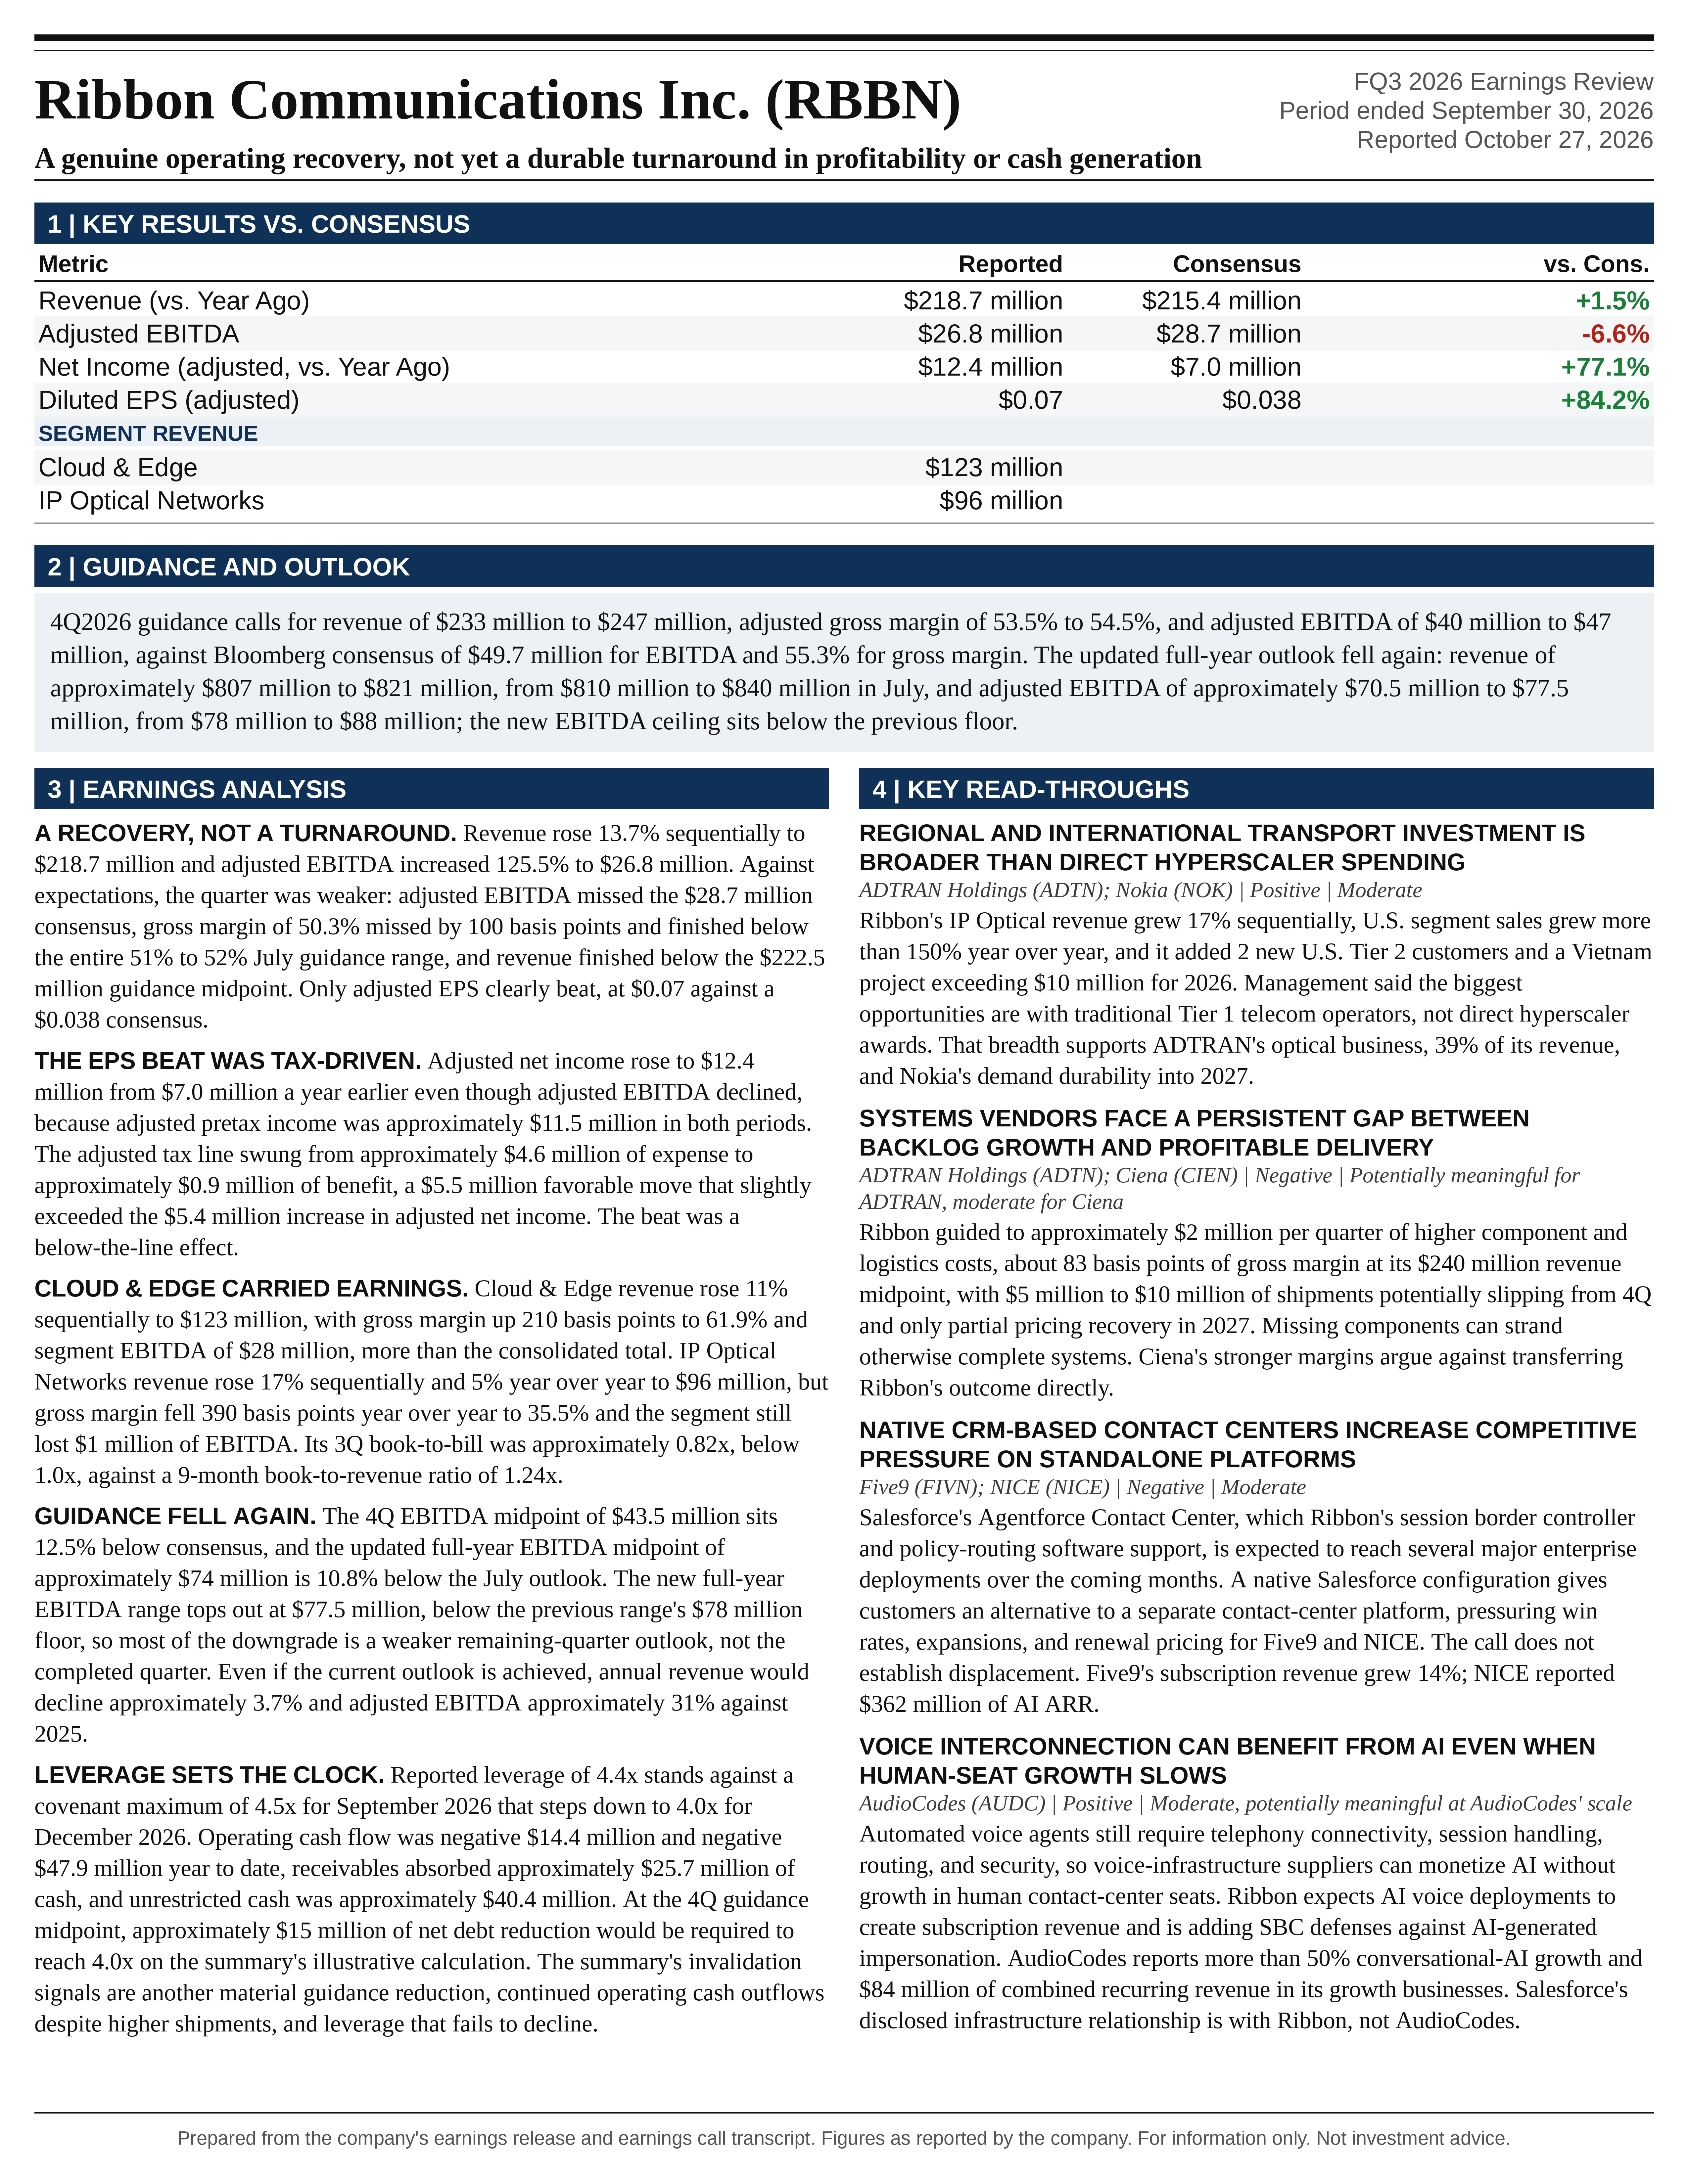
Ribbon’s 3Q2026 results demonstrated a genuine operating recovery, but not yet a sufficiently durable improvement in profitability, cash generation, or financial flexibility to establish a high-conviction equity turnaround.
Download the one-page report (PDF)
View one-page exhibit
Download analysis (.md)
Download read-throughs (.md)
Post to X
One-Page Exhibit
Earnings Analysis
EXECUTIVE CALL SUMMARY: Ribbon Communications (10/27/26)
Ribbon’s 3Q2026 results demonstrated a genuine operating recovery, but not yet a sufficiently durable improvement in profitability, cash generation, or financial flexibility to establish a high-conviction equity turnaround. Revenue increased 13.7% sequentially to $218.7 million, adjusted EBITDA increased 125.5% to $26.8 million, and both operating segments improved materially. Verizon activity accelerated, IP Optical Networks converted substantial backlog into shipments, and new customers broadened the revenue opportunity. However, gross margin and adjusted EBITDA missed expectations, the full-year outlook declined again, operating cash flow remained negative, and leverage increased to 4.4x. The appropriate investment stance is cautious, with no incremental long allocation justified solely by the operating rebound or emerging AI opportunities.
The most consequential distinction is between sequential improvement and performance relative to expectations. Adjusted EPS of $0.07 exceeded the Bloomberg consensus of $0.038, but adjusted EBITDA was 6.7% below consensus and gross margin missed by 100 basis points. Moreover, the earnings-release reconciliation shows that the year-over-year improvement in adjusted net income was explained by a favorable tax swing rather than growth in adjusted pretax earnings. The 4Q2026 EBITDA midpoint of $43.5 million was 12.5% below consensus, while the updated full-year EBITDA midpoint of approximately $74 million was 10.8% below the July outlook. The quarter therefore supports improving business activity, but not a positive earnings-revision thesis.
The balance sheet makes execution over the next several months especially important. The May credit amendment, reiterated in the July 31 Form 10-Q, permits maximum consolidated net leverage of 4.5x for September 2026, stepping down to 4.0x for December 2026 and subsequent quarters. Against reported leverage of 4.4x, the projected sequential EBITDA increase does not automatically resolve the issue because 4Q2026 replaces an already profitable 4Q2025 in the trailing calculation. An illustrative calculation using reported adjusted EBITDA and reconstructed debt principal indicates that approximately $15 million of net debt reduction would be required at the 4Q guidance midpoint to reach 4.0x. Contractual definitions can differ, so this is a financing sensitivity rather than a covenant-compliance determination. Nevertheless, cash conversion is a near-term investment catalyst, not merely a secondary operating metric.
The strongest fundamental positives are the recovery in Verizon deployments, attractive Cloud & Edge incremental margins, expanding regional-carrier and utility relationships, and a credible role in connecting AI-enabled voice applications to telecom networks. The principal offsets are continuing IP Optical losses, weaker year-over-year gross margins, a quarterly IP Optical book-to-bill below 1.0x, supply-constrained shipments, and an absence of quantified commercial economics for the newer AI initiatives. Sustainable equity upside requires these opportunities to become profitable revenue and cash before financing constraints absorb the benefit.
RESULTS VERSUS EXPECTATIONS AND HISTORICAL PERFORMANCE
Revenue of $218.7 million increased from $192.3 million in 2Q2026 and $215.4 million in 3Q2025. The sequential increase was substantial, but year-over-year growth was only 1.6%. Adjusted EBITDA increased from $11.9 million sequentially but declined from $28.9 million a year earlier. Adjusted EBITDA margin improved from 6.2% to 12.2% sequentially, while remaining below the prior-year 13.4%. This is a recovery from depressed profitability rather than evidence that the business has exceeded its previous earnings capacity.
The sequential operating leverage was strong. Approximately $26.4 million of incremental revenue produced $14.9 million of incremental adjusted EBITDA, equivalent to a 56.5% incremental margin. Non-GAAP gross profit increased approximately $15.2 million, while non-GAAP operating expenses remained around $88 million. The relatively stable expense base allowed higher shipment volumes and improved segment margins to flow through efficiently. This supports the argument that Ribbon can generate substantial earnings improvement without a proportionate revenue increase, provided the revenue composition is favorable.
The year-over-year comparison was less favorable. Non-GAAP gross profit declined approximately $3.1 million despite revenue increasing $3.3 million. Consolidated gross margin fell from 52.6% to 50.3%, overwhelming modest operating-expense savings. Adjusted EBITDA consequently declined 7.4%. The business generated more revenue but less adjusted operating profit, emphasizing that product, customer, geography, and service mix remain more important than aggregate revenue growth alone.
The quarter also finished below the midpoints of management’s July guidance. Revenue guidance had been $215 million to $230 million, with a $222.5 million midpoint. Actual revenue was $3.8 million, or 1.7%, below that midpoint, although within the range. Adjusted EBITDA guidance had been $26 million to $31 million, with a $28.5 million midpoint. Actual EBITDA was $1.7 million, or 6.1%, below the midpoint and near the lower end. Gross margin of 50.3% was below the entire 51% to 52% guidance range.
Against the supplied Bloomberg consensus, adjusted EBITDA missed by approximately $1.9 million and gross margin missed by 100 basis points. Adjusted EPS exceeded consensus by $0.032, or approximately 84%. These divergent outcomes should not be combined into an undifferentiated earnings beat. The operating measures were weaker than expected, whereas the after-tax earnings measure was stronger. The Bloomberg notice does not provide a revenue consensus, so a revenue beat or miss against that specific consensus snapshot cannot be established.
The broader historical context remains challenging. Revenue for the first 9 months declined 7.1% to $573.7 million, while adjusted EBITDA declined 54.4% to $30.4 million. The updated full-year midpoint implies approximately $814 million of revenue and $74 million of adjusted EBITDA, compared with $844.6 million and $106.6 million in 2025. Even if the current outlook is achieved, annual revenue would decline approximately 3.7% and adjusted EBITDA approximately 31%. The improving exit trajectory is meaningful, but it follows a substantial deterioration in full-year earnings.
EARNINGS QUALITY AND THE EPS BEAT
The reconciliation between adjusted EBITDA and adjusted net income is central to interpreting the quarter. Adjusted net income increased to $12.4 million from $7.0 million a year earlier, despite lower adjusted EBITDA. The release’s reconciliation implies adjusted pretax income of approximately $11.5 million in both periods. The difference was the adjusted tax line: approximately $0.9 million of benefit in 3Q2026 versus approximately $4.6 million of expense in 3Q2025.
The resulting $5.5 million favorable tax swing slightly exceeded the $5.4 million increase in adjusted net income. Thus, the year-over-year increase in adjusted net income was not evidence of stronger pretax earnings. Lower adjusted operating profit was broadly offset by improvements in other nonoperating items and interest expense, leaving pretax income essentially unchanged. The tax movement then produced the apparent earnings acceleration.
The company calculates non-GAAP taxes using an estimated annual methodology, and the release explicitly notes that this measure differs from actual tax liabilities. The call did not explain the specific drivers or persistence of the quarterly tax benefit. The benefit should therefore not be annualized, and the EPS beat should not be treated as proof that recurring operating profitability exceeded expectations. Without a comparable consensus tax bridge, the entire consensus EPS surprise cannot be attributed to taxes, but the historical earnings-quality distinction is clear.
GAAP results also remain relevant. Ribbon recorded $5.6 million of operating income but a $9.1 million net loss, compared with a $12.1 million net loss a year earlier. The reconciliation to adjusted net income included approximately $9.8 million of intangible amortization, $5.7 million of stock-based compensation, $1.4 million of restructuring costs, and tax adjustments. Acquisition-related amortization is noncash, but stock compensation remains an economic cost to shareholders, and restructuring has recurred across reporting periods. Adjusted EBITDA is useful for evaluating operating progress but materially overstates cash available for debt reduction or equity holders.
Interest expense remains a significant constraint. Net interest expense of $11.3 million represented approximately 42% of quarterly adjusted EBITDA. Adjusted EBITDA covered net interest expense by approximately 2.4x, while adjusted operating income covered it by approximately 2.0x. These are accounting coverage measures rather than contractual calculations, but they illustrate why revenue growth must produce sustained cash generation before the equity can be evaluated as an unconstrained growth investment.
CLOUD & EDGE: THE PRIMARY SOURCE OF EARNINGS RECOVERY
Cloud & Edge revenue increased 11% sequentially to $123 million but remained approximately 1% below the prior year. Gross margin improved 210 basis points sequentially to 61.9%, while adjusted EBITDA increased $10 million to $28 million, or approximately 23% of revenue. The segment generated more than the entirety of consolidated adjusted EBITDA because IP Optical remained modestly loss-making. Cloud & Edge is therefore the principal source of near-term financial flexibility.
The recovery reflects higher service-provider activity, improved product and service margins, and better utilization of professional-services resources. The July call had identified resources retained for customer deployments that progressed more slowly than expected. The subsequent improvement indicates that higher activity and cost alignment are beginning to repair that utilization problem. However, professional-services profitability remains sensitive to deployment timing because revenue can fluctuate against a relatively fixed staffing base.
Verizon was the most important customer development. Sales increased approximately 50% relative to the average quarterly run rate in 1H2026, and Verizon remained a customer accounting for more than 10% of revenue. The comparison is against the 1H quarterly average, not explicitly against 2Q2026 or 3Q2025. It therefore demonstrates a meaningful recovery from the weak start to the year without establishing a 50% sequential or year-over-year growth rate.
Management described the improvement as “meaningful progress as we work with Verizon to reaccelerate their voice network modernization program.” That assessment is supported by the increase in recognized revenue, but the customer remains a source of concentration and timing risk. Ribbon’s revenue depends not only on Verizon’s willingness to modernize, but also on migration schedules, operational readiness, project acceptance, and deployment execution. An attractive customer return on investment does not guarantee a predictable supplier revenue cadence.
The 2027 commentary was encouraging but not quantified. McClelland stated, “Together, we’re targeting increased velocity in 2027,” while discussing planning for the Frontier footprint. Existing-network migrations and potential Frontier-related modernization represent distinct opportunities. The former has an established deployment base; the latter remains at an early planning stage, with alternative technical approaches under consideration. Frontier-related activity should not be modeled as an awarded revenue program or an automatic extension of current Verizon economics.
The gateway and circuit-emulation discussion is strategically relevant. Moving the TDM-to-IP transition closer to the customer can facilitate retirement of broader legacy copper infrastructure, potentially expanding the addressable modernization scope beyond replacement of central switching functions. Ribbon’s portfolio offers several implementation paths. However, different architectures can produce materially different hardware, software, and professional-services revenue profiles, so a larger customer modernization opportunity does not translate mechanically into proportionate Ribbon earnings.
Importantly, Verizon is not expected to explain most of the 4Q increase. In response to Michael Genovese, McClelland said, “It’s not the majority of the increase in Q4.” The outlook therefore requires broader execution across Cloud & Edge, including software deliveries and professional-services recognition. This reduces dependence on a single incremental customer event but increases the number of operational elements that must perform as expected.
The TNS partnership broadens access to independent and rural operators by offering hosted legacy-switch replacement. The economic proposition is credible because smaller carriers can modernize without maintaining complex switching infrastructure themselves. For Ribbon, this can extend distribution and potentially support recurring monetization. The call did not disclose contract economics, revenue-sharing arrangements, subscription duration, or committed customer volumes. A transition toward hosted consumption could improve long-term revenue quality while changing the timing of upfront revenue and cash receipts.
IP OPTICAL: COMMERCIAL PROGRESS WITHOUT A PROVEN PROFIT INFLECTION
IP Optical Networks revenue increased 17% sequentially and 5% year-over-year to $96 million. Management characterized the result as the segment’s strongest 3Q performance and its 2nd-highest quarterly U.S. revenue performance. U.S. sales increased more than 150% year-over-year, and segment revenue exceeded 1Q2026 by more than 50%. These results support the view that the strong 1H bookings were real commercial opportunities capable of conversion into shipments.
However, the contrast between U.S. growth above 150% and total segment growth of only 5% shows that the improvement was not uniformly distributed. Regional mix, different customer deployment schedules, and the expiration of a legacy support contract constrained the consolidated segment growth rate. Product revenue increased 13% year-over-year, but lower services revenue offset part of that improvement. The lost support contract is especially relevant because installed-base service revenue can be economically attractive even when its top-line growth is limited.
The segment’s gross margin increased only 30 basis points sequentially to 35.5% and declined 390 basis points year-over-year. Management attributed the annual decline primarily to higher component costs and unfavorable geographic mix. Adjusted EBITDA improved $5 million sequentially but remained a $1 million loss, compared with approximately $1 million of profit a year earlier. Record seasonal revenue therefore did not produce positive segment EBITDA.
The margin deterioration has substantial economic significance. Applying the prior-year 39.4% gross margin to the current $96 million revenue base would generate approximately $3.7 million more gross profit. With other costs unchanged, that would move segment EBITDA from approximately negative $1 million to positive $2.7 million. Conversely, at the current 35.5% gross margin and an unchanged implied operating-cost base, EBITDA breakeven would occur at roughly $99 million of revenue. These are simplified sensitivities, but they show that the segment is near EBITDA breakeven while remaining highly exposed to relatively small changes in pricing, costs, or mix.
Routing shipments were a highlight, with management citing approximately 35% growth and stating that routing exceeded optical sales. The spoken remarks did not explicitly identify the comparison period for that 35% figure. More importantly, the shift toward IP routing does not currently establish a higher-margin product mix. Asked about the difference between routing and optical margins, McClelland said, “they’re actually pretty consistent right now.”
The explanation was that much of Ribbon’s routing revenue comes from lower-cost access and aggregation platforms rather than higher-margin core routing. Management expects routing profitability to improve over time, but the current result does not support importing the economics of premium core-routing franchises into Ribbon’s forecast. The combined routing and optical portfolio improves competitive relevance, particularly when pluggable optics are integrated directly into routing platforms, but architectural convergence is not itself evidence of pricing power.
The 2 new U.S. Tier 2 service-provider wins are strategically encouraging. Regional carriers may value responsiveness, technical support, and product attention that larger vendors increasingly direct toward hyperscale customers. Management’s reference to operators investing double-digit millions annually indicates the scale of potential customer infrastructure budgets, not the value of awarded Ribbon contracts. The comparison with Rogers similarly illustrates the target customer category rather than identifying either new customer or guaranteeing a specific deployment size.
The expansion with a large U.S. energy producer and the new Midwest power-generation and transmission utility further validate Ribbon’s critical-infrastructure positioning. These customers prioritize resilience, long equipment life, deterministic performance, and service continuity. Such requirements can support defensible supplier relationships and demand that is less directly tied to consumer telecom spending. Nevertheless, qualification cycles, implementation requirements, and long-term support commitments can also consume engineering resources and working capital. Commercial diversification should ultimately be evaluated through segment returns, not customer announcements alone.
BOOKINGS, BACKLOG, AND GEOGRAPHIC DIVERSIFICATION
Total bookings increased 8% year-over-year, while backlog increased 9%. These indicators support management’s statement that the underlying demand environment remains healthy. IP Optical’s 9-month book-to-revenue ratio of 1.24x also indicates that orders exceeded recognized revenue over the broader period. However, the quarterly detail was more mixed than the prepared remarks initially suggested.
IP Optical’s 3Q book-to-bill was approximately 0.82x. Applied to rounded segment revenue of $96 million, that implies approximately $79 million of bookings and a roughly $17 million difference between shipments and new orders, before other backlog adjustments. Bookings still increased approximately 9% year-over-year, so the sub-1.0x ratio is not evidence of an annual demand collapse. It does establish that the quarter consumed backlog rather than replenishing it at the shipment rate.
Management’s explanation is reasonable: exceptionally strong earlier bookings were intended to convert into higher revenue. McClelland stated there were “no concerns there really, I think, on the demand picture.” Nevertheless, the next test is whether orders recover sufficiently to sustain the higher shipment base. The 9-month ratio cannot substitute indefinitely for quarterly replenishment, particularly when the company is simultaneously presenting the revenue level as a stronger foundation for future growth.
The expectation that customers will place orders to secure supply creates both visibility and analytical risk. Earlier ordering can improve procurement planning and reduce shipment uncertainty. It can also pull bookings forward without increasing underlying end demand. Backlog growth should therefore be interpreted alongside delivery schedules, cancellations, customer acceptance, margin content, and cash collection. Absolute backlog, cancellation terms, and the share expected to convert over specific periods were not disclosed on the call.
Geographic performance was broadly constructive. Americas revenue increased 11% sequentially and 2% year-over-year. Asia Pacific increased 20% sequentially and 19% year-over-year. EMEA increased 14% sequentially but declined 11% year-over-year against a strong comparison, with lower Middle East and Africa revenue offsetting European improvement. These results support diversification beyond the largest U.S. telecom customers without demonstrating uniform regional growth.
The Vietnam project exceeds $10 million for 2026, not necessarily for 3Q alone. India remained strong, while additional opportunities were identified across Southeast Asia, Japan, and Taiwan. The African backbone projects illustrate how data-center connectivity can be added to networks also serving mobile backhaul and broadband. This is a broader infrastructure demand opportunity rather than a narrowly defined hyperscale AI interconnect market.
Management also reported approximately 5% year-over-year growth excluding the largest U.S. Tier 1 service-provider customers. That is encouraging evidence that the rest of the business is expanding faster than the consolidated company. However, diversification is occurring across customer, geography, and application categories that overlap. Utilities, government, regional carriers, and data-center connectivity should not be treated as independent additive growth pools without examining the underlying contracts.
4Q GUIDANCE AND THE FULL-YEAR DOWNGRADE
The 4Q outlook calls for revenue of $233 million to $247 million, adjusted gross margin of 53.5% to 54.5%, and adjusted EBITDA of $40 million to $47 million. At the midpoints, revenue would increase 9.7% sequentially and EBITDA 62.5%, with EBITDA margin reaching approximately 18.1%. The full revenue range implies sequential growth of 6.5% to 12.9%, while the EBITDA range implies growth of 49.4% to 75.5%.
Relative to 4Q2025, the midpoint implies revenue growth of approximately 5.6% and adjusted EBITDA growth of approximately 8.5%. However, the 54.0% gross-margin midpoint remains below the prior-year 55.4%. The guide therefore anticipates a strong seasonal earnings recovery without a return to the prior-year gross-margin level.
The consensus comparison remains unfavorable. Bloomberg’s EBITDA estimate was $49.7 million, above the entire $40 million to $47 million guidance range. The midpoint shortfall is $6.2 million, or 12.5%, and even the upper endpoint is approximately 5.4% below consensus. The 54.0% gross-margin midpoint is 130 basis points below the 55.3% consensus estimate. Management’s confidence in sequential improvement should therefore be distinguished from the market’s higher pre-release profit expectations.
The earnings-release outlook reconciliation also updates the full year, although the call emphasized the quarterly guide. Rounded full-year revenue guidance is approximately $807 million to $821 million, compared with July’s $810 million to $840 million. Adjusted EBITDA is approximately $70.5 million to $77.5 million, compared with $78 million to $88 million. The new EBITDA upper endpoint is below the previous lower endpoint. Gross-margin guidance falls to approximately 50.3% at the midpoint from 51.5%.
The downgrade is not simply recognition of the completed quarter’s shortfall. Using July’s annual and quarterly midpoints, the previous implied 4Q expectation was approximately $247.6 million of revenue and $50.9 million of EBITDA. The new midpoints are approximately $7.6 million and $7.4 million lower, respectively. These are mechanical implied comparisons, not previously issued standalone 4Q guidance. They show that approximately 80% of the reduction in the annual EBITDA midpoint relates to a weaker remaining-quarter outlook rather than the 3Q miss alone.
The longer guidance history reinforces the need for caution. In February, initial 2026 guidance called for revenue of $840 million to $875 million and EBITDA of $105 million to $120 million. The current midpoint is approximately 5.1% below the original revenue midpoint and 34.2% below the original EBITDA midpoint. The disproportionate earnings decline demonstrates the sensitivity of the model to modest revenue shortfalls, margin mix, and deployment timing.
The 4Q profitability bridge also requires more than a shift toward Cloud & Edge. At the midpoint, approximately $21.3 million of additional revenue must generate $16.7 million of additional EBITDA, an incremental margin of approximately 78.6%. Gross profit would increase from approximately $110.1 million to $129.6 million. Using the release’s depreciation assumption, implied non-GAAP operating expenses would rise from approximately $87.6 million to $90.7 million. The projected improvement therefore depends predominantly on gross-profit expansion, not additional expense reductions.
A segment-mix sensitivity illustrates the requirement. If IP Optical revenue stayed at $96 million and Cloud & Edge increased to $144 million, unchanged segment gross margins would produce only approximately 51.3% consolidated gross margin. Reaching 54.0% under that simplified mix would require Cloud & Edge gross margin of approximately 66.3%, assuming IP Optical remained at 35.5%. Both segments are actually expected to grow, so this is not a segment forecast. It demonstrates that within-segment software and services mix, utilization, or other margin improvements are necessary in addition to a higher Cloud & Edge revenue share.
SUPPLY CONSTRAINTS AND PRICING
Management expects approximately $2 million per quarter of additional component and logistics costs. At the 4Q revenue midpoint, that is equivalent to approximately 83 basis points of gross margin. The same approximate cost assumption was included in July guidance, so it is not a newly disclosed expense that independently explains the latest downgrade.
The timing of pricing relief is also important. Management now described “the potential to partially offset that through targeted price increases in 2027.” Partial recovery should not be modeled as complete cost normalization, and the reference to 2027 does not establish near-term protection. Realized pricing will depend on contractual flexibility, customer negotiations, competitive conditions, and the mix of existing versus new orders.
Supply limitations are broader than a single component category. Management identified memory, core silicon, and optical line-system technology as constraints, with availability depending on the product mix and customer lead times. McClelland estimated that $5 million to $10 million of customer-desired shipments could move from 4Q into the following quarter. That represents approximately 2.1% to 4.2% of the revenue midpoint.
The delayed revenue should not be automatically added to guidance or treated as guaranteed 1Q2027 upside. The estimate is conditional on procurement and delivery execution, and the mix of deferred products was not disclosed. At current segment gross margins, $5 million to $10 million of revenue could carry materially different gross-profit contributions depending on whether it is predominantly IP Optical hardware or higher-margin Cloud & Edge content.
Supply constraints also challenge Ribbon’s stated competitive advantage in responsiveness. Smaller customers may value faster delivery and technical attention, but delivering that service can require inventory commitments, expedited logistics, and procurement flexibility. Those requirements are more demanding when liquidity is constrained. Strong demand can therefore coexist with weaker near-term cash conversion and margin pressure.
CASH FLOW, LIQUIDITY, AND THE DECEMBER LEVERAGE TEST
Operating cash flow was negative $14.4 million in 3Q, compared with positive $26.5 million in 3Q2025. Deducting cash purchases of property and equipment produces analyst-calculated free cash flow of approximately negative $15.5 million, compared with positive $21.0 million a year earlier. This measure excludes financing cash flows and is not presented as a separate company-defined metric.
The working-capital explanation is supported by the statements. Accounts receivable increased from $220.2 million to $246.2 million sequentially, and receivables absorbed approximately $25.7 million of cash during the quarter. Higher accounts payable provided approximately $6.9 million, but lower accrued liabilities and deferred revenue absorbed additional cash. Higher shipments can explain receivables growth without implying weaker credit quality, but the collection benefit remains unrealized until cash is received.
The year-to-date cash deterioration is significant. Operating cash flow was negative $47.9 million versus positive $22.2 million in the comparable 2025 period. Operating cash flow less property-and-equipment purchases was approximately negative $56.4 million. Additional software-license spending increased the cash outflow from operations and investing to approximately $56.9 million. Financing-classified tax withholding on vested equity awards consumed another $5.1 million during the period, outside conventional free cash flow.
Quarterly capital expenditure of approximately $1.1 million was below management’s typical $3 million to $4 million quarterly expectation. The lower spending reduced immediate cash consumption, but it should not be assumed to represent a sustainable reduction in capital requirements. A return toward the normal spending level would reduce cash available for deleveraging unless operating conversion improves.
The headline cash balance of approximately $42 million included approximately $2 million of restricted cash. Unrestricted cash and equivalents were approximately $40.4 million. Total cash, including restricted amounts, declined approximately $3.1 million sequentially despite a $15 million net revolver draw. Management characterized the borrowing as simplifying cash management, but economically it also provided funding during a cash-consuming quarter.
The July filing disclosed a $35 million revolver. With $15 million outstanding at September, nominal unused capacity would be approximately $20 million before any other restrictions or commitments. That capacity should not be treated as unconditional liquidity because borrowing remains subject to contractual requirements. The same filing disclosed a higher applicable interest margin when leverage exceeds 3.75x, illustrating that weaker leverage can also increase the financing burden.
Reconstructing debt principal from the June filing and subsequent repayments indicates approximately $350.6 million of gross debt at September, including the revolver, and approximately $310.2 million net of unrestricted cash. This is consistent with reported leverage of approximately 4.4x against trailing adjusted EBITDA of $70.4 million. The balance sheet’s lower debt carrying value reflects unamortized financing costs and should not be substituted for principal when assessing repayment obligations.
The December covenant step-down is the immediate financing issue. The 4Q EBITDA midpoint increases full-year adjusted EBITDA to approximately $73.9 million because 4Q2025 already contributed approximately $40.1 million. With net debt unchanged, leverage would still be approximately 4.2x. Reaching 4.0x on that simplified basis requires approximately $14.7 million of net debt reduction. At the EBITDA guidance floor, the required reduction rises to approximately $28.7 million; at the ceiling, it falls to approximately $0.7 million.
These figures are not a prediction of a breach. Covenant EBITDA adjustments, cash-netting provisions, and any subsequent amendments can change the result. They establish that the range of operating outcomes has materially different financing implications. The call did not provide a detailed bridge from expected collections and earnings to the December contractual threshold.
The cash-flow response was notably less definitive than the earnings outlook. Asked whether operating cash flow would turn positive in 4Q, Marmurek stated, “I do expect it to improve a little bit into the fourth quarter and certainly as we move into Q1 of ’27.” That is not an explicit commitment to positive 4Q operating cash flow, nor to sufficient cash generation to meet the illustrative midpoint deleveraging requirement. The timing difference matters because a cash recovery in 1Q2027 may not address a December testing date.
AI AND DATA-CENTER OPPORTUNITIES: CREDIBLE EXPOSURE, UNPROVEN FINANCIAL MATERIALITY
The call described several distinct AI-related opportunities that should be valued separately. These comprise transport connectivity serving data centers, secure voice connectivity for enterprise AI agents, detection of AI-enabled voice fraud, and autonomous network-management software. They differ substantially in addressable customers, product economics, competitive intensity, and commercialization timing.
The transport opportunity is predominantly carrier-mediated rather than direct hyperscaler infrastructure. McClelland explicitly stated that “the biggest opportunities we’re seeing are with more traditional Tier 1 telecom operators” and that “it’s less into the data center directly.” He also emphasized international markets. This clarification limits the interpretation that Ribbon is approaching a large direct hyperscale award or becoming a supplier of AI cluster networking.
Ribbon’s relevant role is in fiber and packet networks that connect data centers while also supporting mobile backhaul, broadband, and other enterprise traffic. This can be a substantial and durable opportunity, particularly in underserved markets. It does not imply exposure to the same spending pools or margins as leading suppliers of AI compute fabrics. The company’s success should be assessed through awarded carrier projects, revenue recognition, and segment profitability rather than association with aggregate AI capital expenditure.
The Salesforce Agentforce Contact Center relationship is more directly connected to enterprise AI adoption. Management expects several major enterprises to enter deployment over the coming months, creating additional subscription revenue for Ribbon. This is a meaningful progression from the partnership announced in 2Q toward prospective production usage. Nevertheless, no annual recurring revenue, contract values, pricing metrics, committed volumes, or adoption conversion rates were disclosed.
Ribbon’s role in providing secure voice connectivity is technically important, but financial participation cannot be inferred from the full value of Salesforce’s AI applications. Monetization will depend on Ribbon’s contractual position, session or usage economics, deployment scale, and infrastructure costs. The AWS relationship similarly strengthens technical and distribution positioning without establishing a disclosed revenue contribution.
The voice-phishing opportunity is potentially attractive because Ribbon can distribute new security capabilities through an installed SBC base. However, the commercial proposition requires more than identifying synthetic speech. Legitimate AI agents also generate synthetic voice, so fraud detection must be integrated with identity, authorization, context, and policy. Detection accuracy, false positives, latency, encrypted-media handling, inference costs, and customer willingness to pay will determine whether the capability becomes a differentiated subscription product or a bundled platform feature.
Management described a “significant revenue opportunity over the next several years,” which is appropriately a longer-term possibility rather than near-term guidance. The call did not disclose production customers, paid deployments, pricing, independent performance validation, or revenue. Acumen AIOps was similarly presented through leadership investment and strategic intent, without recurring-revenue or customer-adoption metrics. These initiatives warrant monitoring but do not yet support a material recurring-software valuation premium.
The proposed connection between legacy-switch retirement and edge AI infrastructure is directionally plausible but financially indirect. Removing older equipment can release space, power, and cooling capacity. Converting that capacity into useful AI infrastructure still requires suitable power density, thermal design, connectivity, compute investment, and end-customer demand. The strongest current justification for voice modernization remains operating-cost reduction and network simplification, independent of whether edge inference becomes a major subsequent use case.
INVESTMENT IMPLICATIONS, SCENARIOS, AND CATALYSTS
Ribbon is best characterized as a leveraged communications-infrastructure recovery with emerging software opportunities, rather than a proven AI growth compounder. The positive case rests on a relatively fixed operating-cost base, improving customer deployments, and meaningful Cloud & Edge contribution margins. The negative case rests on recurring forecast reductions, project timing, weak cash conversion, and a debt structure that reduces tolerance for execution shortfalls.
Illustrative near-term scenarios can frame the distribution of outcomes without implying that management has issued additional guidance. A 50% base case assumes 4Q revenue of $237 million to $243 million and adjusted EBITDA of $42 million to $45 million. This assumes continued Verizon progress, broader Cloud & Edge execution, and manageable supply constraints. It confirms the recovery but leaves cash collection and the precise covenant calculation as essential determinants of equity risk.
A 25% bull case assumes revenue of $247 million to $252 million and EBITDA of $47 million to $50 million. It requires favorable software and services mix, shipment execution at or above the published range, and stronger collections. Approaching $50 million of EBITDA would be particularly helpful because the resulting trailing earnings base could substantially reduce the December leverage pressure. Evidence of paid enterprise AI deployments would strengthen the 2027 narrative, but would not need to account for most near-term earnings upside.
A 25% bear case assumes revenue of $225 million to $233 million and EBITDA of $32 million to $38 million. Deployment delays, unfavorable mix, or supply constraints could produce this outcome even if underlying customer demand remained intact. Combined with continued cash consumption, it would materially increase the importance of covenant relief, additional financing, or other balance-sheet actions. These probabilities and ranges are analytical assumptions, not statistical forecasts or company guidance.
The scenarios highlight an asymmetric equity issue: modest operating disappointments can have consequences beyond the immediate earnings reduction. Greater financing costs, lender negotiations, dilution risk, or restricted investment capacity can compound the impact. Conversely, profitable revenue growth accompanied by debt reduction can produce substantial equity value creation without requiring an aggressive AI valuation premium.
Valuation must therefore separate sustainable segment earnings, financing obligations, and unproven optionality. Cloud & Edge has demonstrated profitability; IP Optical still needs to establish consistently positive returns. New AI products should receive limited value until commercialization is measurable. At approximately 180 million diluted shares, every $10 million of net debt reduction would add roughly $0.06 per share to equity value if enterprise value were unchanged. Every $10 million change in sustainable EBITDA would have a larger effect determined by the valuation multiple, illustrating why margin quality and debt reduction are the central equity variables.
A price-based target or entry level cannot be supported without a verified market valuation and a normalized earnings framework. The appropriate incremental allocation remains 0% until the financing and cash-conversion questions are resolved sufficiently to establish an attractive risk-adjusted return. The quarter does not independently justify an outright short thesis either, because operating activity has improved and the fixed-cost model can generate significant upside if deployments and collections accelerate together.
The immediate catalysts are 4Q shipment conversion, the software and professional-services margin contribution, receivables collection, and clarification of December covenant headroom. The next stage is evidence during early 2027 that deferred shipments convert, Verizon migration rates increase, Frontier planning becomes awarded work, and enterprise AI deployments produce identifiable subscription revenue. IP Optical order replenishment and sustained EBITDA profitability are equally important tests of whether the commercial expansion is creating value.
The principal invalidation signals for a constructive thesis are another material guidance reduction, continued operating cash outflows despite higher shipments, leverage that fails to decline, an unfavorable financing amendment, repeated sub-1.0x IP Optical book-to-bill without a credible replenishment path, or a failure to monetize the newer software offerings. Evidence that would invalidate the cautious stance includes sustained positive cash generation, demonstrated covenant headroom, durable Cloud & Edge margin expansion, and IP Optical growth accompanied by positive returns rather than merely larger shipment volumes.
From a portfolio perspective, Ribbon adds telecom capital-spending exposure, small-cap liquidity risk, customer concentration, and leveraged execution sensitivity. It should not be treated as a defensive recurring-software position or as a clean substitute for direct AI infrastructure exposure. Customer diversification can reduce reliance on individual carriers, but financial leverage can still dominate equity behavior during periods of operational stress.
The central conclusion is that 3Q improved the probability of an operating recovery while leaving the equity investment dependent on proof of cash conversion and financial flexibility. The most important forthcoming evidence is not another expansion of the opportunity pipeline. It is profitable delivery, collected cash, and a demonstrably manageable balance sheet.
COMPANY EMPLOYEES ON THE CALL
• Bruce McClelland, President and Chief Executive Officer. • Rick Marmurek, Chief Financial Officer, identified as Eric Marmurek in the transcript’s speaker labels. • Fahad Najam, Senior Vice President, Corporate Strategy and Investor Relations.
RESEARCH ANALYSTS ON THE CALL
• Michael Genovese, Rosenblatt Securities. • Timothy Savageaux, Northland Capital Markets. • Dave Kang, B. Riley Securities.
Key Read-Throughs
KEY READ-THROUGHS FROM RIBBON COMMUNICATIONS’ 3Q2026 EARNINGS CALL
Ribbon’s October 27 call supports a selective recovery in carrier transport investment, accelerating legacy-network modernization, and the commercialization of enterprise voice AI. It does not support an indiscriminate upgrade to communications-equipment earnings. Bookings increased 8% year-over-year and backlog increased 9%, yet component shortages, unfavorable mix, and working-capital requirements constrained profitability and cash generation. The most important cross-portfolio distinction is between companies supplying scarce components, companies integrating those components into systems, and software platforms monetizing the resulting connectivity. The strongest positive implications concern regional and international optical-network demand, secure voice infrastructure, and Verizon’s modernization program. The strongest negative implications concern systems-vendor shipment conversion and the expanding competitive threat to standalone contact-center platforms. Magnitudes below refer to business and earnings exposure, not predicted share-price moves. Countries denote corporate domicile.
OPTICAL NETWORKING AND COMMUNICATIONS EQUIPMENT
REGIONAL AND INTERNATIONAL TRANSPORT INVESTMENT IS BROADER THAN DIRECT HYPERSCALER SPENDING (READ-THROUGH 1)
Affected companies: ADTRAN Holdings (ADTN: United States); Nokia (NOK: Finland).
Direction and magnitude: Positive. Moderate potential relevance to ADTRAN’s optical business and consolidated growth trajectory; positive but more modest incremental significance for Nokia’s larger group.
Ribbon reported 17% sequential growth in IP Optical revenue, more than 150% year-over-year growth in U.S. segment sales, 2 new U.S. Tier 2 service-provider customers, and additional utility deployments. European projects included replacement of Chinese equipment, while a Vietnam project exceeds $10 million for 2026. Crucially, management clarified that “the biggest opportunities we’re seeing are with more traditional Tier 1 telecom operators” and emphasized international markets rather than direct hyperscaler awards.
The transmission mechanism is investment in transport capacity that serves multiple applications simultaneously: mobile backhaul, broadband, enterprise connectivity, and data-center access. This supports demand for optical line systems, packet aggregation, network management, and associated services even when the purchasing customer is not itself a hyperscaler. European equipment replacement adds a distinct source of demand that can persist independently of incremental traffic growth. Utility modernization adds resilience and security requirements alongside bandwidth expansion.
ADTRAN has a particularly relevant exposure. Its latest reported quarter generated $109.7 million of optical-networking revenue, approximately 39% of total revenue, with 22% year-over-year growth. Its own commentary identified vendor replacement, network modernization, enterprise, government, and cloud customers as demand drivers. Ribbon therefore provides independent confirmation of the end-market breadth supporting that business, rather than merely another statement about hyperscale AI spending.
For Nokia, the call corroborates conditions already reflected in its October 22 results, when IP Networks and Optical Networks grew 43% and 18%, respectively, at constant currency. Ribbon is not predicting those completed results. It provides additional support for the durability of carrier and international demand into 2027.
The near-term catalyst is ADTRAN’s November 2 results and November 3 call, particularly optical bookings, shipment conversion, and the 4Q outlook. Nokia’s more relevant catalyst is subsequent confirmation of its 2027 growth assumptions. The longer-duration implication is a broader customer base for transport investment. The limitation is competitive: Ribbon’s awarded projects belong to Ribbon, not its peers, and its share gains can coexist with healthy market demand. This is an end-market validation, not evidence that ADTRAN or Nokia won the same business.
SCARCE OPTICAL COMPONENTS HAVE BETTER DEMAND VISIBILITY THAN SYSTEMS REVENUE (READ-THROUGH 2)
Affected company: Lumentum Holdings (LITE: United States).
Direction and magnitude: Positive for component utilization, capacity commitments, and the durability of optical demand. Moderate relevance to the affected product lines, but limited incremental near-term earnings information from Ribbon alone.
Ribbon identified optical line-system technology among the components with substantial lead times and estimated that $5 million to $10 million of customer-requested shipments could slip from 4Q2026. Management also described customers placing orders earlier to obtain supply assurance. These comments establish that constrained availability is influencing purchasing behavior beyond the largest direct hyperscaler programs.
The precise economic channel is the dependence of completed optical systems on specialized components. A systems vendor can hold substantial backlog and most of the required inventory while still being unable to ship because a critical component is unavailable. Manufacturers of that bottleneck component can consequently obtain longer customer commitments, better capacity visibility, and potentially more favorable commercial terms than downstream systems integrators.
Lumentum is a supported exposure because it manufactures pump lasers used in optical amplification. Its August earnings discussion reported pump-laser shipment growth above 80% year-over-year, described the business as effectively sold out despite capacity expansion, and identified customer agreements supporting the planned ramp. Separately, Ciena has explicitly identified pump lasers as a constrained input in optical line systems. These disclosures establish the component’s economic role; Ribbon’s call adds evidence that line-system constraints remain relevant later in the year.
The near-term checkpoint is Lumentum’s November earnings update, with emphasis on qualified capacity, actual shipments, and margins rather than order demand alone. The longer-duration implication is support for capacity utilization and customer commitments through the 2027 expansion period.
The important boundary is supplier attribution. Ribbon did not identify its optical-component vendors or the particular optical component preventing delivery. No specific Lumentum order, share allocation, or incremental revenue amount can be inferred. Nor should a sold-out business receive an immediate revenue upgrade simply because demand exceeds supply. The positive read-through concerns the durability and quality of demand backing capacity investment, not unrestricted near-term shipment upside.
SYSTEMS VENDORS FACE A PERSISTENT GAP BETWEEN BACKLOG GROWTH AND PROFITABLE DELIVERY (READ-THROUGH 3)
Affected companies: ADTRAN Holdings (ADTN: United States); Ciena (CIEN: United States).
Direction and magnitude: Negative for near-term shipment upside and margin-conversion assumptions. Potentially meaningful for ADTRAN’s relatively low operating-margin base; moderate execution risk for Ciena, without evidence of a new demand downturn.
Ribbon’s guidance includes approximately $2 million per quarter of higher component and logistics costs. At its $240 million 4Q revenue midpoint, that represents approximately 83 basis points of gross margin. The potential $5 million to $10 million shipment deferral represents approximately 2.1% to 4.2% of that revenue midpoint. Management expects only potential partial pricing recovery in 2027, not an immediate offset.
The mechanism is broader than higher purchase prices. Missing components can prevent delivery of otherwise complete systems, distort the shipment mix toward available lower-margin products, increase inventory requirements, and delay invoicing and collections. Expedited freight and procurement commitments can further weaken cash conversion. A rising backlog can therefore indicate delivery constraints rather than a proportionate increase in realizable near-term revenue.
ADTRAN has already demonstrated this sensitivity. Its 2Q commentary attributed weaker results partly to supply constraints that prevented higher-margin shipments. Non-GAAP operating margin was 3.8%. Ribbon’s October commentary makes an assumption of rapid industry-wide supply normalization less defensible ahead of ADTRAN’s November results. It does not establish the size of any ADTRAN shipment shortfall.
Ciena provides an important counterweight to a blanket bearish interpretation. It has independently disclosed shortages involving pump lasers, packaging, and memory, but its latest reported adjusted gross margin increased to 46.4%, and adjusted operating margin reached 22.5%. Its 9-month operating cash flow also increased substantially. Ribbon’s margin deterioration and liquidity problems therefore cannot be transferred directly to Ciena.
The near-term trading implication is caution toward earnings scenarios that convert order growth into immediate shipment or margin upside. The relevant checkpoints are ADTRAN’s November report and Ciena’s next fiscal-year-end update. Over a longer horizon, component access, procurement scale, customer pricing flexibility, and balance-sheet strength become competitive differentiators. This favors discrimination among systems vendors rather than a sector-wide short thesis.
ENTERPRISE SOFTWARE, CONTACT CENTERS, AND VOICE INFRASTRUCTURE
SALESFORCE’S VOICE-AI COMMERCIALIZATION IS RECEIVING INDEPENDENT SUPPLIER VALIDATION (READ-THROUGH 4)
Affected company: Salesforce (CRM: United States).
Direction and magnitude: Positive. Moderate strategic significance for Agentforce and customer-service monetization, but small and unquantified immediate relevance to consolidated revenue.
Ribbon stated that it expects “several major enterprises will begin deploying Agentforce Contact Center over the coming months,” generating additional subscription revenue for Ribbon. This is more informative than a generic partnership announcement because it points to anticipated production activity involving identifiable enterprise deployment processes.
The relationship is direct and verified. Ribbon’s May announcement identified its cloud-native session border controller and policy-routing software as infrastructure supporting Salesforce’s Agentforce Contact Center, deployed across multiple AWS instances. Ribbon is therefore observing activity within the delivery chain rather than commenting on enterprise AI demand from outside the ecosystem.
The transmission mechanism is reduced implementation friction for Salesforce’s native voice offering. Reliable telephony integration, call routing, security, and handoffs between AI and human agents are necessary for enterprise adoption. Successful deployments can support paid contact-center functionality, Agentforce usage, and deeper attachment to the service platform. Bringing voice interactions into the same customer-data and workflow environment can also increase platform integration and switching costs.
The distinction between commercialization and financial materiality remains important. Salesforce’s latest reported quarterly revenue was $11.3 billion, while Ribbon disclosed no customer contract values, Salesforce consumption volumes, or contact-center-specific revenue. The call supports a higher probability of commercialization, not a measurable increase in Salesforce’s near-term earnings.
The near-term catalyst is disclosure of production customers and actual usage in Salesforce’s next reporting cycle. Because Ribbon’s language concerns deployments over the coming months, it is not evidence of a material revenue contribution to Salesforce’s quarter ending October 31. The more relevant fundamental window is calendar 4Q2026 through 2027.
Salesforce had already disclosed substantial Agentforce growth before this call. The incremental information is supplier-side evidence that voice-enabled contact-center deployments are progressing toward production, not proof that the broader Agentforce business was previously uncommercialized.
NATIVE CRM-BASED CONTACT CENTERS INCREASE COMPETITIVE PRESSURE ON STANDALONE PLATFORMS (READ-THROUGH 5)
Affected companies: Five9 (FIVN: United States); NICE (NICE: Israel).
Direction and magnitude: Negative for longer-duration competitive positioning and pricing flexibility. Moderate potential significance for the contact-center franchises; no supported immediate revenue reduction.
The supporting call evidence is the same expected deployment of Agentforce Contact Center by several major enterprises. The negative implication for incumbents arises because Salesforce is not merely adding an AI assistant above an unchanged telephony architecture. Its product supports native voice, AI and human-agent handoffs, routing, customer context, and supervisory workflows within the CRM environment.
The transmission mechanism is competition for platform ownership. A Salesforce customer considering a contact-center modernization can increasingly evaluate a native Salesforce configuration against a separate contact-center platform integrated with Salesforce. That additional alternative can affect new-customer win rates, expansion opportunities, renewal negotiations, and the amount of incremental software spending captured by the standalone platform.
Five9 has a direct connection to this competitive tension because its Salesforce integration is an established route to market. The same CRM platform that helps distribute Five9 functionality is also offering native alternatives. NICE faces the broader architectural challenge through CXone, although its contact-center expertise, analytics, operational tooling, and installed base provide differentiation beyond basic telephony.
The call does not establish displacement. Salesforce continues to support telephony partners, and Five9’s integration remains an available customer choice. Incumbent operating data also provide meaningful counterevidence: Five9’s latest reported subscription revenue grew 14%, while NICE reported record AI bookings and $362 million of AI ARR. Customers can expand AI usage on incumbent platforms rather than migrate away from them.
The near-term catalyst is the November earnings cycle, particularly competitive commentary, renewal pricing, pipeline conversion, and evidence of AI revenue offsetting pressure elsewhere. The more important fundamental window is 2027 and subsequent contract-renewal cycles. The high-conviction conclusion is that a credible additional enterprise platform is entering production consideration. It is not that current customers have already defected or that near-term estimates should automatically be cut.
VOICE INTERCONNECTION CAN BENEFIT FROM AI EVEN WHEN HUMAN-SEAT GROWTH SLOWS (READ-THROUGH 6)
Affected company: AudioCodes (AUDC: Israel).
Direction and magnitude: Positive for voice-AI connectivity and managed services. Moderate relevance to the growth businesses and potentially meaningful to a company of AudioCodes’ scale, although no specific contract or earnings increment is established.
Ribbon expects enterprise AI voice deployments to create subscription revenue and describes secure connectivity as a necessary layer between AI applications and traditional telecom services. Its announcement of SBC-based capabilities addressing AI-generated impersonation also indicates that voice security requirements are expanding alongside automation.
The economic mechanism differs from that of applications priced primarily around human users. An automated voice agent still requires telephony connectivity, session handling, routing, media processing, and security. Those functions can remain necessary even when fewer interactions reach human agents. Voice-infrastructure suppliers therefore have a route to AI monetization that is not wholly dependent on growth in human contact-center seats.
AudioCodes has a verified exposure through VoiceAI Connect, Live Hub, and managed communications services. Its August results reported more than 50% year-over-year growth in conversational AI, record bookings for VoiceAI Connect and Live Hub, and $84 million of combined recurring revenue across its managed-services and conversational-AI growth businesses. Ribbon’s commentary is independent confirmation of the underlying enterprise requirement rather than an unsupported extension from a remote AI theme.
The November 4 results are a particularly relevant near-term catalyst. The useful indicators are production deployments, recurring-revenue growth, customer expansion, and conversion of VoiceAI bookings, rather than generic references to AI demand. The longer-duration opportunity is a larger software and services contribution as enterprise voice architectures become more automated and cloud-based.
The competitive limitation is explicit: Salesforce’s disclosed infrastructure relationship is with Ribbon, not AudioCodes. That award cannot be transferred to AudioCodes. Ribbon’s new security functionality also raises the competitive standard rather than automatically creating AudioCodes revenue. The positive read-through is validation of the addressable need and monetization layer, not evidence that AudioCodes is winning every major deployment.
TELECOM OPERATORS AND LEGACY-NETWORK MODERNIZATION
VERIZON’S MODERNIZATION ACCELERATION IS MORE IMPORTANT FOR COST REMOVAL THAN FOR A BROAD CAPEX REBOUND (READ-THROUGH 7)
Affected company: Verizon Communications (VZ: United States).
Direction and magnitude: Positive for execution of recurring network-cost reduction. Modest incremental significance at consolidated scale, with more meaningful implications for the affected legacy-wireline operations.
Ribbon reported that Verizon revenue increased approximately 50% relative to the average quarterly run rate in 1H2026. Verizon remained a customer accounting for more than 10% of Ribbon revenue. Management described “meaningful progress as we work with Verizon to reaccelerate their voice network modernization program” and stated that the companies are targeting increased deployment velocity in 2027.
The comparison matters: the 50% increase is against the 1H quarterly average, not explicitly against 2Q2026 or the prior-year quarter. It demonstrates resumed activity after a slower start, rather than establishing a comparable increase in Verizon’s overall capital spending.
The transmission mechanism is retirement of costly legacy infrastructure. Replacing traditional switching functions with modern software and moving the TDM-to-IP transition closer to customer premises can allow removal of switching equipment and, in suitable deployments, broader copper infrastructure. Savings can arise through lower maintenance requirements, fewer legacy platforms, reduced facilities and energy consumption, and simpler operations.
Frontier provides a potential extension of that opportunity within Verizon. However, Ribbon explicitly described the Frontier work as early planning with multiple technical approaches under consideration. The call does not establish an awarded deployment schedule or a quantified increase in acquisition synergies. Any benefit belongs within the Verizon investment case, not a separately listed Frontier equity thesis.
Verizon had already reported its quarter on October 26, so Ribbon’s October 27 commentary is corroboration and an update to future execution assumptions, not a forecast of Verizon’s completed results. The near-term catalyst is evidence that migrations continue accelerating into year-end and that customer-network retirements follow the equipment deployments. The larger fundamental benefit is recurring cost removal during 2027 and beyond, subject to implementation, regulatory requirements, and service-continuity obligations.
The cross-portfolio distinction is that supplier revenue growth does not necessarily signal a generalized carrier spending cycle. Verizon can increase selected modernization purchases while remaining disciplined on total capital expenditure because those purchases are intended to reduce future costs. Similarly, Ribbon’s discussion of reusing released central-office capacity for edge AI is optionality, not evidence of an additional funded compute deployment. The highest-conviction implication is improved execution of network simplification and cost reduction.
Report record
- Sector
- Information Technology
- Industry
- Communications Equipment
- Fiscal period end
- September 30, 2026
- Report date
- October 27, 2026
- Analysis
- 5823 words
- Read-throughs
- 2624 words
- Content fingerprint (PDF)
72753e6fa780- Content fingerprint (analysis)
0c40ace65b83- Content fingerprint (read-throughs)
c9b06febf1e9
Prepared from the company's earnings release and earnings call transcript. Figures as reported by the company. For information only. Not investment advice.
More from Ribbon Communications Inc.
No other reports yet.
All Ribbon Communications Inc. reports
More in Information Technology
The business outlook improved more clearly than the prospective risk-adjusted stock return.
Stronger fundamental outlook, but current profitability is not a contractual floor
All Information Technology reports
Follow @AtlasPeakRes on X for new earnings reports as they publish.