AI Participation Is Proven; a Consolidated Growth Inflection Is Not
Earnings Reports
Palo Alto Networks FQ4 2026 Earnings Report
Palo Alto Networks (PANW) FQ4 2026 earnings: Strong quarter; durable, dilution-adjusted shareholder returns remain critical. Full earnings analysis, key read-throughs, and the one-page exhibit from Atlas Peak Research.
Palo Alto Networks (PANW)
Sector: Information Technology · FQ4 2026 · Period end July 31, 2026 · Reported September 1, 2026
Palo Alto Networks delivered a strong fiscal Q4 2026, with improving evidence of competitive displacement, platform expansion and acquisition-related cross-selling. The quarter supports a constructive fundamental assessment, but not an unconditional valuation-based BUY recommendation.
Download the one-page report (PDF)
View one-page exhibit
Download analysis (.md)
Download read-throughs (.md)
Post to X
One-Page Exhibit
Earnings Analysis
EXECUTIVE CALL SUMMARY: Palo Alto Networks Inc. (09/01/26)
Palo Alto Networks delivered a strong fiscal Q4 2026, with improving evidence of competitive displacement, platform expansion and acquisition-related cross-selling. The quarter supports a constructive fundamental assessment, but not an unconditional valuation-based BUY recommendation. The central investment distinction is between genuine operating momentum and the substantially higher growth rates produced by acquisition consolidation, a concentrated observability migration and changing revenue mix. The business is expanding its strategic relevance, but the conversion of that expansion into durable, dilution-adjusted shareholder returns remains the critical underwriting question.
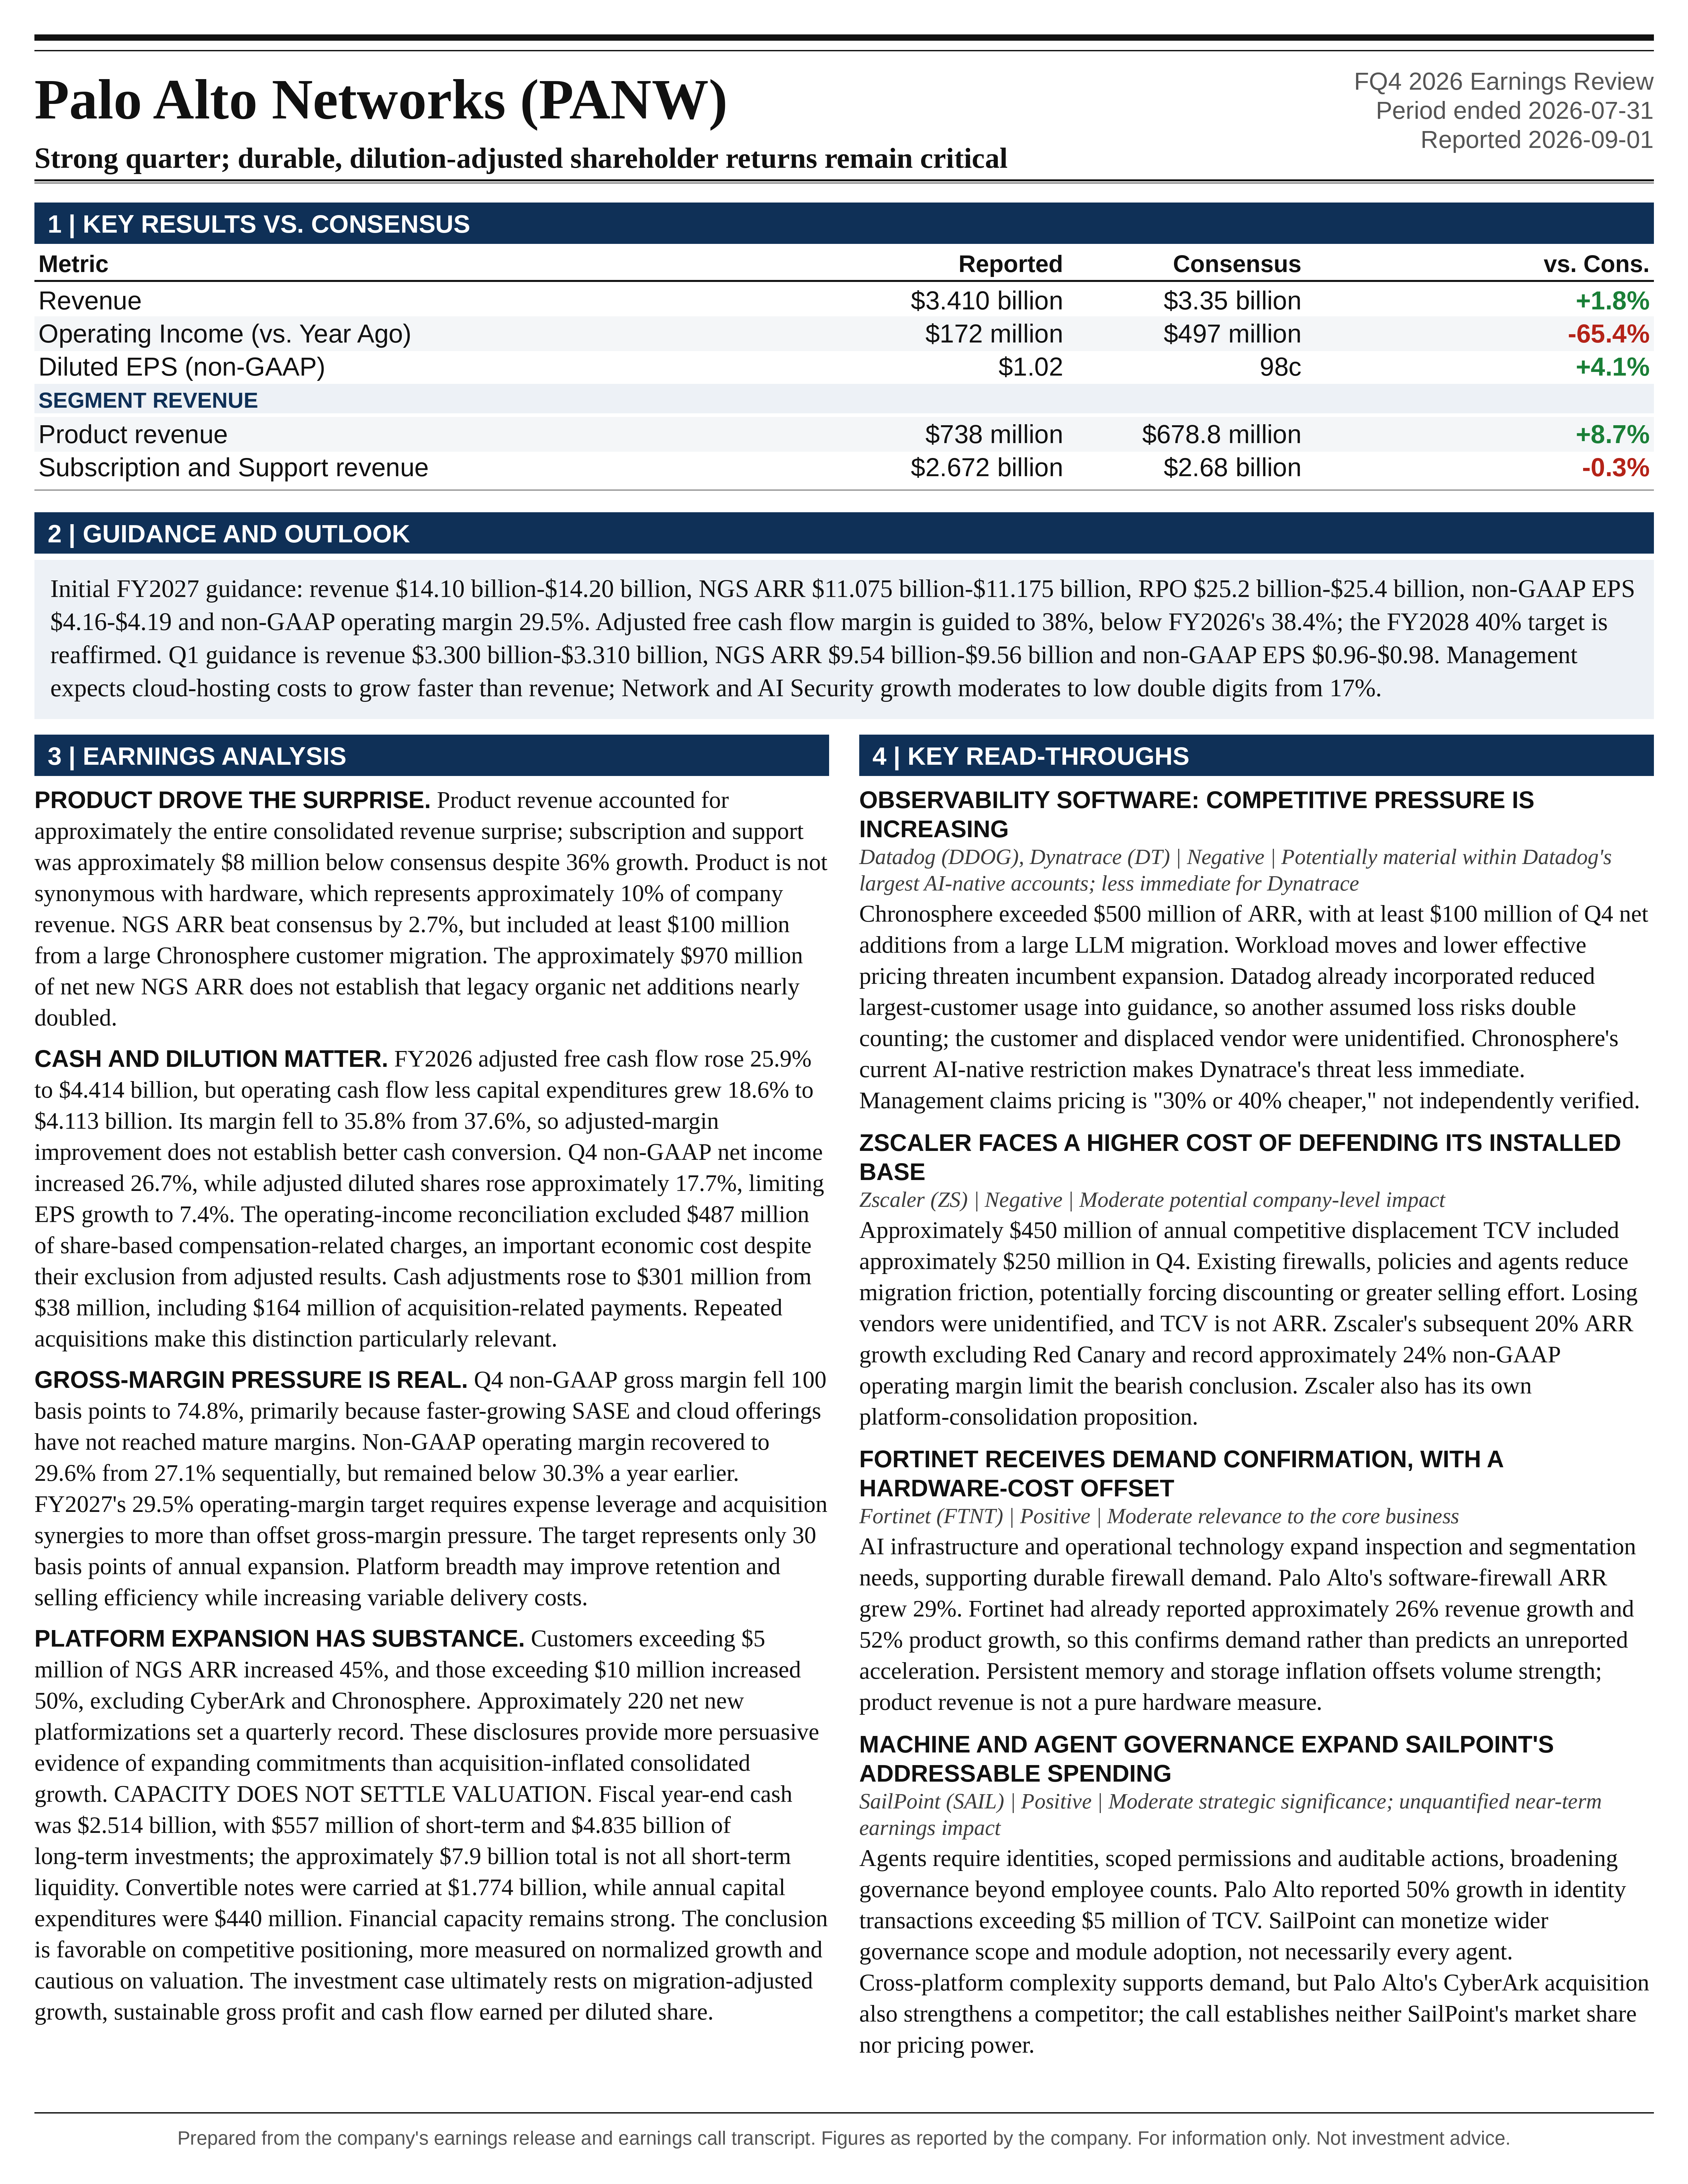
Revenue reached $3.410 billion, up 34.5%, next-generation security annual recurring revenue, or NGS ARR, reached $9.10 billion, up 63%, and remaining performance obligations, or RPO, reached $21.2 billion, up 34%. Approximately $970 million of net new NGS ARR represented 98% growth. Non-GAAP EPS of $1.02 exceeded the prior guidance ceiling and consensus by $0.04. However, revenue outperformance was disproportionately associated with the product category, while subscription and support revenue was slightly below the supplied consensus estimate. The ARR result was stronger than consensus, but included at least $100 million from a large customer migration to Chronosphere.
The strongest evidence supporting the platform strategy extends beyond acquisition-inflated consolidated growth. Competitive SASE displacements reached approximately $450 million of fiscal 2026 total contract value, including approximately $250 million in Q4 alone. Customers contributing more than $5 million of NGS ARR increased 45%, and those contributing more than $10 million increased 50%, with both comparisons excluding CyberArk and Chronosphere. Approximately 220 net new platformizations established a quarterly record. These disclosures provide more persuasive evidence of expanding customer commitments than the consolidated 63% ARR growth rate in isolation.
Initial fiscal 2027 guidance exceeded the supplied consensus across the principal financial metrics, but the magnitude of the outperformance was moderate. Revenue guidance midpoint of $14.15 billion exceeded consensus by 2.2%, while NGS ARR midpoint of $11.125 billion exceeded consensus by 2.0%. Non-GAAP EPS midpoint of $4.175 exceeded consensus by 1.6%, but implies only 8.7% annual growth, materially below the 23.3% revenue growth implied by the revenue midpoint. Acquisition-related share issuance and the annualization of the enlarged share base are important reasons that aggregate business growth is not translating proportionately into per-share earnings growth.
Cash generation remains substantial, although the distinction between adjusted and unadjusted free cash flow is economically important. Fiscal 2026 adjusted free cash flow increased 25.9% to $4.414 billion, with a 38.4% margin. Operating cash flow less capital expenditures increased 18.6% to $4.113 billion, with a margin of 35.8%, down from 37.6%. Consequently, the reported improvement in adjusted cash margin does not establish improvement in cash conversion after all capital spending and acquisition-related cash payments.
The investment conclusion is therefore favorable on competitive positioning, more measured on normalized growth and cautious on valuation. Bloomberg’s September 2 notice reported an intraday share-price decline of as much as 9.5%. That reaction is consistent with an elevated expectations hurdle, but it does not establish deterioration in the underlying franchise. Conversely, beating published consensus does not establish that the shares offer attractive prospective returns.
RESULTS RELATIVE TO PRIOR GUIDANCE AND CONSENSUS
The June 2 guidance provides a clear baseline for evaluating execution. Q4 revenue had been guided to $3.345 billion-$3.355 billion. Actual revenue exceeded the midpoint by $60 million, or 1.8%, and the ceiling by $55 million, or 1.6%. NGS ARR had been guided to $8.90 billion-$8.95 billion. The $9.10 billion result exceeded the midpoint by $175 million, or 2.0%, and the ceiling by $150 million, or 1.7%. RPO exceeded the $20.9 billion-$21.0 billion guidance range by $200 million at the upper end. EPS exceeded the $0.96-$0.98 range by $0.04 at the upper end.
Against the supplied Bloomberg consensus, revenue exceeded expectations by 1.8%, NGS ARR by 2.7%, RPO by 1.2% and adjusted EPS by 4.1%. These were meaningful positive surprises, although not sufficiently large to establish an exceptional change in the underlying earnings trajectory. The difference between a 2.7% ARR consensus beat and the stock’s negative reaction illustrates the importance of separating published estimates from investor expectations embedded in valuation.
Revenue composition was less uniformly strong than the headline result. Product revenue of $738 million exceeded the $678.8 million estimate by $59.2 million, or 8.7%. Subscription and support revenue of $2.672 billion was approximately $8 million below the $2.68 billion estimate. The separately supplied category estimates do not sum exactly to consolidated consensus, but the directional conclusion is clear: product revenue accounted for approximately the entire consolidated revenue surprise. Subscription and support nevertheless grew 36%, so the small consensus shortfall should not be confused with weak absolute growth.
Product revenue should not be equated with hardware revenue. Product represented approximately 21.6% of Q4 revenue, whereas management indicated that hardware represents approximately 10% of company revenue. Software-related product revenue is therefore material. The result cannot be accurately characterized as a purely hardware-driven beat, although it also does not support describing the revenue surprise as predominantly recurring subscription outperformance.
The official financial statements correct an important transcript discrepancy. Fiscal 2026 revenue was $11.480 billion versus $9.221 billion, representing 24.5% growth, not the 20% stated in the supplied transcript. Revenue exceeded the prior annual guidance midpoint by $60 million. Annual non-GAAP EPS of $3.84 exceeded the $3.77-$3.79 guidance range, while the 29.2% operating margin reached the upper end of the prior 28.9%-29.2% range. At reported precision, annual operating margin met the ceiling rather than exceeding it. Adjusted free cash flow margin of 38.4% exceeded the prior 37.5% outlook by 90 basis points.
Regional growth was broad, with the Americas increasing 33%, EMEA 39% and JPAC 34%. This reduces concern that the quarter depended on a single geographic market. However, the figures are reported growth rates, without acquisition-adjusted or constant-currency bridges, and therefore do not independently establish equivalent underlying demand acceleration across regions.
ARR, BOOKINGS AND BACKLOG QUALITY
The approximately $970 million of quarterly net new NGS ARR is the most important growth disclosure, but also the metric requiring the most careful normalization. The result demonstrates the enlarged company’s ability to generate substantial incremental contracted recurring revenue. It does not establish that the legacy business nearly doubled its organic net additions. Both acquired businesses were included in the current-period operating perimeter, and management specifically identified a large Chronosphere migration.
The CFO stated that Q4 net new ARR included a substantial contribution from “a large LLM customer migrating to Chronosphere from an incumbent vendor.” The disclosed magnitude establishes a minimum contribution of $100 million, equivalent to at least approximately 10% of quarterly net additions. The exact amount was not provided, so the remaining net additions cannot be calculated precisely. Describing the entire $970 million as broad-based, repeatable quarterly production would overstate the evidence.
This migration is not necessarily low-quality revenue. A large recurring contract can represent a valuable and durable addition to the installed base. The distinction is that a recurring ARR stock can arise from an unusually concentrated, nonrepeatable implementation event. Subsequent renewal and usage may persist, while the initial migration-related increase in net new ARR does not recur. Contract duration, minimum commitments, consumption exposure, renewal economics and customer concentration therefore matter more than simply labeling the contribution temporary.
RPO provides a complementary positive signal. Total RPO reached $21.2 billion and current RPO reached $9.3 billion, both up 34%. Management also stated that contract durations remained steady. Matching growth in current and total RPO, alongside stable duration, reduces the likelihood that the backlog increase was driven principally by longer contract terms. It does not eliminate acquisition effects, but it strengthens the inference that near-term contracted revenue visibility improved alongside total backlog.
Current RPO represented approximately 43.9% of total RPO and approximately 65.7% of the fiscal 2027 revenue guidance midpoint. This is not a direct revenue coverage guarantee, because recognition timing and revenue outside the existing backlog matter, but it provides substantial visibility. The company’s statement that pro forma bookings growth accelerated for a 2nd consecutive quarter is also constructive. The absence of a quantified pro forma growth bridge limits the ability to measure the acceleration or compare it rigorously with peers.
Deferred revenue requires separate treatment. The $7.75 billion figure in the Bloomberg notice corresponds to current deferred revenue, not total deferred revenue. Official financial statements show $7.747 billion current and $7.009 billion long-term deferred revenue, totaling $14.756 billion. Total deferred revenue increased approximately 15.7%, materially slower than RPO. This is directionally consistent with increasing importance of contracted revenue that has not yet been billed, although acquisition accounting and billing arrangements also affect the comparison. The supplied analyst comment regarding deferred revenue and billings should not be converted into a quantified miss without a matching definition and consensus series.
PLATFORMIZATION: STRONGER EVIDENCE, IMPORTANT DEFINITIONAL LIMITATIONS
Approximately 220 net new platformizations increased 44% and brought total platformizations to approximately 2,500. The company remains on track toward more than 4,000 by fiscal 2030. More than 65% of NGS ARR is associated with platformized customers, indicating that platform adoption is already economically material rather than a peripheral sales initiative.
The definition is more nuanced than a count of unique enterprises standardizing their entire security estate. Platformizations are counted across the largest 5,000 customers by ARR, and each customer can contribute as many as 5 platformizations. Qualification can reflect an enterprise license agreement, an active XSIAM contract or specified ARR thresholds in particular product categories. Consequently, additional platformizations can represent deeper adoption within an existing customer rather than a newly acquired enterprise.
The reported retention statistic also has a narrower scope than the prepared remarks might suggest. Management stated that net revenue retention exceeded 120% for the platformized cohort. The presentation footnote excludes identity and observability because comparable historical information is unavailable. This is strong expansion evidence for the established platformized business, but it is not a company-wide retention statistic and does not validate retention in the newly acquired businesses.
The large-customer data strengthens the platformization argument. Customers exceeding $5 million of NGS ARR reached 223, up 45%, while those exceeding $10 million reached 78, up 50%. These comparisons explicitly exclude CyberArk and Chronosphere. They therefore provide evidence of larger commitments within the preexisting business perimeter. The categories overlap and should not be added together.
The $126 million telecommunications agreement, $72 million technology-services agreement and $53 million payments-platform agreement demonstrate the commercial relevance of bundled architecture. However, transaction values are not annual revenue or ARR, and the call did not disclose the associated duration, gross margin or implementation costs. Large contract values support strategic engagement, but do not independently establish superior unit economics.
NETWORK AND AI SECURITY: SHARE GAINS WITH A MORE MODERATE FORWARD REVENUE OUTLOOK
Network and AI Security generated $8.354 billion of fiscal 2026 revenue, up 17%, and $2.331 billion in Q4. The platform remains the largest determinant of consolidated revenue performance. Its scale means that even modest changes in growth or profitability can outweigh much higher percentage growth in smaller emerging products.
The SASE displacement data was particularly strong. The CFO clarified: “it was $200 million year-to-date at Q3 and it’s $450 million for the full year.” The implied Q4 contribution was approximately $250 million, greater than the cumulative amount recorded during the preceding 3 quarters and approximately 55.6% of the full-year total. The $450 million clarification is more precise than the prepared remarks’ reference to more than $400 million.
Full-year SASE bookings increased approximately 40%. The presentation additionally showed Prisma Access bookings growth above 30%, SD-WAN bookings growth above 80% and secure-browser licenses exceeding 2 times the prior-year level, reaching approximately 15 million. Software firewall ARR grew 29%. Together, these disclosures support a broader network-security expansion rather than a narrow appliance replacement cycle.
The competitive mechanism is credible. Customers already using Palo Alto firewalls, management tools and endpoint connectivity can adopt SASE within a familiar policy and operating environment. Management’s explanation emphasized that replacing the SASE component can be simpler than maintaining a separate vendor architecture. This can reduce migration friction and customer operating costs, while increasing Palo Alto’s share of wallet.
The economic qualification is that consolidation can also require discounts, payment concessions and overlapping deployment periods. Competitive displacement TCV does not disclose the revenue recognized in the current period, the cost of winning the account or the profitability of the replacement contract. The acceleration is a meaningful commercial signal, but not sufficient evidence of pricing power.
Fiscal 2027 Network and AI Security growth was described as low double digits, compared with 17% in fiscal 2026. This is a more moderate outlook than the AI-related demand commentary might imply. Acquisition timing and business mix complicate direct comparison, but the largest platform is not being explicitly guided to a major revenue acceleration. Management’s ambition to become the SASE leader over 5-7 years should be treated as a strategic objective, not a near-term financial forecast.
PRISMA AIRS: EARLY COMMERCIAL VALIDATION, NOT YET A PURE CONSUMPTION SIGNAL
Prisma AIRS surpassed $100 million of ARR within approximately 4 quarters of general availability. The earnings presentation specifies approximately $120 million and more than 800 customers, with customer count increasing more than 2 times sequentially. This is meaningful early evidence that AI security is becoming a monetizable product category.
At approximately $120 million, AIRS represented roughly 1.3% of total NGS ARR. Its direct contribution remains small relative to the consolidated business, but its strategic importance is greater because it can support firewall, identity, endpoint and security-operations adoption. The payments-platform transaction included nearly $10 million allocated to AIRS, illustrating its ability to participate in larger architecture decisions.
The presentation’s measurement footnote materially qualifies the interpretation. AIRS ARR is based on software next-generation firewall credits allocated to AIRS on booked quotes. Customers may subsequently consume those credits across several eligible firewall products and services. Customer count similarly reflects booked quotes that include AIRS.
Accordingly, the approximately $120 million should not be interpreted as independently verified, exclusive AIRS consumption at that run rate. It is evidence of contractual allocation and customer purchasing intent within a flexible credit framework. Actual utilization, renewal behavior, dedicated pricing and incremental spending beyond existing firewall commitments remain important tests of the product’s standalone economic value.
Agentic endpoint security exceeded 100 logos, approximately 2.5 times the level at the Koi acquisition close. The commercial opportunity is plausible: agents accessing local files, development tools and credentials can create security requirements that conventional endpoint monitoring does not fully address. However, no revenue contribution, deployment depth or independently verified efficacy comparison was provided. Logo growth establishes early adoption, not yet a mature financial engine.
CORTEX AND XSIAM: DATA CONSOLIDATION AS A COMMERCIAL ADVANTAGE
Cortex generated $1.920 billion of fiscal 2026 revenue, up 25%, including $586 million in Q4. Fiscal 2027 modeling points call for approximately 30% growth. This represents the clearest indicated acceleration among the major platforms, although observability acquisition annualization remains part of the comparison.
XSIAM exceeded $700 million of ARR, increased approximately 70% and surpassed approximately 1,000 customers. Its significance lies in the potential combination of SIEM replacement, security-operations consolidation and expansion into adjacent modules. Management stated that most customers use multiple modules, including exposure management and cloud security.
The economic logic is attractive where the same telemetry can support additional use cases without requiring a separate deployment. Management explained that expansion can involve “querying existing data in new ways.” If supported by pricing and adoption, this architecture can lower incremental selling and implementation costs while improving retention. The countervailing risk is that data processing, storage, model inference and retention requirements create substantial variable costs.
Management reported mean time to respond below 10 minutes for customers standardizing on XSIAM, compared with much longer industry response times. These claims support the product narrative but were not accompanied by a matched customer sample, standardized incident definitions or independent outcome validation. Faster response is economically valuable, but the magnitude of improvement cannot be treated as a controlled comparison.
XSIAM’s competitive opportunity is broader than replacing a single SIEM vendor. It can absorb spending on orchestration, exposure management, cloud security and operational labor. The corresponding execution challenge is that a broader platform requires sustained integration quality and credible functionality across several specialized workflows. Unified data is an advantage only if the resulting detection and response decisions remain reliable.
OBSERVABILITY: EXCEPTIONAL SCALING WITH CUSTOMER AND PRODUCT CONCENTRATION
Observability ARR exceeded $500 million and more than doubled after the Chronosphere acquisition closed in fiscal Q2. Management described this as its fastest post-acquisition scaling. The combination of rapid expansion, a $20 million agreement with an AI inference provider and cross-selling alongside XSIAM supports the strategic rationale for entering observability.
The large LLM migration materially concentrates the near-term growth profile. Management expects the remaining migration to contribute through Q1 fiscal 2027, with a smaller addition than in Q4. This creates both customer concentration risk and a forecasting discontinuity once the migration finishes. A strong installed ARR base can coexist with sharply lower sequential net additions.
Cross-selling is encouraging but should be interpreted correctly. Management stated that XSIAM contributed to approximately 50% of new Chronosphere logos during the quarter. That indicates distribution leverage, but it does not mean that 50% of incremental ARR came from cross-selling. Large accounts can dominate revenue even when a broader set of smaller customers drives logo growth.
Management asserted that Chronosphere is “30% or 40% cheaper than any of the leading incumbent observability solutions.” This is potentially important in an environment of rapidly increasing telemetry volumes. However, the call did not provide a controlled comparison of workload, retention, query performance, support requirements and contract structure. Lower price can reflect better architecture, promotional economics or a different feature set. The shareholder benefit depends on achieving attractive gross profit after the discount.
The most important competitive qualification came directly from management: “For now, we’re restricting Chronosphere just to AI-native sales because it’s where it’s most suited.” Broader enterprise competitiveness was expected over the following 6 months as Embrace and synthetics capabilities expand the offering. Current traction is therefore strongest in a particular workload cohort. Comprehensive enterprise parity remains a roadmap objective.
The transcript’s statement that Chronosphere was acquired at $85 million of ARR conflicts with the original November 2025 acquisition announcement, which disclosed more than $160 million of ARR as of September 2025. The $85 million figure should not be used to calculate post-acquisition growth. The more defensible current-period statement is management’s disclosure that observability ARR more than doubled since closing.
IDIRA: REVENUE SYNERGIES ARE EMERGING, BUT REPORTED GROWTH WILL OVERSTATE ECONOMIC ACCELERATION
Idira generated $614 million of reported fiscal 2026 revenue, including $336 million in Q4. On a pro forma full-year basis, revenue was approximately $1.26 billion, up 21%. The distinction is essential: the reported figure includes only the post-acquisition period, whereas the pro forma figure includes the comparable full-year business.
Fiscal 2027 Idira revenue of approximately $1.5 billion implies approximately 19% growth against the pro forma base, consistent with management’s high-teens to 20% modeling range. Against reported fiscal 2026 revenue, the same forecast implies approximately 144% growth. The latter is principally an acquisition-timing comparison and is not an appropriate measure of demand acceleration.
Idira’s $886 million increase from reported fiscal 2026 revenue to the fiscal 2027 modeling point accounts for approximately 33% of the consolidated revenue increase implied by annual guidance. This illustrates how material acquisition annualization remains to next year’s reported growth. Certificate lifecycle management is also classified within Network and AI Security, not Idira, so Idira is not synonymous with the entirety of the acquired CyberArk revenue perimeter.
The presentation identifies more than 200 CyberArk new-logo wins from the existing Palo Alto installed base following the February 11 acquisition close. This is a cumulative post-close figure, not necessarily 200 wins confined to Q4. More than 400 shared sales leads and 50% growth in transactions exceeding $5 million of TCV provide further evidence of commercial coordination.
Management stated that synergy execution remains 3-6 months ahead of plan and described the potential for approximately 1,000 basis points or more of acquired-business margin improvement. This supports the cost-integration case, but no complete dollar bridge or acquired-business profit reconciliation was provided. The stronger acquisition thesis requires both sustainable revenue growth and demonstrable margin improvement, rather than relying exclusively on cost reduction.
The agentic identity opportunity is strategically relevant because autonomous systems require scoped privileges, credential management and auditable authorization. However, growth in agent counts does not automatically translate proportionately into paid identities or ARR. Bundling, identity reuse, short-lived credentials and customer pricing resistance could limit revenue per agent. Modern PAM introduces an additional upsell opportunity, but adoption and pricing evidence are still early.
FISCAL 2027 GUIDANCE AND THE IMPLIED OPERATING REQUIREMENTS
Q1 fiscal 2027 revenue guidance is $3.300 billion-$3.310 billion, NGS ARR is $9.54 billion-$9.56 billion, RPO is $20.8 billion-$20.9 billion and non-GAAP EPS is $0.96-$0.98. Relative to the supplied consensus, the midpoints exceed expectations by approximately 3.0%, 3.8%, 2.7% and 3.2%, respectively.
The Bloomberg notice contains a period-classification error: its Q1 forecast section repeats the full-year NGS ARR range of approximately $11.08 billion-$11.18 billion. The correct Q1 range is $9.54 billion-$9.56 billion, verified in the company’s release and presentation. Using the erroneous range would materially exaggerate the near-term guidance surprise.
Full-year fiscal 2027 guidance is $14.10 billion-$14.20 billion revenue, $11.075 billion-$11.175 billion NGS ARR, $25.2 billion-$25.4 billion RPO, 29.5% non-GAAP operating margin, $4.16-$4.19 non-GAAP EPS and 38% adjusted free cash flow margin. These are initial fiscal 2027 forecasts, not increases to an established annual guidance range. Exceeding consensus should therefore be distinguished from management raising prior guidance.
At the midpoint, fiscal 2027 requires $2.025 billion of net new NGS ARR. Q1 implies approximately $450 million. Management expects 60%-61% of annual net additions in the 2nd half, equivalent to approximately $1.215 billion-$1.235 billion. The residual calculation implies approximately $340 million-$360 million of net additions in Q2. This is a mechanical implication of the annual and seasonal guidance, not a separately issued quarterly forecast.
That profile is important because Q2 net additions could decline sequentially without indicating underperformance. Q1 is unusually elevated by the remaining Chronosphere migration. The more revealing test will be whether subsequent net additions excluding that migration support the annual objective, rather than whether each quarter exceeds the preceding quarter.
The decline from 63% reported ARR growth in Q1 to 22%-23% at fiscal year-end should not be interpreted as an equivalent organic growth collapse. Acquisitions enter the comparison base during the year. However, the absence of a complete pro forma ARR history prevents precise separation of acquisition anniversary effects from underlying growth.
Revenue guidance implies approximately $10.845 billion for Q2-Q4 combined, or 20.4% growth against the corresponding prior-year periods. This is lower than Q1’s 33%-34% reported growth, again reflecting both acquisition comparisons and the underlying platform outlook. The largest business is modeled at low-double-digit growth, Cortex at approximately 30% and Idira at approximately 19% on a comparable basis.
The $20 billion fiscal 2030 NGS ARR target requires approximately 21.8% annual compound growth from fiscal 2026. Following the fiscal 2027 midpoint, approximately 21.6% annual compound growth would still be required through fiscal 2030. The initial annual guidance is therefore broadly consistent with the long-term target, but does not materially reduce the future growth requirement. Sustaining a similar percentage growth rate will require progressively larger annual dollar additions.
PROFITABILITY: RECOVERING FROM INTEGRATION, BUT GROSS-MARGIN PRESSURE IS REAL
Q4 non-GAAP gross margin was 74.8%, down 100 basis points. Full-year gross margin was 75.8%, down 60 basis points. Management attributed the decline primarily to faster growth in SASE and other cloud-delivered offerings that have not reached mature gross margins. Fiscal 2027 cloud-hosting costs are expected to grow faster than revenue.
This is not merely an accounting issue. Even after excluding acquisition amortization and other adjustments, the business is experiencing gross-margin pressure. Higher cloud and data-processing exposure changes the economics relative to a predominantly software-license and appliance model. Platform breadth may improve retention and selling efficiency while simultaneously increasing the variable cost of delivering service.
Q4 non-GAAP operating margin recovered to 29.6% from 27.1% in Q3, consistent with integration progress and seasonal scale. However, it remained below 30.3% in the prior-year quarter. Fiscal 2026 operating margin increased to 29.2% from 28.8%. The correct interpretation is a substantial sequential recovery alongside annual expansion, not uniformly improving quarterly margins.
The fiscal 2027 operating-margin target of 29.5% represents only 30 basis points of annual expansion. At the revenue midpoint, it implies approximately $4.174 billion of operating income, up 24.4%. Delivering that result requires operating-expense leverage and acquisition synergies to more than offset gross-margin pressure.
The sensitivity is meaningful. A 100-basis-point operating-margin shortfall on $14.15 billion of revenue would reduce pretax profit by approximately $142 million. At the disclosed 22% non-GAAP tax rate and midpoint share count, the approximate EPS effect would be $0.13. This is substantial relative to the $0.065 difference between EPS guidance midpoint and supplied consensus.
GAAP results present a substantially different picture. Q4 GAAP operating income was $172 million, down from $497 million, and the company recorded a $282 million net loss. The operating-income reconciliation included $487 million of share-based compensation-related charges, $281 million of acquired-intangible amortization, $68 million of acquisition-related costs and $3 million of litigation-related charges. A further $524 million fair-value adjustment involving convertible notes and capped calls affected the net-income reconciliation.
The GAAP loss should not be interpreted as an equivalent cash loss. Nevertheless, the excluded items are not economically interchangeable. Amortization reflects acquisition accounting, transaction expenses can decline, and fair-value movements can be volatile, but share-based compensation remains an important cost of operating the business. The prior-year quarter also benefited from a $142 million acquisition-related credit, making the GAAP operating-income decline an imperfect measure of underlying deterioration.
DILUTION AND CASH FLOW: THE SHAREHOLDER RETURN BRIDGE
Q4 non-GAAP net income increased 26.7%, while adjusted diluted shares increased approximately 17.7%, from 707 million to 832 million. EPS consequently increased only 7.4%. The dilution is not a secondary detail: it materially changes the economic meaning of the company’s growth.
Fiscal 2027 guidance assumes 844 million-847 million diluted shares, compared with a fiscal 2026 adjusted weighted-average share count of 764 million. The midpoint increase is approximately 10.7%. Thus, substantial growth in aggregate profit is required merely to produce high-single-digit per-share earnings growth.
Adjusted free cash flow has the same distinction. Fiscal 2027 guidance implies approximately $5.377 billion at the revenue midpoint, up 21.8%. Dividing by the respective adjusted diluted share counts produces an illustrative increase from approximately $5.78 to $6.36 per share, or 10.1%. This calculation is an analytical per-share cash-flow comparison, not a company-reported metric.
Fiscal 2026 operating cash flow was $4.553 billion and capital expenditures were $440 million, producing $4.113 billion of free cash flow before the company’s additional adjustments. Adjusted free cash flow added back $301 million, including $91 million for headquarters land, $42 million for certain corporate assets, $164 million of acquisition-related payments and $4 million of litigation payments. The comparable prior-year adjustments totaled $38 million.
The increase in adjustments explains why adjusted free cash flow grew faster than operating cash flow less capital expenditures. Neither measure should be discarded. Adjusted free cash flow helps identify recurring operating capacity, while the unadjusted measure captures the cash actually remaining after the specified expenditures. Repeated acquisitions make the distinction particularly relevant because transaction-related cash spending may recur even if each transaction is individually nonrecurring.
Management stated that annual billing increased from 6% of bookings in fiscal 2020 to approximately 30% in fiscal 2026, compared with 27% in fiscal 2025. Slowing movement toward annual billing reduces a historical headwind from collecting less cash upfront. Stabilization improves predictability, but does not guarantee that billing mix cannot change further or that growth will convert uniformly into cash.
Fiscal 2027 adjusted free cash flow margin guidance of 38% is 40 basis points below fiscal 2026. The fiscal 2028 target of 40% remains unchanged, implying a subsequent 200-basis-point improvement. The current outlook therefore involves near-term margin moderation followed by a more substantial improvement, rather than a smooth annual progression.
The balance-sheet description also requires correction. The official statements show $2.514 billion of cash, $557 million of short-term investments and $4.835 billion of long-term investments. The approximately $7.9 billion total includes long-term investments, rather than consisting entirely of cash and short-term securities. Convertible senior notes were carried at $1.774 billion. Financial capacity remains strong, but the liquidity composition and convertible obligations should be preserved in valuation and acquisition analysis.
AI SECURITY AND AUTONOMOUS OPERATIONS: ATTRACTIVE DIRECTION, UNEVEN MONETIZATION
Management’s central strategic assertion was: “Platformization is the only viable strategy for real-time defense, fighting AI with AI.” The underlying argument is that faster attacks require coordinated telemetry, identity controls, policy enforcement and remediation. This is commercially coherent, particularly where fragmented systems introduce latency and operational complexity.
The claim that a single-vendor platform is the only viable architecture is stronger than the evidence supports. Federated systems, interoperability standards, specialist products and cloud-native controls can also support rapid response. Platform consolidation can reduce integration costs, but it can increase vendor concentration, correlated failure risk and dependence on a single supplier’s roadmap. Technical consolidation and commercial consolidation are related, not identical.
The most credible monetization paths are tied to observable activity: more infrastructure requiring segmentation, more traffic requiring inspection, more machine identities requiring authorization and more telemetry requiring processing. However, AI spending does not translate proportionately into security revenue. Native cloud controls, improved model efficiency, telemetry optimization and customer budget constraints can all reduce the vendor revenue captured per unit of underlying AI activity.
Management’s discussion of operational technology was particularly relevant. The ability to develop and distribute firewall signatures within approximately 4 hours could provide valuable interim protection where physical systems cannot be patched quickly. This is virtual mitigation at the network layer, not remediation of the underlying vulnerability. Effectiveness depends on traffic visibility, inspection capability, exploit behavior and deployment configuration.
Management also provided an important counterweight to the more expansive demand narrative: “it’s not going to be coding agent style ARRs that we’re seeing in the AI space.” Customers still require evaluation, proof-of-concept work, budget approval, migration planning and implementation capacity. Management described transformation timelines generally measured in 1-3 years rather than a single quarter. The opportunity can be durable without producing immediate, unconstrained revenue acceleration.
Console supports the longer-term objective of automating deployment and security operations. Management’s stated aspiration was “to reduce the amount of human intervention in the act of detection, prevention, and remediation.” Successful execution could reduce implementation friction and broaden the economic value captured by the platform. It also creates risks around erroneous autonomous actions, customer authorization, accountability and operational liability.
Console closed on September 1, after the July 31 fiscal year-end, and therefore was not a contributor to fiscal Q4 results. Management described Console and Embrace as immaterial to fiscal 2027 guidance. Their near-term significance is primarily strategic and product-related rather than a direct explanation for the financial outlook.
COMPETITIVE AND CAPITAL-ALLOCATION IMPLICATIONS
The clearest competitive pressure is on standalone SASE and legacy proxy vendors where Palo Alto can replace a component while leveraging an existing firewall footprint. SIEM vendors face a related challenge from XSIAM’s integrated security-operations proposition. Observability competitors face a potentially significant threat in AI-native workloads, although the company’s broader enterprise capability remains under development.
These are directional read-throughs, not verified peer-specific revenue losses. The call did not identify the displaced providers in sufficient detail to attribute the $450 million of SASE displacement TCV or the large Chronosphere migration to a particular competitor. Likewise, comparative response-time and cost claims were management assertions rather than independently benchmarked outcomes.
The acquisition strategy has produced rapid portfolio expansion and credible early cross-selling. Management stated: “M&A is not a strategy. M&A is a consequence of stuff that we do from a product development perspective.” The investment implication is that acquisitions are likely to remain part of the response to technology shifts. This can improve speed to market, but makes recurring integration capability and acquisition discipline central components of the valuation.
Revenue growth, acquired-business margin expansion and successful product integration do not alone establish attractive acquisition returns. Purchase consideration, equity dilution, retention compensation, integration spending and the durability of acquired revenue must also be considered. The enlarged franchise may be strategically stronger while still requiring several years to demonstrate satisfactory returns on the capital committed.
VALUATION, SCENARIOS AND INVESTMENT ACTION
The supplied Bank of America and RBC price targets of $420 and $434 imply approximately 100.6 times and 104.0 times fiscal 2027 EPS guidance midpoint. Using the illustrative $6.36 of adjusted free cash flow per diluted share, they imply adjusted free cash flow yields of approximately 1.51% and 1.47%. These are calculations based on contemporaneous analyst targets, not current trading multiples.
Such valuations require confidence in durable growth well beyond fiscal 2027, favorable acquisition outcomes and sustained cash conversion. The initial forecast of 8.7% EPS growth and approximately 10.1% adjusted free cash flow growth per share does not independently support those multiples. The valuation case depends on future acceleration, long growth duration or both.
Multiple risk remains significant even if execution meets guidance. An 8.7% increase in earnings combined with a 15% contraction in the earnings multiple would produce an approximately 7.6% share-price decline. This illustrates why a strong business quarter can coexist with disappointing equity returns.
A base case with a 55% analytical probability assumes fiscal 2027 revenue near $14.15 billion, NGS ARR near $11.125 billion, operating margin near 29.5% and adjusted free cash flow near $5.38 billion. Cross-selling and SASE displacement continue, but acquisition anniversary effects and the completion of the large migration reduce headline growth. Under this outcome, per-share growth remains around the high-single-digit to low-double-digit range, making entry valuation the dominant determinant of returns.
A bull case with a 25% analytical probability assumes revenue of approximately $14.5 billion-$14.7 billion, NGS ARR of approximately $11.6 billion-$11.8 billion, operating margin of approximately 30.5%-31% and adjusted free cash flow margin near 39%. This requires broader AIRS utilization, successful enterprise expansion in observability, sustained SASE displacement and acquisition synergies exceeding gross-margin pressure. The key evidence would be repeated net-addition strength after the large migration finishes, rather than another migration-assisted headline beat.
A bear case with a 20% analytical probability assumes revenue of approximately $13.5 billion-$13.8 billion, NGS ARR of approximately $10.6 billion-$10.8 billion, operating margin of approximately 28%-29% and adjusted free cash flow margin of approximately 36%-37%. Potential causes include slower implementation, AI-native customer optimization, weaker observability expansion, more aggressive discounting or integration costs that persist longer than expected. Equity downside could materially exceed the earnings shortfall if valuation also contracts. These scenario probabilities and ranges are analytical judgments, not management forecasts.
The appropriate stance is HOLD for an existing modest position and WATCHLIST for incremental capital, rather than an indiscriminate purchase following the earnings-related decline. A new position requires either a valuation that offers adequate protection against slower per-share growth or evidence that fiscal 2027 estimates are materially understated. As an illustrative entry discipline, a 2% yield on guided adjusted free cash flow per share corresponds to approximately $318. This is a selected risk hurdle, not an independently established fair-value target, and still requires scrutiny of cash adjustments and dilution.
For a conditional new position, initial exposure of approximately 0.5%-1.0% of portfolio NAV would limit dependence on an unproven growth acceleration. A 12% price stop from entry implies a planned portfolio loss of approximately 6-12 basis points before gap and execution risk. Increasing exposure beyond that level would require evidence from at least 2 reporting periods that net additions remain strong after the migration ends and that cash generation translates into per-share growth. Actual sizing remains dependent on existing holdings, liquidity and aggregate factor exposure.
The principal catalysts are Q1 delivery against the $9.54 billion-$9.56 billion ARR range, the Q2 comparison after migration benefits diminish, broader Chronosphere enterprise capability over approximately 6 months and progress toward the fiscal 2028 cash-margin target. The most important thesis-break conditions are a material ARR outlook reduction unrelated to measurement changes, persistent operating-margin underperformance, deterioration in large-customer expansion, weak renewal or utilization evidence in AI products and continued dilution that substantially absorbs aggregate cash-flow growth.
Portfolio diversification across security categories should not be confused with diversification across economic risks. The company is increasingly exposed to AI infrastructure spending, cloud consumption, large AI-native customers and long-duration software valuations. Those exposures can correlate with existing AI and cloud holdings even as Palo Alto’s product portfolio becomes broader. The quarter strengthens the franchise thesis, but the investment case ultimately rests on migration-adjusted growth, sustainable gross profit and cash flow earned per diluted share.
SOURCE BASIS
Financial comparisons use the September 1, 2026 earnings call, the company’s fiscal Q4 and fiscal 2026 earnings release and presentation, the June 2, 2026 earnings release, the original Chronosphere acquisition announcement, and the supplied September 2 Bloomberg notice and analyst commentary. Formal financial tables and explicit management clarifications take precedence where the supplied transcript or notice contains inconsistent figures. Management’s technical, competitive and market-size assertions are distinguished from independently established financial results.
COMPANY EMPLOYEES ON THE CALL
• Nikesh Arora, Chairman and Chief Executive Officer. • Dipak Golechha, Executive Vice President and Chief Financial Officer. • Hamza Fodderwala, Senior Vice President, Investor Relations and Strategic Finance.
RESEARCH ANALYSTS ON THE CALL
• Rob Owens, Piper Sandler. • Brian Essex, JPMorgan. • Saket Kalia, Barclays. • Fatima Boolani, Citi. • Matthew Hedberg, RBC Capital Markets. • Michael Turrin, Wells Fargo. • Gray Powell, BTIG. • Meta Marshall, Morgan Stanley. • Brad Zelnick, Deutsche Bank.
Key Read-Throughs
KEY READ-THROUGHS FROM PALO ALTO NETWORKS’ Q4 FISCAL 2026 EARNINGS CALL
Palo Alto Networks’ results indicate that AI-related security spending is expanding, but the benefits are being distributed unevenly. The most actionable implications are increased competitive pressure on standalone SASE and observability vendors, stronger demand for network enforcement and machine-identity governance, and additional consumption flowing to cloud infrastructure providers. The central distinction is between market expansion and vendor-level monetization: more traffic, identities and telemetry can increase total demand while consolidation, lower effective pricing and customer migrations impair individual suppliers. Several peer results already corroborate the demand environment, so Palo Alto’s disclosures should not be treated as entirely new information or as justification for duplicating previously recognized customer losses. Country labels below denote corporate domicile. Magnitudes describe fundamental business exposure, not predicted share-price movements.
OBSERVABILITY SOFTWARE: COMPETITIVE PRESSURE IS INCREASING, BUT CUSTOMER-LOSS RISK MUST NOT BE COUNTED TWICE (READ-THROUGH 1)
Affected companies: Datadog, Inc. (DDOG: United States) and Dynatrace, Inc. (DT: United States). Direction and magnitude: negative for competitive positioning and prospective revenue captured per workload. The impact is potentially material within Datadog’s largest AI-native accounts, but less immediate for Dynatrace’s broader enterprise franchise. The call does not establish a specific revenue loss for either company.
Supporting evidence: Chronosphere’s observability ARR exceeded $500 million and more than doubled after its acquisition closed. Palo Alto identified at least $100 million of Q4 net new ARR associated with a large LLM customer migrating from an incumbent provider. Management also stated that Chronosphere is “30% or 40% cheaper than any of the leading incumbent observability solutions.” These disclosures establish that large observability workloads are contestable, rather than permanently attached to the vendor that initially captured them.
The transmission mechanism is workload migration, reduced expansion spending and greater negotiating leverage at renewal. Observability vendors can experience rapidly growing customer telemetry without proportionate revenue growth if customers move selected workloads, optimize ingestion or secure lower effective prices. Palo Alto’s ability to introduce Chronosphere through existing security relationships adds a distribution advantage: management attributed approximately 50% of new Chronosphere logos in Q4 to XSIAM-related cross-selling. That figure describes logos, not the proportion of incremental ARR, but it demonstrates a route to customer acquisition beyond standalone observability selling.
The most important qualification concerns Datadog. Its August 6 earnings call already disclosed reduced usage by its largest customer beginning in Q3 and incorporated that reduction into guidance. The customer had also renewed and continued using 17 Datadog products. Palo Alto did not identify the migrating customer or displaced vendor, so the disclosures cannot be conclusively linked. Even if they relate to the same customer, subtracting another assumed loss from Datadog’s existing outlook would risk double counting. Datadog’s 36% Q2 revenue growth also contradicts a blanket interpretation of deteriorating observability demand.
For Dynatrace, the competitive threat is more delayed. Palo Alto explicitly stated: “For now, we’re restricting Chronosphere just to AI-native sales because it’s where it’s most suited,” with broader enterprise competitiveness expected over approximately 6 months. Dynatrace had already reported 41% organic net new ARR growth on August 5. Consequently, the call raises the future competitive hurdle rather than demonstrating that Dynatrace’s existing enterprise business is weakening.
Near-term catalysts are Dynatrace’s November 3 and Datadog’s November 4 results, particularly large-customer consumption, expansion, retention and renewal economics. The longer-duration risk is broader enterprise availability of Chronosphere during approximately the 1st half of calendar 2027. Management’s claimed cost advantage is not an independently verified pricing benchmark, but the combination of scale, migration evidence and distribution makes the competitive threat substantive.
NETWORK SECURITY AND SASE: ZSCALER FACES A HIGHER COST OF DEFENDING ITS INSTALLED BASE (READ-THROUGH 2)
Affected company: Zscaler, Inc. (ZS: United States). Direction and magnitude: negative competitive read-through, with moderate potential company-level impact and greater sensitivity in net new ARR and large-enterprise renewal economics. This is not evidence of an immediate revenue contraction.
Supporting evidence: Palo Alto reported approximately 40% fiscal 2026 SASE bookings growth and approximately $450 million of competitive displacement TCV across roughly 100 accounts. The CFO clarified that displacement TCV increased from $200 million through Q3 to $450 million for the full year. Q4 therefore contributed approximately $250 million, exceeding the preceding 3 quarters combined. Management linked these wins to integration across firewalls, SD-WAN, SASE, management software and existing endpoint agents.
The transmission mechanism is particularly important where a customer already operates Palo Alto firewalls. Palo Alto can compete for SASE spending as an incremental extension of an established architecture rather than as an entirely new deployment. Familiar policy management, existing agents and aligned contracts can reduce migration friction. Zscaler may consequently need stronger product differentiation, additional commercial flexibility or greater selling effort to defend those accounts. The financial effect can appear in lower expansion, discounting, longer sales cycles or higher acquisition costs before it becomes visible in reported revenue.
The displacement data should not be assigned entirely to Zscaler. Palo Alto did not identify the losing vendors, and TCV is not ARR or current-period revenue. The $250 million quarterly increase therefore cannot be translated directly into a Zscaler ARR deduction. Zscaler also has its own platform-consolidation proposition and competes beyond traditional user-based access.
Subsequent evidence limits the severity of the bearish conclusion. Zscaler’s September 3 results showed 20% ARR growth excluding Red Canary, 17% growth in net new ARR on that basis and a record approximately 24% non-GAAP operating margin. Those results occurred after Palo Alto’s call and are now historical evidence, not an upcoming catalyst. They demonstrate that stronger Palo Alto competition coexists with continued Zscaler growth and improving profitability.
The next trading-relevant test is Zscaler’s fiscal Q1 2027 update, particularly organic net additions, large-account expansion and whether sales efficiency continues improving. The longer-duration issue is whether Palo Alto’s firewall distribution advantage makes SASE renewals structurally more competitive. This supports a higher required return for underwriting Zscaler’s terminal margins and sustained premium growth, not an assumption that every Palo Alto win represents a Zscaler loss.
NETWORK SECURITY AND OPERATIONAL TECHNOLOGY: FORTINET RECEIVES DEMAND CONFIRMATION, WITH A HARDWARE-COST OFFSET (READ-THROUGH 3)
Affected company: Fortinet, Inc. (FTNT: United States). Direction and magnitude: positive for network-security demand durability, with moderate relevance to the core business. The incremental near-term earnings signal is smaller because Fortinet had already reported strong results. Rising component costs are a negative offset.
Supporting evidence: Palo Alto reported strong Gen 5 appliance adoption, accelerating firewall bookings and 29% software-firewall ARR growth. Management described early demand from sovereigns, neoclouds and frontier laboratories, including several transactions exceeding $1 million. The operational-technology discussion added another demand driver: network-based protection can mitigate vulnerabilities where physical systems cannot be patched quickly.
The positive transmission mechanism is broader deployment of inspection, segmentation and policy enforcement. New AI infrastructure adds environments requiring protection, while autonomous workloads increase machine-to-machine activity across existing networks. In industrial systems, the inability to remediate underlying equipment rapidly can increase the value of network controls and associated security subscriptions. Fortinet participates directly through its firewall, secure networking and operational-technology offerings.
This is a shared end-market signal, not an allocation of Palo Alto’s contracts to Fortinet. Palo Alto’s product performance can also reflect its own share gains. The stronger conclusion is that the environment supports sustained network-security spending and challenges the assumption that cloud migration necessarily removes the need for dedicated network enforcement.
Fortinet’s July 29 results had already shown approximately 26% revenue growth, 52% product revenue growth and 33% billings growth. Palo Alto’s subsequent disclosures corroborate that demand environment rather than predict an unreported acceleration in the completed quarter. The implication is more favorable for the durability of the cycle than for an immediate estimate increase.
The negative offset is component inflation. Palo Alto expects higher memory and storage costs to persist, while noting that hardware represents approximately 10% of its revenue. Fortinet’s product revenue represented approximately 38% of its Q2 revenue, although product revenue is not a pure hardware measure and the companies’ bills of materials differ. Fortinet is therefore a relevant company for monitoring the trade-off between appliance growth and component-cost absorption, without assuming Palo Alto’s cost experience transfers identically.
Near-term catalysts are Fortinet’s Q3 and Q4 2026 product growth, billings, product gross margin and pricing commentary. The longer-duration positive is expanding enforcement demand across AI infrastructure and industrial networks. The investment distinction is between a favorable volume cycle and the profitability retained from that cycle.
SECURITY OPERATIONS AND SIEM: CISCO’S SPLUNK FRANCHISE FACES A MORE CREDIBLE CONSOLIDATION CHALLENGE (READ-THROUGH 4)
Affected company: Cisco Systems, Inc. (CSCO: United States), through Splunk and adjacent security-operations offerings. Direction and magnitude: negative competitive pressure of moderate significance to the exposed security business, but limited immediate impact on the much larger consolidated company.
Supporting evidence: XSIAM exceeded $700 million of ARR, grew approximately 70% and surpassed approximately 1,000 customers. Management stated that most customers use multiple modules, including exposure management and cloud security. The call emphasized that telemetry already resident in the platform permits additional functionality through “querying existing data in new ways.”
The transmission mechanism is competition for the combined security-operations budget rather than a narrow comparison of SIEM licenses. If a customer can consolidate analytics, orchestration, exposure management and selected cloud-security functions around existing telemetry, the incumbent SIEM vendor must defend its position against a broader economic proposition. A competitor can win through reduced integration effort and operational complexity even without being superior in every standalone feature.
For Splunk, the potential effects include more demanding renewal negotiations, slower expansion, selective workload displacement and greater requirements for integration with Cisco’s broader portfolio. Palo Alto’s scale in XSIAM makes this a credible competitive issue rather than merely an early product announcement. Its observability expansion also creates the possibility of competing across security and operational telemetry within the same enterprise.
The call does not establish that XSIAM’s growth came principally from Splunk. Some deployments can replace other vendors or internal systems, and market expansion can support multiple platforms. Cisco’s August 12 results showed 14% security revenue growth, which is important counterevidence against assuming that its entire security franchise was already deteriorating. Cisco also has its own bundling, networking distribution and platform-integration advantages.
The near-term catalyst is Cisco’s fiscal Q1 2027 commentary on security orders, Splunk renewals and cloud adoption. The more consequential fundamental test spans subsequent renewal cycles: whether Cisco’s integrated proposition offsets XSIAM’s expansion sufficiently to preserve customer economics. The call raises the burden of proof for Splunk’s sustained growth and pricing, but does not justify a mechanical reduction to Cisco’s consolidated earnings.
IDENTITY SECURITY: MACHINE AND AGENT GOVERNANCE EXPAND SAILPOINT’S ADDRESSABLE SPENDING BEYOND HUMAN HEADCOUNT (READ-THROUGH 5)
Affected company: SailPoint, Inc. (SAIL: United States). Direction and magnitude: positive for long-duration demand and customer expansion opportunities, with moderate strategic significance but unquantified near-term earnings impact.
Supporting evidence: Management described autonomous agents as requiring identities, credentials, contextual permissions and auditable actions. It highlighted the problem of agents operating outside formal governance and stated that Idira ensures machine actions are “authorized, scoped, and fully auditable.” Palo Alto’s identity business also recorded larger customer commitments, including 50% growth in transactions exceeding $5 million of TCV.
The transmission mechanism for SailPoint is identity governance, not an assumption that it receives Palo Alto’s privileged-access-management contracts. SailPoint’s current machine-identity and agent-governance offerings support discovery, ownership assignment, lifecycle controls, access certification and revocation. Those functions address the operating problem described on the call: enterprises cannot reliably govern permissions if nonhuman identities lack inventory, ownership or review processes.
This expands the economic opportunity beyond employee growth. An enterprise with flat human headcount can still require additional governance capabilities as it deploys agents, service accounts and automated workflows across more applications. Potential monetization comes through broader product adoption, larger governance scope and additional modules, rather than necessarily charging separately for every agent.
Cross-platform complexity is an important consideration. Enterprises using multiple cloud providers, agent frameworks and security systems still require coherent ownership and access policies across those environments. This supports demand for governance functionality even where individual platforms provide native authorization controls.
The qualification is competitive intensity. Palo Alto’s acquisition of CyberArk and expansion of Idira mean that the same demand validation also strengthens a competitor. Agent proliferation should not be translated mechanically into SailPoint ARR growth, and the call does not establish SailPoint’s market share or pricing power. The high-conviction positive is the expansion of the governance problem and the relevance of SailPoint’s existing product capabilities.
Near-term trading relevance depends on SailPoint’s fiscal Q3 2027 evidence of paid adoption, product attachment and larger commitments. Its September 9 earnings event has already occurred and is not a future catalyst. The longer-duration shift is a governance market increasingly determined by machine activity and application connectivity rather than human seats alone.
CLOUD INFRASTRUCTURE: PALO ALTO’S HOSTING-COST PRESSURE IS A DIRECT CONSUMPTION SIGNAL FOR GOOGLE CLOUD (READ-THROUGH 6)
Affected company: Alphabet Inc. (GOOGL: United States), through Google Cloud. Direction and magnitude: positive for cloud consumption and utilization, but small at Alphabet’s consolidated scale. This is a stronger supplier read-through than a broad, undifferentiated AI-spending inference.
Supporting evidence: Palo Alto reported a 100-basis-point decline in Q4 non-GAAP gross margin and attributed pressure primarily to faster-growing SASE and cloud offerings. The CFO stated that cloud-hosting costs are expected to grow faster than total revenue in fiscal 2027. Agentic traffic on its SASE platform had increased approximately 9 times over 9 months, while XSIAM was ingesting approximately 19 petabytes daily.
The supplier relationship is explicit. Palo Alto’s December 2025 Google Cloud agreement states that Prisma Access runs on Google’s network, uses Google Cloud Interconnect and that Palo Alto expanded its infrastructure commitment through a multibillion-dollar agreement involving migration of internal workloads. This establishes a direct economic channel rather than relying on an assumed supplier allocation.
The mechanism is consumption of compute, storage, networking and associated cloud services required to inspect traffic, process telemetry and operate cloud-delivered security. Palo Alto’s shift toward these products can increase infrastructure spending even when security pricing does not rise proportionately. The customer’s gross-margin pressure can therefore coexist with a supplier’s revenue opportunity.
The accounting distinction is critical. Higher consumption under an existing commitment is not necessarily a new contract or incremental cloud backlog. It can improve conversion of previously contracted spending into recognized revenue. The call did not disclose an increase in the Google agreement, Google’s share of total hosting expenditure or the margin Google earns on that spending.
Near-term relevance is therefore corroborative for cloud-consumption durability, not a standalone Alphabet earnings catalyst. Subsequent Google Cloud results and Palo Alto’s fiscal 2027 margin trajectory will test the mechanism. Over a longer horizon, the read-through is that AI-enabled security software is increasingly an infrastructure-consuming workload. A portfolio holding both security vendors and cloud providers should not assume their margins benefit equally from the same increase in activity.
IT SERVICES AND CYBERSECURITY IMPLEMENTATION: ACCENTURE BENEFITS FROM DEPLOYMENT BOTTLENECKS BEFORE AUTONOMOUS MIGRATION BECOMES REALITY (READ-THROUGH 7)
Affected company: Accenture plc (ACN: Ireland). Direction and magnitude: positive for cybersecurity transformation and implementation demand, with moderate relevance to the exposed practices but limited immediate impact on consolidated earnings.
Supporting evidence: Management identified customer capacity, rather than a lack of security products, as a major constraint on adoption. It cited proof-of-concept work, environment assessment, vendor selection and deployment planning, and stated that “the customers always have a full deck.” Transformations were described as generally requiring approximately 1-3 years rather than being completed in a single quarter.
The transmission mechanism is demand for architecture design, integration, policy migration, identity governance, testing, change management and managed operations. A decision to standardize on fewer vendors can initially increase implementation work because existing tools, permissions, data pipelines and operational processes must be reconciled. Fewer product vendors do not automatically imply fewer transformation services during the migration period.
Accenture’s exposure is supported by its established Palo Alto alliance. Their joint offerings include AI diagnostics, exposure management, security architecture and deployment support. This creates a documented route for Accenture to participate in the operating bottlenecks described on the call. The anonymous $72 million technology-services-provider transaction cannot be attributed to Accenture and is not necessary to support the conclusion.
The non-consensus implication is that platform consolidation and AI adoption can support selected implementation services even while markets debate automation-driven pressure on traditional IT labor. Enterprises must first organize their data, controls and workflows before realizing the benefits of autonomous operations. The call provides direct evidence that this preparatory work remains a constraint.
The longer-term offset should not be ignored. Palo Alto’s stated aspiration is to automate migration and reduce human involvement in configuration, detection and remediation. Successful execution could eventually reduce labor intensity and pricing for routine tasks. However, the ambition to replace products through agents within approximately 1 week was framed as a 5-year aspiration, not a current capability or fiscal 2027 forecast. Treating it as immediate evidence of services displacement would contradict management’s description of present deployment conditions.
Accenture’s October 1 fiscal 2026 results have already occurred. The next relevant tests are fiscal 2027 bookings conversion, cybersecurity implementation demand and whether automation improves delivery productivity faster than it reduces billable scope. The nearer-term positive is the need to execute complex security transformations; the longer-duration uncertainty concerns how the resulting productivity gains are divided between service providers and customers.
Report record
- Sector
- Information Technology
- Industry
- Systems Software
- Fiscal period end
- July 31, 2026
- Report date
- September 1, 2026
- Analysis
- 6225 words
- Read-throughs
- 2867 words
- Content fingerprint (PDF)
051bf52c714d- Content fingerprint (analysis)
6b145200a4d6- Content fingerprint (read-throughs)
384fc7a1dc19
Prepared from the company's earnings release and earnings call transcript. Figures as reported by the company. For information only. Not investment advice.
More from Palo Alto Networks
No other reports yet.
All Palo Alto Networks reports
More in Information Technology
Operating Thesis Strengthened; Cash Conversion Remains Unproven
Optical and IP Growth Validated; Cash Conversion Moved the Other Way
All Information Technology reports
Follow @AtlasPeakRes on X for new earnings reports as they publish.