AI Participation Is Proven; a Consolidated Growth Inflection Is Not
Earnings Reports
Qnity Electronics, Inc. FQ2 2026 Earnings Report
Qnity Electronics, Inc. (Q) FQ2 2026 earnings: Q2 materially improved growth confidence; cash flow requires material qualification. Full earnings analysis, key read-throughs, and the one-page exhibit from Atlas Peak Research.
Qnity Electronics, Inc. (Q)
Sector: Information Technology · FQ2 2026 · Period end June 30, 2026 · Reported August 4, 2026
Qnity’s Q2 2026 results materially strengthened the investment case for sustained growth above semiconductor production volumes, particularly through advanced packaging, AI printed circuit boards, thermal management, and increasingly complex semiconductor manufacturing processes.
Download the one-page report (PDF)
View one-page exhibit
Download analysis (.md)
Download read-throughs (.md)
Post to X
One-Page Exhibit
Earnings Analysis
EXECUTIVE CALL SUMMARY: Qnity Electronics Inc. (08/04/26)
Qnity’s Q2 2026 results materially strengthened the investment case for sustained growth above semiconductor production volumes, particularly through advanced packaging, AI printed circuit boards, thermal management, and increasingly complex semiconductor manufacturing processes. The appropriate earnings-based stance is constructive, with existing exposure supported by improving operating fundamentals. Additional exposure should remain valuation-sensitive rather than being justified solely by the headline 53% increase in adjusted EPS. The quarter combined a substantial revenue beat and another meaningful guidance increase with less impressive sequential operating leverage, significant non-GAAP adjustments, and continuing cash obligations inherited from the DuPont separation.
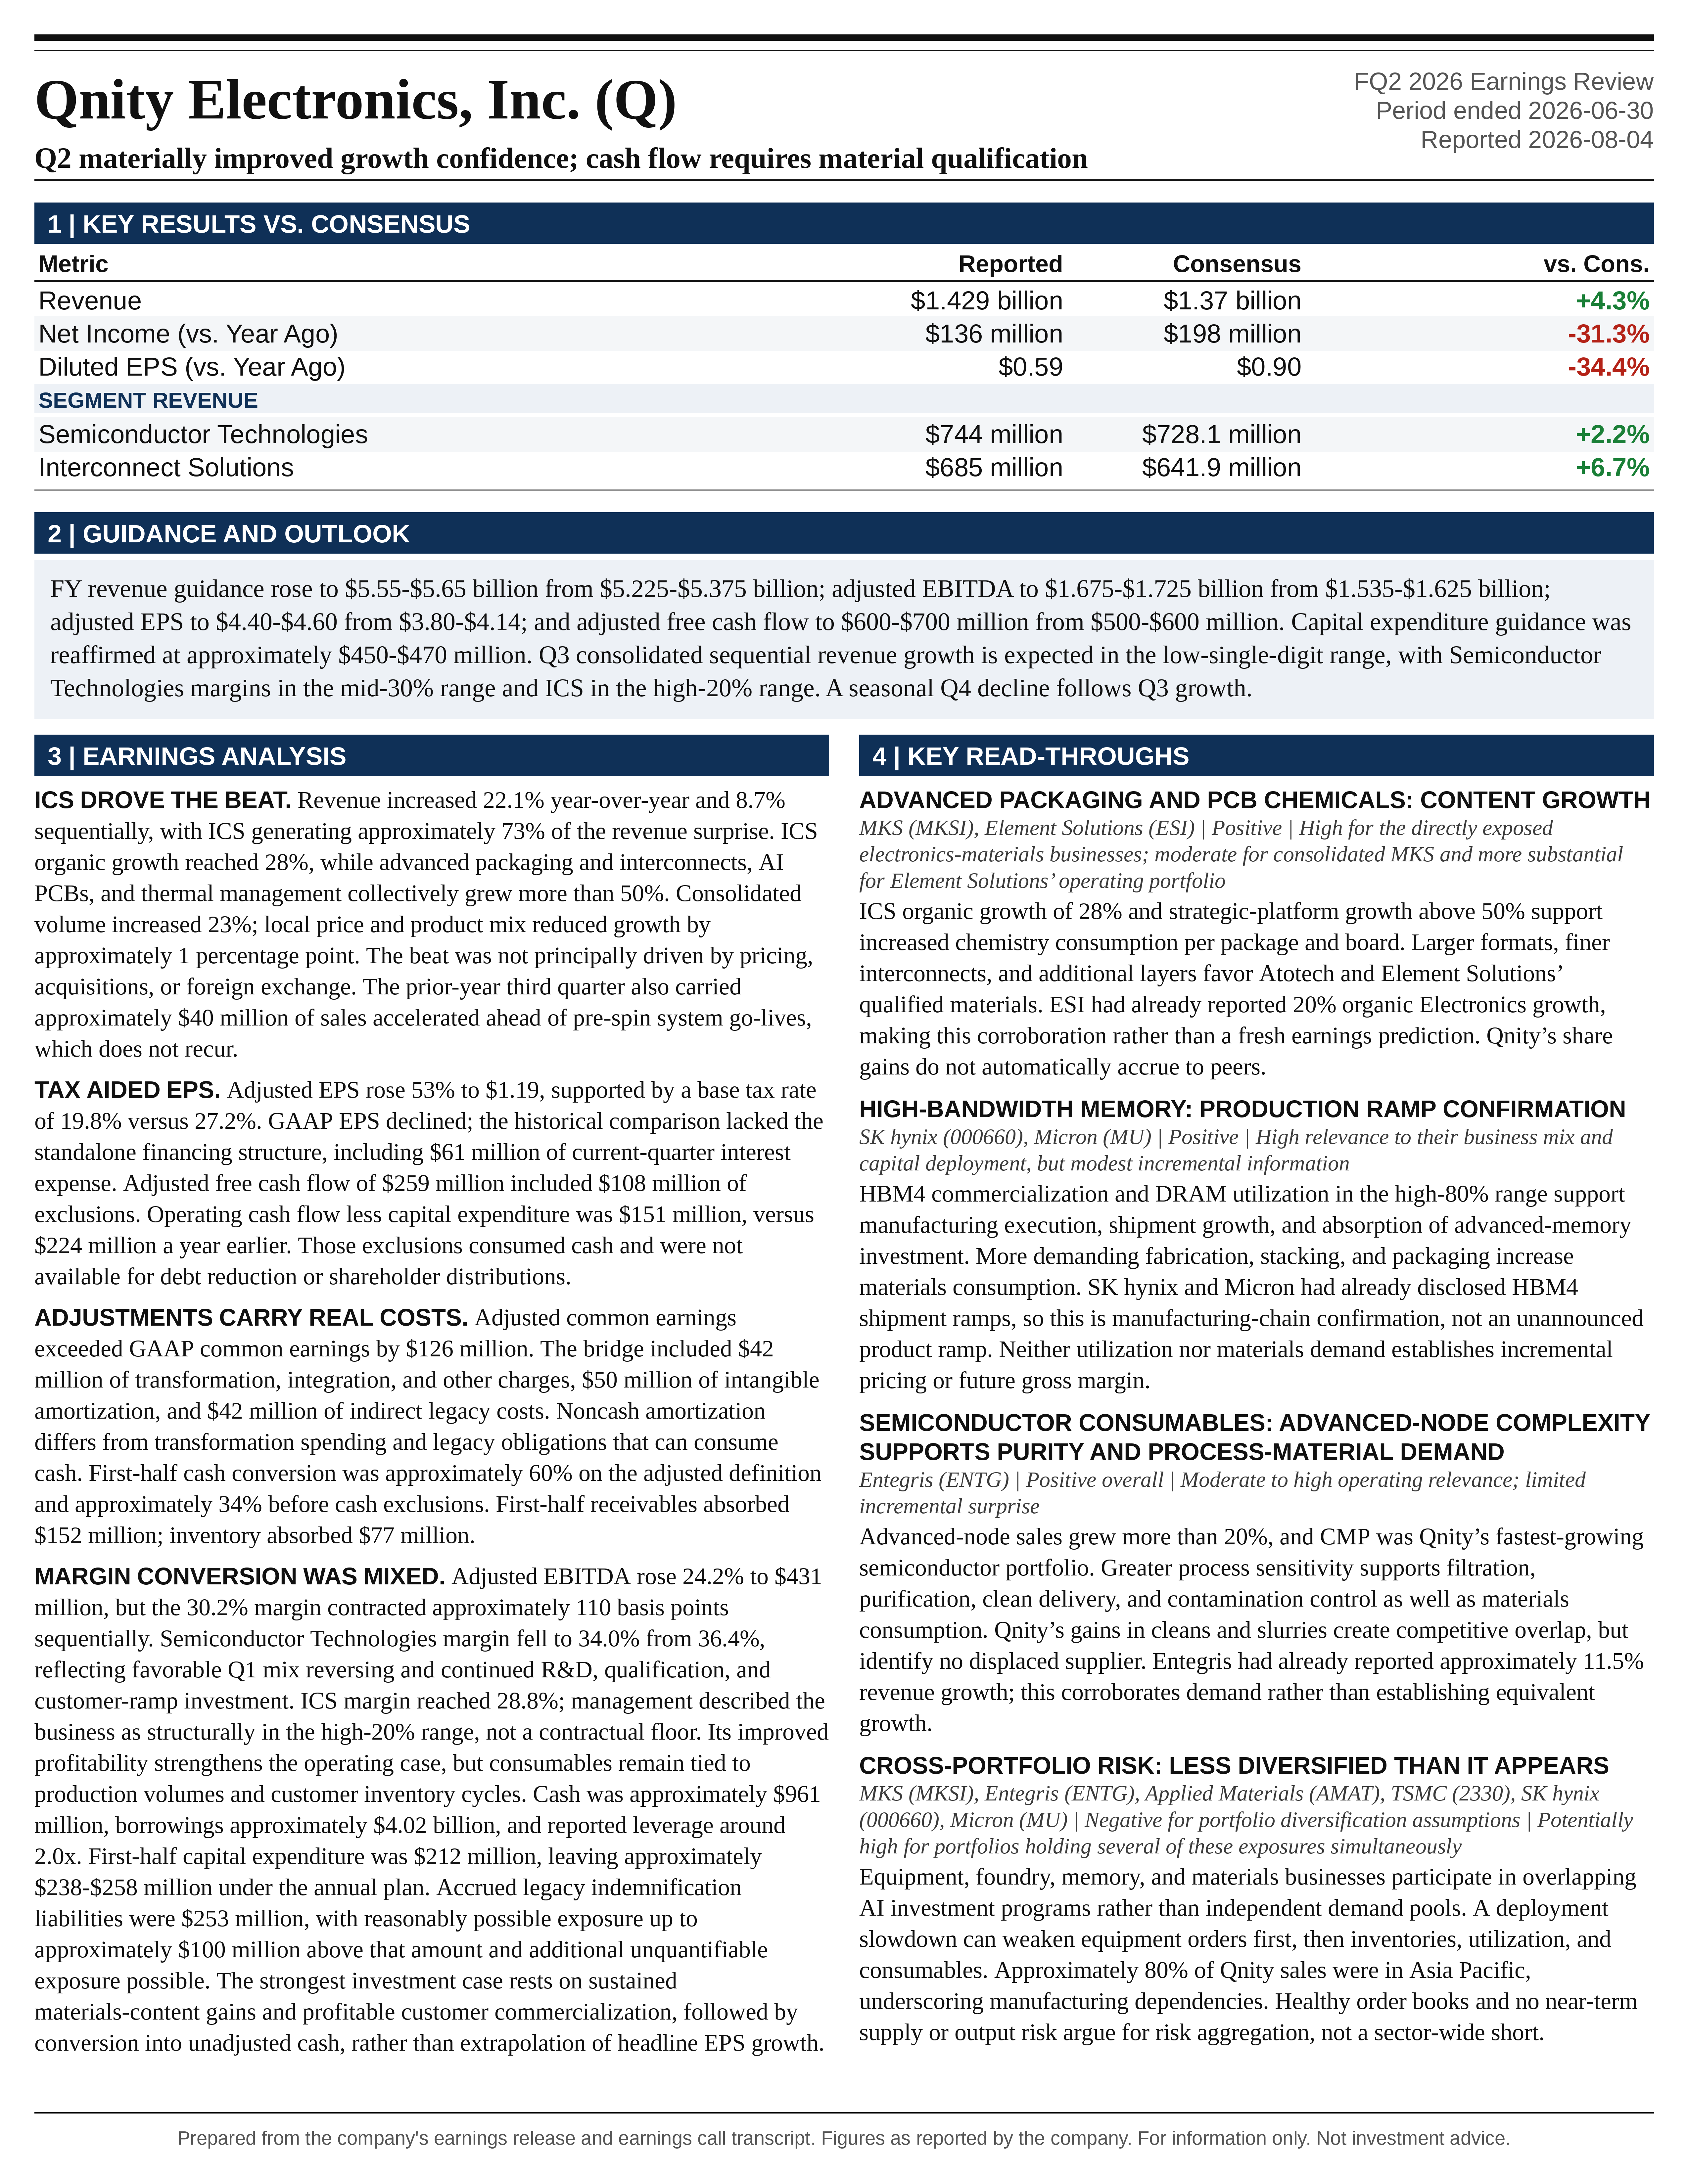
Revenue of $1.429 billion increased 22.1% year-over-year and 8.7% sequentially, exceeding the supplied Bloomberg consensus by approximately $59 million, or 4.3%. Interconnect Solutions, or ICS, generated approximately 73% of the revenue surprise. Adjusted operating EBITDA increased 24.2% to $431 million, but the 30.2% margin expanded only approximately 50 basis points year-over-year and contracted approximately 110 basis points sequentially. Adjusted EPS of $1.19 increased 53%, substantially faster than operating profit, partly reflecting a materially lower adjusted tax rate. GAAP diluted EPS was $0.59.
The full-year guidance revision was economically significant and extended beyond recognition of the Q2 revenue beat. Relative to the May outlook, midpoint revenue increased $300 million to $5.6 billion, adjusted EBITDA increased $120 million to $1.7 billion, adjusted EPS increased $0.53 to $4.50, and adjusted free cash flow increased $100 million to $650 million. These represent increases of 5.7%, 7.6%, 13.4%, and 18.2%, respectively. Nevertheless, the revised outlook does not assume uninterrupted sequential acceleration. Its midpoint implies approximately flat aggregate 2H revenue relative to maintaining the Q2 quarterly run rate, with a seasonal Q4 decline following Q3 growth.
The most important positive development was the strengthening evidence that ICS has become a structurally more attractive business rather than simply participating in a temporary electronics recovery. Organic growth reached 28%, its strategic AI-related platforms collectively grew more than 50%, and its adjusted EBITDA margin reached 28.8%. The most important qualification was the divergence between adjusted cash generation and actual cash remaining after capital expenditure. Reported adjusted free cash flow of $259 million included $108 million of exclusions; operating cash flow less capital expenditure was $151 million.
Historical operating comparisons require consistent treatment of the separation. Qnity became independent in November 2025, and the company’s 2025 pro forma measures incorporate the financing and operating costs of a standalone business. The August earnings release, presentation, and Form 10-Q provide the relevant reconciliations. The May 2026 and February 2026 disclosures establish the prior guidance baselines. The analysis is anchored to information available with the August 4 earnings event.
RESULTS RELATIVE TO EXPECTATIONS AND RECENT HISTORY
The revenue outperformance was broad-based, although its magnitude was disproportionately attributable to ICS. Semiconductor Technologies revenue of $744 million exceeded the supplied consensus of $728.1 million by $15.9 million, or 2.2%. ICS revenue of $685 million exceeded the $641.9 million estimate by $43.1 million, or 6.7%. The consolidated result therefore represented a meaningful operating beat rather than a rounding-driven headline surprise. The supplied notice did not contain compatible adjusted EPS or EBITDA consensus estimates, so the revenue surprise should not automatically be extended to those measures.
Performance also exceeded management’s prior quarterly revenue expectations. On the May call, management anticipated approximately flat sequential Semiconductor Technologies revenue and high-single-digit sequential ICS growth, producing consolidated growth in the mid-single-digit range. Actual sequential growth was 3.0% in Semiconductor Technologies, 15.5% in ICS, and 8.7% overall. Both businesses exceeded those revenue expectations, with ICS delivering the larger incremental contribution.
Growth accelerated from Q1. Consolidated organic growth increased from 17% to 22%, Semiconductor Technologies organic growth increased from 12% to 17%, and ICS organic growth increased from 22% to 28%. Consolidated revenue rose from $1.315 billion to $1.429 billion. ICS contributed $92 million of the $114 million sequential increase, approximately 81%, while Semiconductor Technologies contributed $22 million.
The detailed sales bridge reinforces the quality of the revenue performance. Consolidated volume increased 23%, local price and product mix reduced growth by approximately 1 percentage point, and currency had no material net effect. Semiconductor Technologies recorded 18% volume growth, offset by approximately 1 percentage point each from local price and product mix and currency. ICS recorded 28% volume growth, approximately neutral local price and product mix, and a 2-percentage-point currency benefit.
Consequently, the result was not principally driven by inflationary pricing, acquisitions, or foreign exchange. However, reported material volume growth is not equivalent to wafer-start growth or end-device unit growth. Increased material usage per wafer, package, or board can appear within Qnity’s volume bridge. That distinction is central to understanding how the company can materially outperform conventional semiconductor production indicators.
The 9th consecutive quarter of profitable organic growth supports the argument that recent strength is more persistent than an isolated recovery quarter. It does not eliminate cyclicality, particularly because customer inventory behavior and semiconductor utilization remain important drivers.
SEMICONDUCTOR TECHNOLOGIES: CONTENT INTENSITY IS WORKING, BUT MARGIN CONVERSION WAS MIXED
Semiconductor Technologies delivered $744 million of revenue, up 15.5% as reported and 17% organically. Advanced-node revenue increased more than 20%, supported by advanced logic, high-bandwidth memory, continued 3-nanometer production growth, emerging 2-nanometer activity, and customer commercialization of additional leading-edge platforms.
The investment significance is that Qnity’s growth opportunity depends on both production volume and material intensity. More complex devices can require additional polishing, cleaning, patterning, and packaging processes. The economic exposure is therefore better represented by relevant manufacturing activity multiplied by material consumption and value per process than by wafer starts alone.
Management connected current outperformance to a broader set of customers successfully commercializing advanced technologies. Kemp stated that this was “pushing our content outperformance considerably above that MSI benchmark.” The distinction matters: technology leadership alone does not create revenue if customer platforms fail to commercialize on schedule. The current quarter benefited from simultaneous customer execution across advanced logic and memory.
The CMP portfolio of pads, cleans, and slurries was identified as the fastest-growing part of Semiconductor Technologies. Management attributed performance to both content gains and incremental share gains, particularly in cleans and slurries. This provides a more differentiated explanation than simple exposure to an improving semiconductor cycle. However, the call did not quantify the relative contributions from underlying production, additional process steps, customer mix, or share gains. A precise recurring outgrowth assumption cannot be derived from the disclosed figures.
The lithography discussion also warrants careful interpretation. Management emphasized ancillary materials around the EUV photoresist layer rather than positioning Qnity primarily as an EUV photoresist supplier. The opportunity is to improve the efficiency and effectiveness of expensive EUV processing through surrounding material layers. This creates exposure to increasing lithography complexity without requiring dominance in the photoresist itself.
Advanced-node mix was described as approximately 40% exiting 1H 2026, with the earlier 45%-50% objective potentially being reached ahead of schedule. That is encouraging evidence of portfolio migration, but it is not a disclosed consolidated AI revenue percentage. Advanced-node exposure, memory exposure, advanced packaging, and AI end-market exposure are overlapping classifications and should not be added together.
The operating conversion was less strong than the revenue result. Segment adjusted EBITDA was $253 million, compared with $224 million on the presentation’s comparable pro forma Q2 2025 basis and $263 million in Q1 2026. Margin was 34.0%, versus approximately 34.8% year-over-year and 36.4% sequentially. Revenue increased $22 million from Q1 while EBITDA declined $10 million.
Management attributed the sequential decline to favorable Q1 product mix reversing and continued investment in R&D, qualifications, and customer ramps. This explanation is plausible, particularly during simultaneous advanced-node launches, but the approximately 240-basis-point sequential margin decline was economically meaningful. The call did not quantify how much was attributable to mix, qualification expenditure, manufacturing costs, or other operating investment.
The Q1 comparison also contained approximately $20 million of Semiconductor Technologies customer restocking, particularly in mature nodes, according to the prior prepared remarks. Q2 revenue growth despite that elevated Q1 base strengthens the underlying demand interpretation. It does not fully explain the margin deterioration, and subsequent confirmation of the expected mid-30% margin profile remains important.
INTERCONNECT SOLUTIONS: THE LARGEST POSITIVE CHANGE IN THE INVESTMENT CASE
ICS delivered $685 million of revenue and $197 million of adjusted EBITDA. Revenue increased 30.2% as reported and 28% organically. Comparable pro forma EBITDA increased from $136 million, approximately 45%, and margin expanded from 25.9% to 28.8%.
ICS accounted for approximately 61% of consolidated year-over-year revenue growth and approximately 73% of the increase in consolidated adjusted EBITDA. Its share of consolidated revenue increased from approximately 45.0% to 47.9%. These contributions demonstrate that the quarter’s performance cannot be understood solely through leading-edge wafer fabrication.
Advanced packaging and interconnects, AI PCBs, and thermal management collectively grew more than 50%. Management specifically identified faster adoption of advanced packaging and thermal solutions as a change relative to the assumptions discussed at the September 2025 Investor Day. The rate of customer adoption appears to have accelerated, although no replacement long-term segment growth target was provided.
The structural drivers are technically credible. Larger packages increase the physical area requiring materials. Higher layer counts and tighter geometries increase processing complexity and performance requirements. More demanding AI PCBs require increasingly precise metallization to support signal integrity and power delivery. Higher power density increases the importance of thermal interfaces across chips, packages, boards, and system assemblies.
Pulse plating is relevant because advanced high-layer-count boards require reliable conductive structures across increasingly demanding geometries. Process performance can influence yield, electrical consistency, and reliability. Qualified material systems can therefore create value substantially beyond their direct cost within the finished AI system.
Thermal management similarly benefits from the increasing difficulty of moving heat across interfaces. Qnity’s exposure includes liquid thermal interface materials, phase-change materials, thermal pads, and gap fillers. The opportunity is not interchangeable with ownership of liquid-cooling infrastructure or data-center cooling equipment. These materials address specific thermal-transfer requirements within the broader system, and their economics should be modeled accordingly.
The most consequential margin statement came from Goss: “we believe they're structurally in the high 20% range from an EBITDA margin profile.” This supports a higher normalized profitability assumption than the mid-20% framework previously associated with ICS. However, the statement was a characterization of the operating model rather than a contractual margin floor. Q2 margin improved only approximately 30 basis points sequentially despite 15.5% revenue growth, indicating that the business was largely sustaining its improved profitability rather than continuing to expand margin rapidly each quarter.
Kemp also stated, “The business is still fundamentally a consumables-based business that's tied to volume.” That qualification is essential. Stronger structural demand does not convert the business into recurring software revenue or eliminate customer inventory cycles. Advanced packaging additions and AI infrastructure deployments must translate into actual production and material consumption.
Management acknowledged that third-party metrics for PCB area, advanced packaging volumes, and thermal demand remain imperfect. This creates an opportunity for differentiated forecasting, but also increases uncertainty around sustainable outgrowth. The greater-than-50% growth figure should not be applied to the entire segment, and the absence of a disclosed revenue base for those platforms prevents a precise decomposition of the remaining ICS portfolio.
UTILIZATION, INDUSTRY BENCHMARKS, AND END-MARKET MIX
Management described advanced-logic utilization in the mid-80% range, mainstream logic in the low-80% range, DRAM in the high-80% range, and NAND in the low-80% range. These levels support continued material consumption while leaving some capacity for additional utilization-led growth.
The improvement is not uniform. Mainstream logic had already approached the low-80% range in parts of the market during Q1, and DRAM was already operating in the high-80% range. The Q2 commentary therefore indicates continued recovery and healthy utilization, not an entirely new step-change across every device category. NAND’s movement into the low-80% range is constructive relative to the earlier recovery trajectory.
The MSI outlook increased to high-single-digit growth for 2026, compared with the mid-to-high-single-digit expectation discussed in May and the earlier mid-single-digit assumption. PCB growth was expected in the mid-to-high-single-digit range. These upgrades support the demand outlook, but quarterly Qnity growth should not be mechanically compared with a full-year industry forecast to calculate an exact share-gain or content-growth residual.
Management’s device-mix commentary indicated that logic remained the dominant exposure, broadly around 75%-80%, with memory around 20%-25%. HBM and DRAM had increased modestly within that mix. These figures do not establish that the same proportions apply to total consolidated revenue across every ICS application.
End-market exposure continued to migrate toward data centers. Automotive, aerospace and defense, telecom infrastructure, and other industrial markets were described as growing steadily. Consumer electronics remained positive but grew more slowly. Consequently, a declining consumer share of the portfolio should not be confused with an absolute decline in consumer-related revenue.
Premium-device exposure provided resilience, but it does not eliminate consumer risk. Higher memory prices or constrained memory availability can still affect device production, product configurations, and launch timing. Management explicitly acknowledged that memory-related supply-chain dynamics could limit the extent of mainstream-logic utilization improvement.
Physical AI represents a plausible longer-term expansion opportunity across devices, vehicles, and machines. It was not quantified sufficiently to support a separate near-term revenue forecast. The thesis depends on broad deployment volumes, material content, and manufacturing requirements, rather than assuming that every edge AI device has data-center-class economics.
PROFITABILITY AND EARNINGS QUALITY
Consolidated adjusted EBITDA increased $84 million on $259 million of additional year-over-year revenue, an incremental margin of approximately 32.4%. This is healthy, but not exceptional relative to the existing 30% margin structure. Sequentially, EBITDA increased only $20 million on $114 million of additional revenue, an incremental margin of approximately 17.5%.
Gross profit was $666 million, equivalent to approximately 46.6% of revenue. This compared with approximately 46.3% on the prior-year adjusted pro forma basis and 47.0% in Q1. The quarter therefore showed modest year-over-year gross-margin expansion but sequential compression.
The mix effect requires nuance. ICS has a lower absolute EBITDA margin than Semiconductor Technologies, so faster ICS growth can dilute consolidated margin even while improving the quality and durability of consolidated earnings growth. Conversely, ICS’s own substantial year-over-year margin improvement can offset some of that dilution. Both effects were present.
The 53% adjusted EPS increase should not be interpreted as evidence that operating leverage reached a comparable rate. The adjusted base tax rate was 19.8%, versus 27.2% on the comparable prior-year pro forma basis. That 740-basis-point difference materially supported earnings growth. The diluted share count was approximately 210.2 million, versus 209.4 million, so buybacks were not the source of the year-over-year EPS acceleration.
GAAP earnings provide an important counterweight. Net income declined from $198 million to $136 million, and income available to common shareholders declined from $188 million to $124 million. GAAP diluted EPS declined from $0.90 to $0.59. These comparisons are affected by the new standalone financing structure, including $61 million of Q2 interest expense versus no allocated interest expense in the historical GAAP comparison.
The current-quarter adjustment bridge was substantial. Adjusted common earnings of $250 million exceeded GAAP common earnings by $126 million. The reconciliation included $42 million of transformation, integration, and other charges; $50 million of intangible amortization; and $42 million of indirect legacy costs, partly offset by a $5 million asset-sale gain, pension credits, and tax effects.
Intangible amortization is noncash and may reasonably be excluded when assessing ongoing operating performance. Transformation expenditure and legacy obligations require a different treatment because they can consume cash and persist across multiple reporting periods. Treating all exclusions as equally irrelevant to equity value would overstate earnings quality.
Transformation-related charges included approximately $24 million of IT independence costs, $8 million of transformation initiatives, $3 million of other integration costs, and $7 million of severance and asset-related charges. These amounts establish that separation and operating-model changes remained economically significant despite their exclusion from adjusted EPS.
FULL-YEAR GUIDANCE: A SUBSTANTIAL UPGRADE WITH SOME BELOW-THE-LINE SUPPORT
Revenue guidance increased to $5.55-$5.65 billion from $5.225-$5.375 billion. Adjusted EBITDA guidance increased to $1.675-$1.725 billion from $1.535-$1.625 billion. Adjusted EPS increased to $4.40-$4.60 from $3.80-$4.14. Adjusted free cash flow increased to $600-$700 million from $500-$600 million.
The new midpoint implies approximately 17.8% revenue growth, 21.3% adjusted EBITDA growth, and 34.3% adjusted EPS growth against the company’s full-year 2025 figures. The EPS growth rate is approximately consistent with management’s rounded 35% characterization.
The cumulative revision since February is also notable. Initial 2026 guidance was $4.97-$5.17 billion of revenue, $1.465-$1.575 billion of EBITDA, $3.55-$3.95 of adjusted EPS, and $450-$550 million of adjusted free cash flow. Current midpoints are approximately 10.5%, 11.8%, 20.0%, and 30.0% above those original midpoints.
The latest revision implies approximately 40% EBITDA conversion on the $300 million revenue increase. This exceeds Q2’s realized year-over-year incremental margin and supports a favorable operating-leverage interpretation. It should not, however, be treated as a disclosed marginal profit rate on a specific set of new orders. The revision incorporates mix, spending assumptions, cost mitigation, and the broader forecast.
The implied full-year EBITDA margin increased from approximately 29.8% to 30.4%. This is a meaningful improvement, but the absolute margin change is more restrained than the 13.4% EPS-guidance increase might suggest.
The presentation also updated assumptions not emphasized in the spoken guidance. The expected base tax rate moved to approximately 21%, versus 21%-23% previously. Net interest expense moved to $240-$250 million from approximately $250 million. Depreciation narrowed to $195-$200 million from $190-$210 million. Expected diluted shares moved to approximately 210.3 million from approximately 210 million.
At a 21% tax rate and approximately 210.3 million diluted shares, the $120 million EBITDA increase would contribute roughly $0.45 of EPS before changes in depreciation and other items. This supports the conclusion that most of the $0.53 EPS increase is operating-driven. Lower tax and interest assumptions provide additional support, while the slightly higher share assumption is a modest offset.
The revenue revision also extends beyond the current-quarter surprise. The $300 million annual increase is materially larger than the approximately $59 million consensus revenue beat. Consensus and management’s internal quarterly plan are not identical, so the difference is not an exact 2H upgrade calculation. Nevertheless, the magnitude indicates a broader improvement in expected annual demand rather than simply passing through Q2 outperformance.
Q3 AND Q4: IMPROVING DEMAND, BUT NOT A STRAIGHT-LINE ACCELERATION
For Q3, management expects consolidated sequential revenue growth in the low-single-digit range. Semiconductor Technologies is expected to grow sequentially in the low-single-digit range with EBITDA margin in the mid-30% range. ICS is expected to grow in the mid-single-digit range with margin in the high-20% range.
These qualitative ranges should not be treated as precise point estimates. Different numerical interpretations of the segment descriptions can produce a consolidated result near the upper end of the stated company growth range. The central message is continued growth, with ICS again expected to outperform.
The annual guidance provides a clearer constraint. First-half revenue was $2.744 billion and adjusted EBITDA was $842 million. At the annual midpoint, 2H revenue must be $2.856 billion and EBITDA must be $858 million, implying a 2H EBITDA margin of approximately 30.0%.
Thus, midpoint 2H revenue is approximately equal to 2 quarters at the Q2 revenue level. EBITDA is similarly close to maintaining the Q2 run rate. The outlook contains growth relative to 2025, but does not require sequential acceleration throughout the remainder of 2026.
Using 2% sequential Q3 revenue growth solely as an illustrative interpretation produces Q3 revenue of approximately $1.458 billion. The annual midpoint would then imply Q4 revenue of approximately $1.398 billion, down 4.1% sequentially. Using 1%-3% Q3 sequential growth produces an implied Q4 sequential decline of approximately 2.1%-6.0%. These are mechanical implications of the annual midpoint, not separately issued Q4 guidance.
Management attributed the pattern to a seasonal Q3 consumer-electronics peak followed by normal Q4 inventory management. Goss stated that “order books do remain healthy,” while also identifying customer ramp timing, utilization, and Middle East developments as variables that could affect performance.
This explanation does not establish that the outlook is deliberately conservative. It identifies plausible reasons for moderation and some potential upside if conditions improve. No quantified backlog, customer shipment commitment, or inventory-duration disclosure was provided to independently measure that upside.
The 2025 shipment timing distortion is particularly important. Approximately $40 million was accelerated from Q4 into Q3 ahead of pre-spin IT implementation, comprising $25 million in Semiconductor Technologies and $15 million in ICS. That elevates the Q3 comparison and depresses the Q4 comparison.
For illustration, the 2% Q3 sequential-growth case produces approximately 14.2% reported Q3 year-over-year growth. Removing the $40 million timing distortion from the 2025 Q3 base increases that comparison to approximately 17.9%. The corresponding Q4 result produces approximately 17.5% reported growth, but approximately 13.7% after restoring the $40 million to the 2025 Q4 base.
Reported growth could therefore appear to accelerate from Q3 to Q4 even while growth against normalized comparisons decelerates. This historical timing effect does not itself indicate a new shipment pull-forward in 2026.
CASH FLOW: THE HEADLINE IMPROVEMENT REQUIRES MATERIAL QUALIFICATION
Adjusted free cash flow of $259 million was strong relative to $28 million in Q1. However, the release’s reconciliation shows operating cash flow of $241 million and capital expenditure of $90 million, leaving $151 million before the company’s adjustments.
The $108 million difference consisted of $42 million of transformation, integration, and other cash costs; $14 million of indirect legacy cash costs; and $52 million of foreign tax costs associated with legal-entity restructuring before separation. These excluded cash outflows represented approximately 42% of reported adjusted free cash flow.
The distinction is consequential for debt reduction, acquisition capacity, and shareholder distributions. The business generated $259 million under its adjusted definition, but actual operating cash remaining after capital expenditure was $151 million. The exclusions may improve comparability to an eventual steady-state business, but they do not represent cash available for allocation in the reported quarter.
Year-over-year comparisons also require consistent definitions. Q2 operating cash flow declined from $273 million to $241 million, and operating cash flow less capital expenditure declined from $224 million to $151 million. Conversely, adjusted free cash flow increased from the company’s standalone pro forma comparison of $144 million to $259 million. The apparent contradiction reflects both actual cash exclusions and the prior-period financing and standalone adjustments.
For 1H 2026, operating cash flow was $376 million, capital expenditure was $212 million, and unadjusted cash flow after capital expenditure was $164 million. Adjusted free cash flow was $287 million after $123 million of exclusions. Relative to $476 million of adjusted common earnings, cash conversion was approximately 60% on the adjusted definition and approximately 34% before those cash exclusions.
Working capital consumed cash as the business expanded. Receivables absorbed $152 million and inventory absorbed $77 million in 1H, partly offset by a $134 million accounts-payable contribution. These movements are compatible with growth and targeted supply-chain buffers, but they also mean that strong earnings growth has not translated proportionately into unrestricted cash.
The revised full-year adjusted free cash flow range requires $313-$413 million in 2H. That does not appear demanding relative to the Q2 result, but annual cash generation should not be extrapolated directly from a quarter benefiting from normal intra-year payment patterns. More importantly, no corresponding unadjusted free cash flow forecast was provided.
CAPITAL INTENSITY, CAPACITY, AND THE PATH TO HIGHER CASH CONVERSION
The presentation retained full-year capital expenditure guidance of approximately $450-$470 million. Because revenue guidance increased, the midpoint capital-intensity assumption declined mechanically to approximately 8.2%, compared with the roughly 9% characterization in May. This is not evidence that the planned dollar investment was reduced.
Q2 capital expenditure of $90 million represented approximately 6.3% of quarterly revenue, but that quarterly ratio understates the full-year investment requirement. First-half expenditure was $212 million, leaving approximately $238-$258 million for 2H under the annual plan.
Management continues to expect capital expenditure to return toward 6% of sales over the longer term. At the current $5.6 billion revenue midpoint, 6% would equal approximately $336 million, around $124 million below the current capital-spending midpoint. That represents a meaningful potential source of future cash improvement, but not a confirmed 2027 cash-flow benefit. The timing depends on capacity requirements, qualification schedules, and transformation investment.
Approximately $600 million of growth investment since 2022 reflects a sustained effort to remove constraints and align capacity with customer roadmaps. It should not be added to 2026 capital expenditure as though it were a separate future commitment. Management described most new capacity as modular expansion within an established geographic footprint, potentially allowing faster deployment and better returns than large greenfield projects.
Kemp acknowledged that “the growth is a bit faster than what we were expecting,” but said capacity could be adjusted to support customer ramps. This is constructive evidence of execution flexibility. It is not a quantified assurance of unlimited capacity: product-specific utilization, qualification lead times, incremental returns, and capacity headroom were not disclosed.
The prior call identified a Taiwan facility expected to become fully operational in early 2027. Its successful commissioning is a tangible catalyst, particularly for CMP materials. Capacity must still be qualified and utilized before it produces the expected economic return.
TRANSFORMATION: A CREDIBLE ADDITIONAL DRIVER, BUT MOST BENEFITS REMAIN AHEAD
The transformation plan announced in February targeted approximately $100 million of annualized EBITDA benefits by the end of 2028, with approximately $140 million of implementation costs over approximately 2-3 years. The Q2 call did not announce a change to that overall target.
The latest examples were operationally specific. Productivity, automation, and capacity-release initiatives in Kalrez are intended to convert stronger wafer-fabrication-equipment demand into revenue. Warehouse consolidation is expected to reduce logistics costs by approximately 10% while improving network efficiency.
The 10% logistics savings figure applies to the relevant logistics cost base, not to total company expenses. It also should not automatically be added to the broader $100 million transformation target; the examples appear to illustrate the program rather than establish separate incremental commitments.
The timing statement was important. Kemp said, “Most of that will be weighted towards the back half of next year.” In the context of the August 2026 call, this points to 2H 2027. Near-term earnings expectations should therefore remain primarily supported by demand, mix, pricing mitigation, and utilization rather than assuming immediate realization of the full transformation opportunity.
At the current revenue midpoint, a fully incremental $100 million annual benefit would be equivalent to approximately 180 basis points of margin. At a 21% tax rate and approximately 210 million shares, it would represent roughly $0.38 of annual EPS before changes in reinvestment and other items. These sensitivities indicate materiality, not a forecast that all benefits will pass directly to earnings.
IT independence remains a parallel execution requirement. Management expects approximately 2/3 of sites to be migrated to independent systems by year-end. Reduced transition-service reliance can improve control and eventually reduce cost, but migrations can also create operational and working-capital disruption. The prior $40 million shipment timing shift demonstrates that system transitions can affect quarterly revenue patterns.
BALANCE SHEET, CAPITAL ALLOCATION, AND LEGACY LIABILITIES
Liquidity remained adequate. Cash and cash equivalents were approximately $961 million, compared with approximately $850 million at the end of Q1. Total balance-sheet borrowings were approximately $4.02 billion, implying net debt of approximately $3.06 billion. Management reported leverage around 2.0x, down from 2.2x in Q1.
Dividing current net debt by the full-year EBITDA guidance midpoint produces approximately 1.8x. That forward calculation differs from management’s reported leverage methodology and should not be presented as a conflicting leverage figure.
The July term-loan repricing reduced the applicable SOFR borrowing margin from 2.00% to 1.75%, generating approximately $6 million of annual interest savings. At the current tax and share assumptions, the annual EPS benefit is approximately $0.02. The 2026 benefit is smaller because the repricing occurred midyear. It is a useful financing improvement, but not a major explanation for the guidance increase.
Capital allocation remains appropriately oriented toward organic investment. Management prioritized capacity, R&D, and customer support ahead of acquisitions. Potential transactions remain focused on adjacent bolt-on opportunities, particularly advanced packaging and thermal management. This is preferable to pursuing scale for its own sake, although acquisition discipline becomes more important when target assets are benefiting from strong AI-related demand.
Q2 repurchases of $25 million were intended to partially offset dilution. First-half repurchases totaled $50 million, leaving $450 million under the authorization. The diluted share count remained above the prior-year level, so repurchases should not be modeled as a major near-term EPS-growth driver.
The most important balance-sheet qualification is that Qnity’s operating portfolio is technologically focused, but its financial obligations are not free of legacy chemical-company exposure. The Q2 Form 10-Q reported $253 million of accrued legacy indemnification liabilities, compared with $190 million at year-end. The filing also disclosed reasonably possible exposure of up to approximately $100 million above the accrued amount, with additional unquantifiable exposure possible.
The filing identified a $43 million indemnification liability associated with North Carolina litigation. This helps explain the materiality of legacy charges and the unfavorable GAAP tax effects. These liabilities are distinct from semiconductor operating performance, but remain relevant to equity value and future cash distributions.
Legacy liabilities should be reflected either through projected cash outflows or an appropriate valuation adjustment, without double-counting the same obligation. Excluding legacy costs from adjusted EBITDA does not extinguish the underlying liability.
TECHNOLOGY POSITIONING, CUSTOMER STICKINESS, AND LIMITS TO THE MOAT
The strongest competitive argument is Qnity’s integration into customer process development and qualification. Process-of-record wins can create durable positions because material substitution may require requalification, process optimization, and acceptance of yield or reliability risk. The breadth of the portfolio can support participation across front-end manufacturing, advanced packaging, interconnects, and thermal interfaces.
The new Optivision Max polishing pads, advanced-node qualifications, pulse-plating wins, and broader thermal portfolio are consistent with that model. Nevertheless, product announcements are not equivalent to disclosed revenue backlog. Management noted that increased visibility partly reflects the ability to tell a focused standalone-company story rather than an entirely new innovation strategy.
Advanced packaging architecture diversity is both an opportunity and a risk. Larger formats and tighter geometries generally increase material complexity, but individual architectures can change the material mix, process sequence, and competitive requirements. Incumbency is valuable without guaranteeing identical content or share across every roadmap.
Materials intensity also should not be treated as an indefinitely linear multiplier. Better yields, reduced scrap, improved process efficiency, and material-saving innovations can offset some increases in process complexity. The relevant investment variable is realized material value per unit of economically useful production, not merely the number of layers discussed in technology roadmaps.
The local-for-local model can reduce cross-border logistics exposure and improve customer responsiveness. It does not eliminate geographic concentration. Approximately $1.139 billion, or 80%, of Q2 revenue was recorded in Asia Pacific. That reflects the manufacturing location of customers rather than ultimate consumer demand, but remains relevant to trade restrictions, regional disruption, and operating concentration.
MANAGEMENT CREDIBILITY AND REMAINING INFORMATION GAPS
Management’s demand credibility improved because both segments exceeded the prior revenue outlook and the annual forecast increased substantially. The capacity discussion was consistent with investments described on the prior call, and the transformation discussion included identifiable operating initiatives rather than only broad cost-saving language.
The cost-pressure update was also consistent with prior communication. Approximately $20 million of logistics and energy pressure remained the stated annual magnitude, with roughly half incurred during 1H. Management expected mitigation through targeted pricing and the local operating model, and stated that there was “no near-term risk to supply or output.”
However, the consolidated price-and-product-mix bridge remained negative. This does not disprove targeted cost recovery because portfolio mix can offset selected price increases. It does mean that broad-based pricing power cannot be inferred from the mitigation commentary.
Several important questions remained incompletely resolved. The call did not quantify the Semiconductor Technologies margin bridge, disclose profitability by end market, specify customer-level capacity commitments, or provide a numerical 2027 forecast. The advanced-node growth question was answered with confidence in customer ramps and portfolio migration rather than a commitment to sustain growth above 20%.
The call also did not emphasize the large cash-flow exclusions or the lower tax assumption underlying the annual EPS outlook. Those details were available in the financial materials and materially affect interpretation of the headline results.
Leadership execution remains relevant. Kate Dei Cas joined as President of Semiconductor Technologies on August 3, with more than 25 years of industry experience. Sam Ponzo returned to the Chief Commercial and Strategy Officer role. The CFO search was described as being in its final stages, but a permanent appointment had not been announced. These changes create an opportunity to strengthen execution while adding transition risk during a demanding operating period.
ILLUSTRATIVE 2027 SCENARIOS
Management did not provide numerical 2027 guidance. The following scenarios are illustrative underwriting assumptions rather than company forecasts or consensus estimates. Their purpose is to distinguish plausible operating outcomes and the associated earnings sensitivity.
The base case, assigned a 50% probability, assumes $6.25 billion of revenue, approximately 11.6% growth from the 2026 guidance midpoint, and a 31.5% adjusted EBITDA margin. EBITDA would be approximately $1.97 billion. Assuming $210 million of depreciation, $235 million of net interest expense, a 21% adjusted tax rate, $50 million of earnings attributable to noncontrolling interests, and 210 million diluted shares produces approximately $5.49 of adjusted EPS. This case assumes continued materials-content gains, normalization of current growth rates, and partial transformation benefits.
The bull case, assigned a 25% probability, assumes $6.75 billion of revenue, approximately 20.5% growth, and a 33.0% EBITDA margin. EBITDA would be approximately $2.23 billion. With $220 million of depreciation, $225 million of net interest expense, a 21% tax rate, $55 million of noncontrolling earnings, and 210 million shares, adjusted EPS would be approximately $6.44. This requires strong advanced-node and packaging ramps, sustained ICS profitability, timely capacity additions, and favorable conversion of volume growth into earnings.
The bear case, assigned a 25% probability, assumes $5.40 billion of revenue, approximately 3.6% below the 2026 midpoint, and a 28.0% EBITDA margin. EBITDA would be approximately $1.51 billion. With $210 million of depreciation, $245 million of net interest expense, a 22% tax rate, $45 million of noncontrolling earnings, and 210 million shares, adjusted EPS would be approximately $3.71. This could result from delayed customer ramps, an AI infrastructure inventory correction, weaker consumer or industrial demand, and operating costs that cannot adjust quickly.
These assumptions produce probability-weighted adjusted EPS of approximately $5.29, around 17.5% above the 2026 guidance midpoint. This is not an expected stock return. It excludes uncertainty around valuation multiples and does not establish the cash cost of future non-GAAP exclusions.
The valuation sensitivity remains substantial. Base-case EPS growth of approximately 22% could be almost entirely offset by approximately 18% compression in the earnings multiple. In the bear case, approximately 17.5% lower EPS combined with 20% multiple compression would imply approximately 34% equity downside relative to a valuation anchored to $4.50 of earnings. Strong fundamental growth therefore does not independently establish an attractive entry price.
INVESTMENT IMPLICATIONS, CATALYSTS, AND RISK PARAMETERS
The quarter supports retaining a constructive position in the business, with the strongest thesis centered on rising materials content and ICS’s improved profitability rather than extrapolation of 53% EPS growth. The incremental evidence favors a better growth and margin trajectory than the original 2026 framework. It does not justify treating Qnity as immune to semiconductor utilization, inventory cycles, or AI infrastructure spending volatility.
The principal near-term catalysts are Q3 delivery against the sequential growth and margin outlook, confirmation that Q4 moderation is seasonal rather than an emerging demand problem, and evidence that actual cash generation is converging toward adjusted earnings. Further milestones include year-end IT migration progress, the permanent CFO appointment, early-2027 capacity readiness, and more visible transformation benefits during 2H 2027.
The most important operating falsification tests are a sustained loss of growth relative to relevant production benchmarks, advanced-node qualification wins failing to convert into commercial revenue, ICS margin falling back toward the mid-20% range without a temporary explanation, or Semiconductor Technologies failing to recover its expected mid-30% profitability. A persistent widening of the adjusted-to-unadjusted cash-flow gap would weaken the equity case even if reported adjusted EPS continued to rise.
Portfolio diversification benefits should not be overstated. Qnity provides exposure across multiple manufacturing stages and customer platforms, potentially reducing dependence on an individual chip architecture. However, advanced logic, HBM, packaging, AI PCBs, and thermal materials can all depend on the same ultimate AI infrastructure spending pool. Within a portfolio already concentrated in AI accelerators, foundries, memory, or semiconductor equipment, Qnity may increase correlated exposure rather than materially diversify it.
A valuation-specific buy decision requires an as-of-call share price and an appropriate peer and historical valuation baseline. Without those inputs, the supported action is to retain fundamentally justified exposure while withholding an automatic increase based on the earnings beat alone.
For an approved position, illustrative risk controls would limit initial exposure to approximately 1% of portfolio net asset value, with expansion toward 2% contingent on margin recovery, cash conversion, and valuation support. A 15% price-loss exit threshold would correspond to approximately 15-30 basis points of portfolio loss at those position sizes before gaps, slippage, and correlation effects. Fundamental deterioration should trigger an earlier exit regardless of price performance. A 12-18-month operating horizon is consistent with the capacity and initial transformation catalysts, while the full end-2028 savings target extends beyond that horizon.
The central conclusion is that Q2 materially improved confidence in Qnity’s operating growth trajectory, particularly in ICS, but did not remove the need to distinguish revenue growth from pricing, adjusted EPS from operating leverage, and adjusted free cash flow from cash actually available to shareholders. The strongest investment case rests on sustained content gains, profitable commercialization of customer roadmaps, and eventual conversion of those gains into unadjusted cash.
COMPANY EMPLOYEES ON THE CALL
• Jon Kemp, Chief Executive Officer. • Meg Miller, Vice President, Global Communications. • Mike Goss, Interim Chief Financial Officer.
RESEARCH ANALYSTS ON THE CALL
• Jim Schneider, Goldman Sachs. • Melissa Weathers, Deutsche Bank. • Christopher Parkinson, Wolfe Research. • Saurabh Dhir, Mizuho, participating on behalf of John Roberts. • Frank Mitsch, Fermium Research. • Bhavesh Lodaya, BMO Capital Markets. • Edward Yang, Oppenheimer.
Key Read-Throughs
KEY READ-THROUGHS FROM QNITY ELECTRONICS’ Q2 2026 EARNINGS CALL
Qnity’s results support a selective, rather than indiscriminate, positive interpretation of the semiconductor and AI infrastructure cycle. The strongest evidence concerns rising materials consumption per wafer, package, and circuit board, alongside commercial production ramps in advanced logic and high-bandwidth memory. These developments favor specialized process chemicals, contamination control, advanced manufacturing equipment, and thermal-interface materials. They do not establish a comparable acceleration in consumer-device units or justify transferring Qnity’s growth rates to every company associated with AI. The clearest negative implications are continued pressure on mass-market PC economics and greater common-factor exposure across ostensibly diversified semiconductor portfolios. The assessment uses the August 4, 2026 information set: near-term catalysts refer to that earnings-event window, not subsequent results. Countries denote corporate domicile, and impact magnitudes describe operating or portfolio significance rather than predicted share-price moves.
ADVANCED PACKAGING AND PCB CHEMICALS: CONTENT GROWTH PROVIDES A MORE DIRECT OPPORTUNITY THAN SEMICONDUCTOR UNIT GROWTH ALONE (READ-THROUGH 1)
Affected companies: MKS Inc. (MKSI: US) and Element Solutions Inc. (ESI: US). Direction: positive. Magnitude: high for the directly exposed electronics-materials businesses; moderate for consolidated MKS and more substantial for Element Solutions’ operating portfolio.
Call evidence: ICS organic revenue increased 28%, while advanced packaging and interconnects, AI PCBs, and thermal management collectively grew more than 50%. Management identified new pulse-plating business for advanced high-layer-count AI boards and stated that advanced packaging architectures involve larger formats and tighter geometries. Kemp attributed the stronger trajectory relative to Investor Day expectations to “the pace with which advanced packaging and thermal has really accelerated.”
The transmission mechanism is increased chemical processing and material value per package or board, not simply higher shipments of finished electronics. Larger substrates, additional conductive layers, finer interconnects, and more demanding via structures increase the processing requirements addressed by MKS’ Atotech chemistry and equipment portfolio and Element Solutions’ electronics chemistries and assembly materials. Qualified formulations can benefit from higher recurring consumption as customer production ramps. This creates an opportunity to outperform broad PCB-area or semiconductor-wafer growth without requiring an equivalent acceleration in device units.
MKS also has exposure to PCB laser processing and manufacturing equipment. It can therefore participate in both the installation of additional production capability and subsequent chemical consumption. Its Electronics & Packaging business generated $321 million in Q1, approximately 30% of consolidated revenue, making the channel meaningful but not representative of the entire company.
The most actionable distinction is timing. MKS was scheduled to report on August 5, followed by its August 6 call. Qnity provided a fresh demand check immediately before that event. However, MKS had already guided Q2 revenue to $1.20 billion, plus or minus $40 million, so a substantial improvement was already embedded in expectations. The signal supported confidence in execution and subsequent demand, not an automatic earnings beat.
Element Solutions had already reported 20% organic Electronics growth on July 27. For ESI, Qnity was corroborating an established trend rather than predicting an unreported quarter. At the call date, ESI was also subject to a proposed acquisition by Solstice Advanced Materials (SOLS: US), with consideration of $10 plus 0.5 Solstice shares per ESI share. Consequently, its contemporaneous equity response also depended on Solstice’s valuation and transaction probability. The transaction was not completed, and ESI earnings could not be treated as consolidated Solstice earnings.
Over 2026-2028, the durable opportunity is greater processing content and customer qualification intensity. The principal qualification is competition: Qnity’s share gains do not automatically accrue to peers, and its greater-than-50% platform growth cannot be applied to their entire electronics businesses.
SEMICONDUCTOR CONSUMABLES: ADVANCED-NODE COMPLEXITY SUPPORTS PURITY AND PROCESS-MATERIAL DEMAND, WITH UNEVEN COMPETITIVE BENEFITS (READ-THROUGH 2)
Affected company: Entegris Inc. (ENTG: US). Direction: positive overall, with a competitive qualification in overlapping CMP and cleaning products. Magnitude: moderate to high operating relevance; limited incremental surprise relative to Entegris’ own contemporaneous disclosure.
Call evidence: Semiconductor Technologies organic sales increased 17%, advanced-node sales increased more than 20%, and management identified CMP pads, cleans, and slurries as the segment’s fastest-growing portfolio. Qnity also reported incremental share gains in cleans and slurries. Advanced-logic utilization was in the mid-80% range, with DRAM in the high-80% range.
Entegris benefits through distinct economic channels. Higher wafer processing increases consumption of process materials and contamination-control products. Greater process complexity and tighter defect tolerances increase the importance of filtration, purification, clean chemical delivery, and control of contamination throughout manufacturing. These requirements can increase value per processed wafer independently of wafer-start growth.
The strongest read-through is therefore not that Entegris should replicate Qnity’s 17% organic growth. It is that the combination of improving utilization and increasing process sensitivity supports both its Materials Solutions and Advanced Purity Solutions businesses. Purity and contamination-control exposure provides a complementary route to the same customer spending that drives Qnity’s polishing and cleaning demand.
The competitive qualification matters. Entegris sells CMP slurries and formulated cleaning materials, creating direct overlap with areas where Qnity reported share gains. Those gains establish competitive pressure in specific formulations, but the call did not identify the displaced supplier. They do not support a high-conviction conclusion that Entegris lost share overall.
Entegris’ August 4 release already reported approximately 11.5% revenue growth and guided Q3 sales to $905-$935 million, above Q2 sales of $883.2 million. Its adjusted EBITDA margin also improved year-over-year and sequentially. Qnity therefore corroborated the demand backdrop; it did not justify importing Qnity’s sequential margin compression into Entegris’ model.
The near-term catalyst was Entegris’ same-morning management discussion and subsequent confirmation of Q3 execution. The longer-duration opportunity is increasing purity and material-performance requirements as advanced logic and memory architectures scale. The relevant monitoring distinction is growth from broad processing activity versus growth from individual formulation wins.
SEMICONDUCTOR EQUIPMENT: MORE PROCESS STEPS SUPPORT TOOL INTENSITY, BUT CONSUMABLES GROWTH IS NOT AN ORDER BOOK (READ-THROUGH 3)
Affected companies: Applied Materials Inc. (AMAT: US) and Ebara Corporation (6361: Japan). Direction: positive. Magnitude: moderate for relevant semiconductor-equipment businesses, with lower confidence in any immediate quarterly earnings revision.
Call evidence: Qnity described increasing layers, processing complexity, and packaging steps; identified CMP as its fastest-growing semiconductor portfolio; and reported strong Kalrez growth associated with “accelerated demand for wafer fab equipment.” Management also highlighted customer capacity construction and preparation for continued growth in 2027 and 2028.
The equipment transmission mechanism is additional process workload. More polishing and cleaning operations per wafer increase required tool-hours. More complex transistor and interconnect structures also increase demands on deposition, process integration, and manufacturing control. Applied Materials participates across these process categories, while Ebara has direct exposure through its CMP systems and semiconductor manufacturing equipment.
This creates a structural equipment-intensity opportunity, but the timing differs from consumables. Existing tools can initially process more wafers or operate at higher utilization, producing immediate materials demand without requiring new equipment orders. Incremental tool purchases follow when available capacity, process capability, or productivity becomes insufficient. Qnity’s materials growth therefore validates manufacturing activity more directly than it predicts new equipment bookings.
Kalrez adds a separate corroborating signal because high-performance sealing materials are used in demanding equipment environments. Nevertheless, Qnity did not allocate this demand to individual equipment manufacturers or distinguish new-tool production from replacement and service requirements. No specific Applied Materials or Ebara order should be inferred.
Applied Materials had already stated in May that it expected its semiconductor-equipment business to grow more than 30% in calendar 2026. Qnity supported that strong investment backdrop rather than establishing a previously unrecognized equipment upcycle. Applied’s August 13 results represented the next identifiable trading catalyst, particularly for customer spending, shipment timing, and supply-chain readiness. For Ebara, subsequent CMP order and backlog disclosures were the relevant confirmation point; the call alone does not establish a numerical forecast change.
The longer-duration implication is favorable exposure to process complexity and advanced packaging. The negative boundary is equally important: manufacturing capacity already installed or under construction can represent equipment orders previously booked. Treating every downstream materials ramp as a fresh upstream equipment order would double-count the same investment cycle.
LEADING-EDGE FOUNDRY: COMMERCIALIZATION EVIDENCE IMPROVES, BUT MATERIALS GROWTH DOES NOT MEASURE FOUNDRY SHARE OR YIELD (READ-THROUGH 4)
Affected company: Taiwan Semiconductor Manufacturing Company Limited (2330: Taiwan). Direction: positive. Magnitude: moderate fundamental confirmation, with limited standalone trading novelty.
Call evidence: Qnity reported continued growth at 3 nanometers, emerging activity at 2 nanometers, and “strong pull for 2 nanometer and 18A.” Management described broader successful commercialization across advanced-logic customers and an advanced-node portfolio mix approaching 40%, progressing toward its earlier 45%-50% objective faster than anticipated.
The relevant transmission mechanism for TSMC is conversion of technology investment into commercial wafer production and associated packaging demand. Rising consumption of qualified manufacturing materials provides supporting evidence that advanced-node programs are moving beyond development activity into production. TSMC’s established 3-nanometer franchise and N2 commercialization roadmap make it directly exposed to this transition.
The distinction between technological readiness and financial realization is important. Customer tape-outs and announced roadmaps do not produce meaningful foundry revenue until designs enter production at sufficient volume. Qnity’s commentary strengthens confidence in that production transition. Higher loading can subsequently improve capital absorption, although early-node startup costs and depreciation can initially constrain margin benefits.
The call does not support a precise TSMC revenue revision. Qnity’s growth reflects materials content, customer mix, utilization, and share gains. It is not a direct measure of TSMC wafer starts. Similarly, Qnity’s industry-level utilization figures should not be treated as TSMC-specific utilization, and the reference to multiple advanced-node platforms does not establish relative foundry share or device yields.
The near-term relevance was confirmation of an already visible commercialization roadmap, with subsequent revenue and node-mix disclosures providing the next tests. The longer-duration positive is sustained demand for advanced fabrication and packaging rather than a temporary inventory replenishment cycle. Supplier-materials evidence is strongest as a production cross-check, not as proof of foundry pricing power or returns on incremental capital.
HIGH-BANDWIDTH MEMORY: PRODUCTION RAMP CONFIRMATION IS STRONGER THAN ANY INFERENCE ABOUT INCREMENTAL PRICING (READ-THROUGH 5)
Affected companies: SK hynix Inc. (000660: South Korea) and Micron Technology Inc. (MU: US). Direction: positive. Magnitude: high relevance to their business mix and capital deployment, but modest incremental information relative to their own prior disclosures.
Call evidence: Management identified advanced logic and HBM as major semiconductor growth drivers, described successful commercialization of HBM technologies including HBM4, and reported DRAM utilization in the high-80% range. HBM and DRAM were also increasing within Qnity’s device exposure.
The mechanism is commercial production of more complex, higher-value memory products. HBM requires demanding fabrication, stacking, interconnect, and packaging processes. Rising materials consumption across these stages supports the interpretation that customer demand is translating into manufacturing activity rather than remaining at the qualification or announced-capacity stage.
For SK hynix and Micron, successful commercialization supports shipment growth and greater contribution from advanced memory products. It can improve absorption of investments in fabrication and packaging capacity. More complex HBM manufacturing also places demands on capacity and yield, limiting the usefulness of conventional DRAM wafer metrics as a complete measure of available output.
The novelty should not be overstated. SK hynix had already disclosed on July 29 that HBM4 mass shipments began in Q2, with production expected to ramp in 2H. Micron’s June 24 release had already stated that HBM4 was in high-volume shipments for its lead customer’s platform. Qnity therefore supplied an additional manufacturing-chain confirmation rather than revealing an unannounced product ramp.
The near-term catalysts were subsequent shipment, yield, customer-qualification, and product-mix disclosures. The longer-duration benefit is a larger contribution from differentiated memory and advanced packaging capabilities.
The call provides much less evidence about incremental pricing. High utilization and strong material demand do not establish a particular HBM contract price, conventional DRAM price increase, or future gross margin. Faster commercialization can also increase effective supply. The high-conviction positive is production execution and advanced-memory demand, not an independently quantifiable pricing upgrade.
THERMAL MATERIALS: AI CONTENT EXPANDS BEYOND THE PROCESSOR INTO OPTICS AND SYSTEM INTERFACES (READ-THROUGH 6)
Affected company: Henkel AG & Co. KGaA (HEN3: Germany). Direction: positive. Magnitude: meaningful for relevant electronics-materials franchises, but low to moderate at consolidated Henkel scale.
Call evidence: Thermal management was part of the strategic platform group growing more than 50%. Kemp stated that “thermal management is becoming a critical performance enabler,” while describing opportunities across chips, packages, boards, and data-center infrastructure. Qnity’s portfolio includes liquid thermal-interface materials, phase-change materials, pads, and gap fillers.
The precise mechanism is increased thermal-transfer demand at multiple physical interfaces. Higher power density and more tightly integrated systems increase the importance of controlling interface resistance, accommodating uneven surfaces, managing warpage, and preserving reliability. Qualified formulations can gain content and value even without proportional growth in the number of servers shipped.
Henkel has directly relevant exposure through its electronics materials and thermal-interface offerings. Its previously commercialized high-conductivity liquid thermal material for 800G and 1.6T optical transceivers illustrates an important extension of the opportunity: thermal-material demand is not confined to the main AI accelerator. Faster networking and optical components create additional interfaces requiring effective heat transfer.
This is a competitive market read-through, not an assertion that Henkel supplies Qnity. Both companies address overlapping customer engineering requirements. Qnity’s growth validates the category but does not allocate market share.
The near-term relevance was support for electronics demand entering Henkel’s August reporting period. Henkel’s July 31 announcement that it had expanded its Silicon Valley application center had already indicated stronger customer co-development activity, so Qnity provided corroboration rather than an entirely new signal.
The longer-duration opportunity is more qualified material content across AI systems and communications hardware. The consolidated magnitude remains constrained by Henkel’s much broader portfolio. Qnity’s platform growth cannot be transferred to Henkel’s overall sales or earnings.
Thermal-interface materials also complement, rather than generally replace, cold plates, liquid loops, pumps, and heat-rejection equipment. Improved interface performance is not, by itself, a negative demand signal for data-center cooling infrastructure.
CONSUMER PCS: PREMIUM-DEVICE RESILIENCE SHOULD NOT BE CONFUSED WITH A BROAD UNIT RECOVERY (READ-THROUGH 7)
Affected company: HP Inc. (HPQ: US). Direction: negative for the risk balance around mass-market PC units and margin conversion. Magnitude: moderate, particularly within Personal Systems; insufficient evidence for a specific EPS reduction.
Call evidence: Qnity expected a “muted seasonal peak in consumer electronics,” described consumer growth as slower than data-center and industrial growth, and attributed resilience to premium-device exposure and additional materials content. Management also warned that memory-related supply-chain dynamics could constrain mainstream-logic utilization improvement.
The transmission mechanism differs materially from the positive materials story. A supplier can grow through additional content in premium devices while total device shipments remain weak. A PC manufacturer must sell finished systems into price-sensitive demand and manage the complete bill of materials. Memory cost increases or constrained availability create a choice between absorbing costs, raising system prices, changing configurations, or limiting production.
That distinction was already visible in HP’s May results. Personal Systems revenue increased 13%, while total units declined 7%; consumer units declined 8%. Revenue growth therefore did not establish a broad unit recovery. HP also explicitly referenced rising commodity costs. Qnity’s premium-weighted resilience and muted seasonality were consistent with that divergence.
The negative implication is strongest for expectations that AI-enabled PCs will automatically drive rapid unit replacement across the market. Higher specification content can raise revenue per system without generating a comparable replacement cycle. If higher component costs are passed through, affordability can restrain units; if they are absorbed, operating margins are exposed.
The near-term catalyst was HP’s next quarterly report, particularly units, revenue per unit, component-cost recovery, and Personal Systems margin. The longer-duration risk is that increasing technical content raises system cost faster than mass-market users’ willingness to pay.
Counterevidence prevents an indiscriminate bearish conclusion. HP had delivered strong earnings and improved its annual outlook in May. Qnity also reported positive consumer-related growth, not a collapse. The high-conviction conclusion is unfavorable unit and cost sensitivity relative to AI infrastructure materials, not proof that HP would miss guidance.
CROSS-PORTFOLIO RISK: EXPOSURE ACROSS THE AI SUPPLY CHAIN IS LESS DIVERSIFIED THAN IT APPEARS (READ-THROUGH 8)
Affected companies: MKS Inc. (MKSI: US), Entegris Inc. (ENTG: US), Applied Materials Inc. (AMAT: US), Taiwan Semiconductor Manufacturing Company Limited (2330: Taiwan), SK hynix Inc. (000660: South Korea), and Micron Technology Inc. (MU: US). Direction: negative for portfolio diversification assumptions, not a forecast of immediate operating deterioration. Magnitude: potentially high for portfolios holding several of these exposures simultaneously.
Call evidence: AI-driven applications, high-performance computing, and advanced connectivity were repeatedly identified as the common drivers across Qnity’s businesses. Management said customers were allocating capacity to their highest-value applications and emphasized rapid data-center growth. Kemp also cautioned that the business remained tied to production volumes. The accompanying financial release showed approximately 80% of Qnity sales in Asia Pacific, reflecting manufacturing geography rather than ultimate consumer demand.
The transmission mechanism is a shared spending and production cycle. Equipment suppliers benefit when customers order and install capacity. Foundries and memory producers benefit when that capacity produces saleable devices. Materials suppliers benefit as wafers, packages, and boards move through production. These are different stages of substantially overlapping investment programs, not independent sources of demand.
If AI infrastructure deployment slows, the effects can arrive at different times: equipment orders can weaken first, customer inventory can then adjust, and material consumption can soften as utilization falls. The lag can create the appearance of diversification during the early stages of a downturn without providing durable protection. Conversely, simultaneous strength across these companies should not be counted as unrelated confirmation of multiple independent end-market recoveries.
Geographic exposure compounds the issue. Local manufacturing and technical support can reduce logistics friction, but do not eliminate dependence on concentrated fabrication and packaging locations. A materials supplier with local facilities near customers remains exposed if those customers’ production is disrupted. Qnity’s Asia Pacific sales mix should not be assigned mechanically to peers, but it reinforces the importance of mapping manufacturing dependencies rather than relying only on customer headquarters or listing country.
There was no disclosed immediate demand-break catalyst in the call. Management reported healthy order books and no near-term supply or output risk. The actionable near-term implication is therefore risk aggregation rather than a sector-wide short: customer capital-spending reductions, platform delays, inventory accumulation, or falling utilization would affect several positions through related channels.
Over 2027-2028, expanding capacity can amplify both outcomes. Successful commercialization supports multiple layers of supplier earnings, while an interruption in demand exposes more installed capacity and fixed costs. A portfolio combining equipment, foundry, memory, chemicals, and thermal exposures can remain highly concentrated in the same AI investment cycle despite appearing diversified by industry classification.
Report record
- Sector
- Information Technology
- Industry
- Semiconductors & Semiconductor Equipment
- Fiscal period end
- June 30, 2026
- Report date
- August 4, 2026
- Analysis
- 6318 words
- Read-throughs
- 3072 words
- Content fingerprint (PDF)
3557bc1c7601- Content fingerprint (analysis)
d1f31c1860e6- Content fingerprint (read-throughs)
44d7ea787cc3
Prepared from the company's earnings release and earnings call transcript. Figures as reported by the company. For information only. Not investment advice.
More from Qnity Electronics, Inc.
No other reports yet.
All Qnity Electronics, Inc. reports
More in Information Technology
Operating Thesis Strengthened; Cash Conversion Remains Unproven
Optical and IP Growth Validated; Cash Conversion Moved the Other Way
All Information Technology reports
Follow @AtlasPeakRes on X for new earnings reports as they publish.