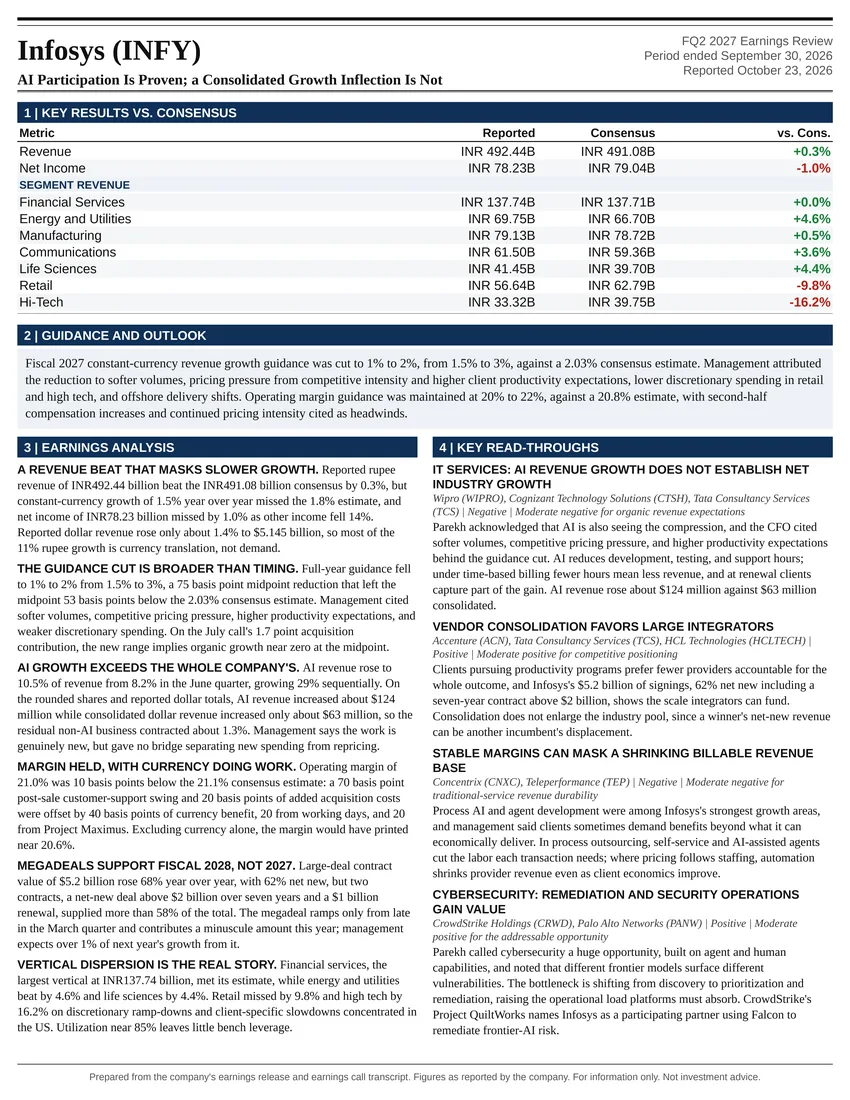
AI Participation Is Proven; a Consolidated Growth Inflection Is Not
Earnings Reports
SAP SE FQ3 2026 Earnings Report
SAP SE (SAP) FQ3 2026 earnings: The Commercial Case Strengthened More Than the Case for Immediate Earnings Acceleration. Full earnings analysis, key read-throughs, and the one-page exhibit from Atlas Peak Research.
SAP SE (SAP)
Sector: Information Technology · FQ3 2026 · Period end September 30, 2026 · Reported October 21, 2026
SAP’s Q3 2026 results support a constructive operating outlook but do not yet justify an unqualified acceleration thesis or a larger equity allocation.
Download the one-page report (PDF)
View one-page exhibit
Download analysis (.md)
Download read-throughs (.md)
Post to X
One-Page Exhibit
Earnings Analysis
EXECUTIVE CALL SUMMARY: SAP SE (10/21/26)
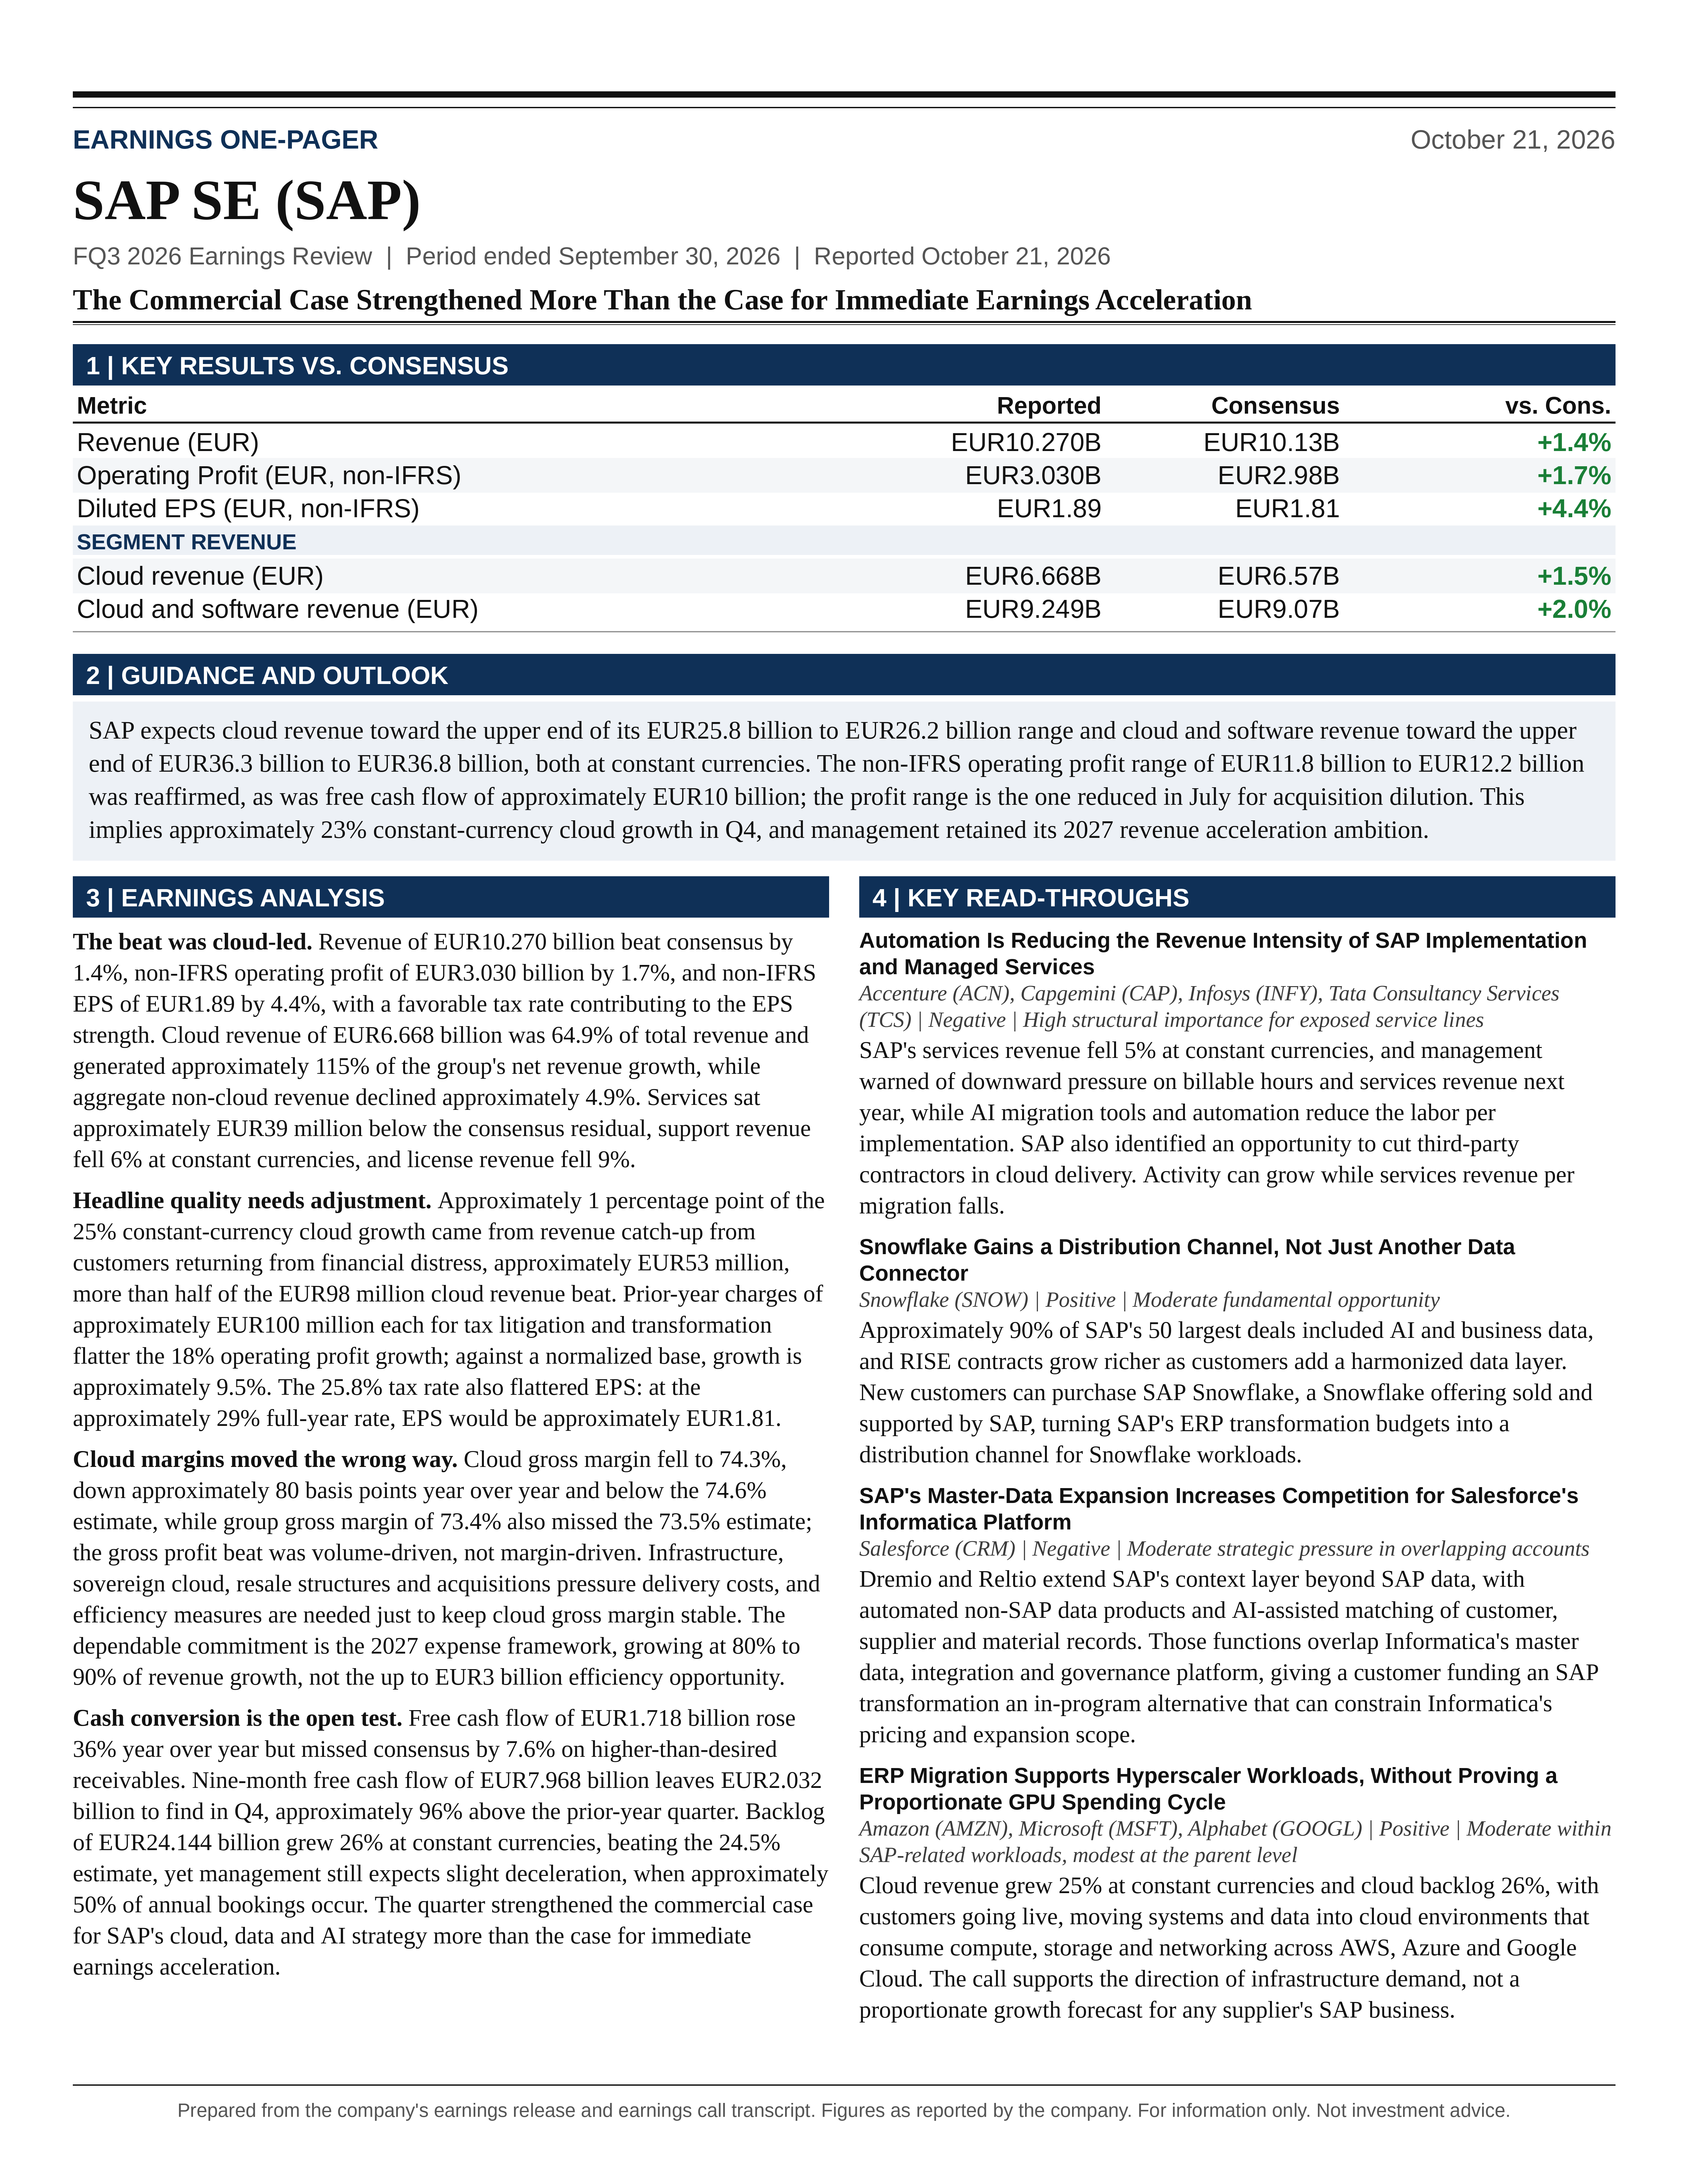
SAP’s Q3 2026 results support a constructive operating outlook but do not yet justify an unqualified acceleration thesis or a larger equity allocation. Current cloud backlog growth of 26% at constant currencies, cloud revenue growth of 25%, and stronger adoption of AI and data products demonstrate continued demand for SAP’s cloud transformation offering. However, approximately 1 percentage point of cloud growth came from temporary effects, operating profit benefited materially from depressed prior-year comparisons, cloud gross margin declined, and free cash flow missed consensus. The appropriate investment stance is to maintain measured exposure rather than increase positions solely on the headline earnings beat. Q4 bookings, cash collections, and the credibility of the 2027 growth and expense framework are now the decisive variables.
Revenue reached EUR10.270 billion, exceeding the supplied Bloomberg consensus by 1.4%, while non-IFRS operating profit of EUR3.030 billion exceeded consensus by 1.7%. Non-IFRS EPS of EUR1.89 beat expectations by 4.4%, although the quarter’s favorable tax rate contributed to the strength of earnings. Current cloud backlog growth exceeded the 24.5% consensus by 1.5 percentage points. These are positive results, but the stronger earnings metrics were accompanied by a 30-basis-point cloud gross margin miss and a 7.6% free cash flow shortfall.
The guidance change was narrower than a conventional increase in full-year forecasts. SAP now expects cloud revenue and cloud and software revenue toward the upper ends of their existing ranges. The numerical ranges themselves were unchanged, as were operating profit, free cash flow, and current cloud backlog guidance. Importantly, the operating profit range being reaffirmed is the range reduced in July to accommodate acquisition dilution. Management also retained its 2027 revenue acceleration ambition while emphasizing greater execution risk around that objective. The call therefore improved confidence in near-term revenue delivery more than it improved confidence in incremental profitability or the durability of acceleration.
REPORTED PERFORMANCE AND THE CONSENSUS BRIDGE
SAP’s official Q3 release shows revenue rising from EUR9.076 billion to EUR10.270 billion, an increase of 13% at reported exchange rates and 12% at constant currencies. Cloud revenue increased from EUR5.290 billion to EUR6.668 billion, representing 26% reported growth and 25% constant-currency growth. Cloud and software revenue increased from EUR8.016 billion to EUR9.249 billion, up 15% reported and 14% at constant currencies. The distinction between reported and constant-currency growth is material because foreign exchange modestly supported Q3 reported revenue, whereas it had been a significant headwind earlier in 2026.
Against the supplied Bloomberg consensus, total revenue exceeded expectations by EUR140 million, cloud revenue by EUR98 million, and cloud and software revenue by EUR179 million. The difference between the cloud and software beat and the total revenue beat implies that services revenue was approximately EUR39 million below the corresponding consensus residual. Thus, the quarter combined stronger subscription and software revenue with weaker services performance, rather than delivering uniformly positive surprises across the business.
Non-IFRS gross profit of EUR7.543 billion exceeded consensus by EUR133 million, or 1.8%. Nevertheless, the 73.4% group gross margin was slightly below the 73.5% estimate, and the 74.3% cloud gross margin was below the 74.6% estimate. Revenue volume, rather than stronger gross margin realization, drove the gross profit beat. The cloud margin shortfall alone represents approximately EUR20 million of gross profit relative to a 74.6% margin applied to actual cloud revenue.
Non-IFRS operating profit increased from EUR2.566 billion to EUR3.030 billion, up 18%, while the reported operating margin increased from 28.3% to 29.5%. IFRS operating profit increased from EUR2.487 billion to EUR2.930 billion. The approximately EUR100 million difference between IFRS and non-IFRS operating profit is relatively modest compared with the overall profit base. SAP’s reporting framework includes stock-based compensation in non-IFRS results, so the operating performance should not be evaluated as though equity compensation were excluded from adjusted earnings.
The supplied earnings notice’s EUR2.27 billion profit after tax corresponds to IFRS profit, not non-IFRS profit. The official release reports IFRS profit after tax of EUR2.269 billion and non-IFRS profit after tax of EUR2.171 billion. IFRS EPS was EUR1.96, versus non-IFRS EPS of EUR1.89. Maintaining this distinction is necessary when evaluating earnings quality and comparing results with adjusted consensus estimates.
GROWTH QUALITY AND HISTORICAL COMPARABILITY
The apparent sequential improvement in cloud growth needs qualification. Constant-currency cloud revenue growth increased from 24% in Q2 to 25% in Q3, but management disclosed approximately 1 percentage point of favorable quarter-specific effects, mainly revenue catch-up from customers returning from financial distress. Excluding that disclosed contribution, Q3 cloud growth was approximately 24%, broadly consistent with Q2 rather than evidence of a clear underlying acceleration. This adjustment does not remove acquisitions or normalize every comparison effect.
Using the prior-year cloud revenue base, 1 percentage point of growth represents approximately EUR53 million. That is slightly more than 50% of the EUR98 million cloud revenue beat. This calculation is approximate because management’s growth contribution is stated at constant currencies, but it establishes the scale of the benefit. The underlying business still appears to have exceeded expectations after removing the disclosed temporary contribution, although the magnitude of that outperformance is substantially smaller than the headline result.
The revenue catch-up is economically preferable to permanent customer loss, but it should not be capitalized as a recurring increase in the quarterly run rate. Nor does recognition of previously deferred revenue establish that an equivalent amount of cash was collected during the quarter. The associated profit contribution was not separately disclosed, preventing a precise normalization of the operating profit beat. Given the approximately EUR53 million revenue contribution compared with the EUR50 million operating profit beat, its potential influence on the earnings surprise is material.
Acquisitions also contributed to growth. SAP’s written release identifies EUR49 million of Q3 revenue from Reltio, Dremio, and Prior Labs. This represents approximately 0.5% of quarterly revenue and approximately 4% of the reported year-over-year revenue increase. The contribution is not large enough to explain the overall growth performance, but it means that reported growth should not be characterized as entirely organic. The disclosure does not allocate all acquired revenue to the cloud line, so subtracting the entire EUR49 million from cloud revenue would be inappropriate.
Management additionally identified approximately 0.5 percentage point of cloud growth benefit associated with the SmartRecruiters acquisition comparison. SmartRecruiters entered SAP’s results on 09/11/25, creating a fuller acquisition contribution in Q3 2026 than in the comparison quarter. That benefit largely disappears in Q4. The combination of revenue catch-up, acquisition effects, and changing prior-year comparisons explains why 25% Q3 cloud growth should not be extrapolated mechanically.
Historical comparisons reinforce this distinction. Q3 2025 cloud revenue grew 27% at constant currencies, compared with 25% in Q3 2026. Cloud ERP Suite growth moderated from 31% to 28%, while current cloud backlog growth moved from 27% to 26%. Total revenue growth nevertheless improved from 11% to 12%. SAP is therefore producing faster consolidated growth despite somewhat slower growth in its largest growth engine, principally because cloud now represents a larger proportion of the business.
Cloud revenue accounted for 64.9% of total revenue, compared with 58.3% a year earlier. Its EUR1.378 billion increase exceeded the EUR1.194 billion increase in consolidated revenue, meaning that cloud generated approximately 115% of the group’s net revenue growth. Aggregate non-cloud revenue declined approximately 4.9%. This is the central financial characteristic of the quarter: the cloud transition is increasingly powerful at the consolidated level, but the rest of the revenue base remains a material offset.
CURRENT CLOUD BACKLOG AND THE Q4 EXECUTION TEST
Current cloud backlog reached EUR24.144 billion, compared with EUR18.839 billion a year earlier and EUR22.929 billion at the end of Q2. Constant-currency growth remained at 26%, matching Q2 and exceeding consensus. The sequential reported increase of approximately EUR1.215 billion is positive, but it is not a measure of quarterly bookings because backlog also changes through revenue recognition, contract timing, foreign exchange, and acquisitions.
The quality of this result lies in the combination of scale and sustained growth. Maintaining 26% expansion on a substantially larger backlog base requires meaningful absolute additions to contracted business. However, the call did not provide a complete bridge among new customers, migrations, additional products, pricing, renewals, and acquisitions. The suggestion in the analyst questioning that organic backlog growth accelerated was not supported by a sufficiently detailed numerical reconciliation to establish that conclusion independently.
Management retained its expectation for a slight deceleration in full-year current cloud backlog growth relative to the 25% achieved at the end of 2025. In response to the suggestion that guidance implied approximately 23%, Asam stated that “the upper end of that range might be 24% or so.” He explicitly resisted treating 23% as a precise point forecast. The appropriate interpretation is unchanged qualitative guidance with some flexibility around the outcome, not a newly established formal 23%-24% range.
This creates a meaningful tension between current performance and the year-end framework. Backlog growth has remained at 26%, yet management continues to allow for slower growth at the most important measurement date. The explanation is that Q4 represents approximately 50% of annual bookings volume. Consequently, the strength of the completed quarters does not eliminate execution risk across the largest portion of the annual sales cycle.
The call did not identify a specific deterioration in the pipeline, a surge in cancellations, or a measurable extension in sales cycles. Klein described the Q4 pipeline as strong and said AI and data were increasing the scope of RISE contracts. Asam’s caution centered on macroeconomic uncertainty, higher energy costs, interest rates, and the volume of business still requiring closure. These observations support a distinction between a healthy pipeline and a less certain conversion environment. Pipeline strength is necessary, but signed commitments remain the relevant evidence.
Current backlog growth also cannot be translated directly into the following year’s cloud revenue growth. Contract start dates, deployment schedules, recognition patterns, customer distress, and transactional revenue affect the conversion. This limitation becomes more important as consumption-based arrangements increase. For the immediate 2027 bridge, however, management indicated that the existing relationship between current backlog and cloud revenue remains substantially intact.
2026 GUIDANCE: A HIGHER EXPECTED OUTCOME, NOT HIGHER RANGES
SAP now expects cloud revenue toward the upper end of EUR25.8 billion-EUR26.2 billion at constant currencies, compared with EUR21.02 billion in 2025. The range continues to represent approximately 23%-25% growth. Cloud and software revenue is now expected toward the upper end of EUR36.3 billion-EUR36.8 billion, compared with EUR32.54 billion in 2025, representing approximately 12%-13% growth.
These are favorable changes in expected positioning within unchanged ranges. They should not be described as increases in the numerical endpoints or interpreted as commitments to exceed the upper bounds. The distinction matters because a shift toward the top of a previously disclosed range generally supports smaller earnings revisions than a reset of the range itself.
Non-IFRS operating profit guidance remains EUR11.8 billion-EUR12.2 billion at constant currencies, representing approximately 13%-17% growth. SAP’s 07/23/26 release reduced this range from EUR11.9 billion-EUR12.3 billion to reflect more than EUR100 million of anticipated dilution from the Dremio and Prior Labs acquisitions closed in July. Q3 did not reverse that reduction. Revenue expectations have improved, but the additional confidence has not been translated into a higher profit range.
Free cash flow guidance remains approximately EUR10 billion at actual exchange rates, compared with EUR8.24 billion in 2025. The expected non-IFRS effective tax rate remains approximately 29%. The distinction between constant-currency income statement guidance and actual-currency cash flow guidance must be preserved. Subtracting reported year-to-date revenue or profit directly from constant-currency annual guidance would produce an unreliable quarterly bridge without an exchange-rate adjustment.
Asam indicated that the updated revenue positioning implies approximately 23% constant-currency cloud growth in Q4. The moderation from Q3’s 25% is consistent with the disappearance of temporary revenue benefits, the anniversary of SmartRecruiters, and the effect of slower backlog growth entering the year from Q4 2025. The quarter therefore does not require a sudden demand deterioration to explain management’s implied Q4 cloud trajectory.
SAP’s published currency assumptions indicate a potential Q4 reported growth benefit of approximately 2 percentage points for cloud revenue, 1.5 percentage points for cloud and software revenue, and 1 percentage point for operating profit if 09/30/26 exchange rates persist. Approximately 23% constant-currency cloud growth could therefore translate into roughly 25% reported growth. A strong reported Q4 number could coexist with sequential moderation in the underlying growth rate.
The macroeconomic qualification also changed. July guidance assumed near-term de-escalation of the Middle East conflict. The Q3 release specifically conditions the current cloud backlog outlook on a stable macroeconomic environment in Q4. This is a revised assumption, not evidence that macroeconomic sensitivity has disappeared.
2027 ACCELERATION: STILL POSSIBLE, BUT MORE CONDITIONAL
The most consequential forward-looking passage was Asam’s statement that “we continue to believe that we are well-positioned to accelerate total revenue growth in 2027.” That position was followed by explicit qualifications concerning Q4 bookings, continued services revenue pressure, and a higher 2026 comparison base. The ambition remains intact, but management devoted substantial attention to explaining why its delivery has become more demanding.
The 2027 acceleration objective and the expense-growth framework were already present in SAP’s July release. Their reiteration in October is not new guidance. The new information is the increased confidence in 2026 cloud and software revenue and the more detailed discussion of the obstacles to the following year’s acceleration.
There is also relevant historical context. SAP’s October 2025 release referred to an ambition for accelerating total revenue growth in 2026. The current formal framework instead anticipates 2026 constant-currency revenue growth at a similar level to 2025’s 10.6%, followed by acceleration in 2027. This does not negate the strong Q3 result, but it argues against assigning full valuation credit to an acceleration ambition before it is demonstrated in annual guidance and realized results.
The arithmetic of the revenue mix remains favorable. A larger cloud contribution can produce faster group growth even if cloud growth remains stable or moderates slightly. Conversely, accelerating support attrition and a more aggressive reduction in services billings can consume part of that benefit. The relevant forecasting task is therefore to model the revenue lines separately rather than assume that cloud growth alone determines consolidated growth.
Using an illustrative revenue mix of 64% cloud, 25% software support, 1% licenses, and 10% services, 23% cloud growth contributes approximately 14.7 percentage points to consolidated growth. An 8% support decline, 15% license decline, and 7% services decline collectively subtract approximately 2.9 percentage points, leaving approximately 11.9% group growth. This is an analytical sensitivity, not management guidance, but it demonstrates how respectable cloud growth can still produce only modest consolidated acceleration.
OPERATING PROFIT QUALITY AND THE MARGIN FRAMEWORK
Reported operating leverage was positive. Non-IFRS operating profit increased EUR464 million on a EUR1.194 billion revenue increase, producing an approximately 38.9% incremental operating margin. Total operating costs, including cost of revenue, increased approximately 11.2%, below reported revenue growth of approximately 13.2%. On the unadjusted reported figures, SAP demonstrated the intended relationship between revenue growth and cost growth.
The prior-year comparison materially flatters that result. Q3 2025 included approximately EUR100 million of expense related to a change in case law affecting other tax litigation and approximately EUR100 million related to workforce transformation. Both affected IFRS and non-IFRS operating profit. Their absence accounts for approximately 43% of the EUR464 million reported increase in non-IFRS operating profit.
Adding those approximately EUR200 million of charges back to the prior-year comparison produces a normalized Q3 2025 operating profit base of approximately EUR2.766 billion. Against that base, Q3 2026 operating profit growth is approximately 9.5%, rather than 18%. The corresponding prior-year operating margin would be approximately 30.5%, above the current 29.5%. This is an analyst normalization of identified comparison effects, not a comprehensive measure of underlying profitability, because it does not normalize every current-year item.
Acquisition dilution provides an important counterweight. Reltio, Dremio, and Prior Labs contributed a combined negative EUR39 million to non-IFRS operating profit and negative EUR59 million to IFRS operating profit in Q3. Adding back the EUR39 million current-period effect while also adjusting the prior-year base would produce approximately 11.0% non-IFRS operating profit growth. The acquired businesses currently bring costs ahead of material revenue contribution, but those costs also represent investments in the intended AI and data architecture.
Cloud gross margin declined to 74.3% from 75.1% a year earlier, a reduction of approximately 80 basis points at reported currencies and 70 basis points at constant currencies. It also declined from 74.6% in Q2. Cloud gross profit still increased strongly, but cost of cloud delivery grew faster than cloud revenue. The quarter therefore does not establish that rising AI adoption is already delivering superior cloud unit economics.
Management identified several offsetting forces: infrastructure and hardware costs, sovereign cloud investment, expanding resale arrangements, Business Data Cloud structures, and acquisitions on the negative side; model selection, automation, and reduced reliance on contractors on the positive side. The most relevant qualification was that these efficiency measures are needed to keep cloud gross margin stable. The discussion did not amount to a firm commitment to significant near-term cloud gross margin expansion.
The 2027 expense framework is nevertheless economically meaningful. Management intends total non-IFRS operating expenses, including cost of revenue, to grow at 80%-90% of the revenue growth rate. This does not mean expenses will equal 80%-90% of revenue. At 12% revenue growth, it implies cost growth of approximately 9.6%-10.8%. Starting from a 29.5% operating margin, that relationship would generate approximately 14.9%-17.7% operating profit growth and approximately 76-151 basis points of margin expansion, assuming consistent accounting and business scope.
The stated opportunity for up to EUR3 billion of efficiency gains over approximately 2 years should not be added mechanically to operating profit. The call did not establish whether that figure represents cumulative savings, an exit run rate, gross capacity released, or net savings after reinvestment. Acquisitions, product investment, cloud delivery requirements, compensation, and adoption support may absorb a significant portion. The more dependable commitment is the expense-growth relationship, not a simple EUR3 billion uplift to earnings.
CASH FLOW, COLLECTIONS, TAX, AND CAPITAL ALLOCATION
Free cash flow of EUR1.718 billion increased 36% year over year but fell EUR142 million below consensus. Operating cash flow increased 28% to EUR1.920 billion. Quarterly free cash flow represented approximately 16.7% of revenue and 56.7% of non-IFRS operating profit. Seasonal cash conversion makes a direct quarterly profit comparison imperfect, but the consensus shortfall remains relevant given the simultaneous earnings beat.
Asam explicitly acknowledged that receivables were higher than desired, stating, “we have to tighten the screws on our collections a little bit more.” This is more informative than the general description of cash flow as robust. It identifies working capital execution as an active issue and indicates that recognized revenue was not translating into cash as quickly as management preferred.
For the 9-month period, free cash flow reached EUR7.968 billion, up approximately 11%, compared with approximately 14% reported growth in non-IFRS operating profit. Delivering EUR10 billion for the year requires approximately EUR2.032 billion in Q4. Based on the published EUR8.24 billion 2025 annual total and EUR7.205 billion generated through Q3 2025, the prior-year Q4 contribution was approximately EUR1.035 billion. The remaining 2026 requirement therefore implies approximately 96% year-over-year Q4 growth, subject to rounding in the annual figures.
That is a meaningful execution hurdle despite management’s confidence. It does not establish that guidance is unattainable, because collections and payment timing can produce substantial quarterly volatility. It does mean that the annual cash target depends on more than maintaining the Q3 run rate. Improved collections must be evaluated alongside migration-credit utilization, taxes, and other cash outflows.
Migration credits represent a separate cash consideration from AI consumption pricing. Management reiterated that migration incentives will affect free cash flow as customers use them, while indicating that the effect remains manageable within the annual target. The call did not quantify the outstanding incentive balance or its expected cash utilization profile. Consequently, the durability of cash conversion cannot be fully assessed from earnings growth alone.
The non-IFRS effective tax rate was 25.8%, below 27.9% in Q3 2025 and below the approximately 29% full-year expectation. Holding pretax earnings and share count constant, applying a 29% rate would reduce non-IFRS EPS from EUR1.89 to approximately EUR1.81. This sensitivity is close to the supplied consensus EPS, but it does not establish that the entire EPS beat came from taxes because the consensus tax assumption was not supplied. It does establish that the quarterly EPS outcome should not be annualized at the Q3 tax rate.
Capital returns also contributed to the per-share backdrop. SAP had repurchased approximately EUR4.2 billion of shares under its EUR10 billion program by 09/30/26, compared with approximately EUR2.6 billion by 06/30/26. The disclosed share counts and average prices imply approximately EUR1.53 billion of purchases during Q3, close to the quarter’s EUR1.72 billion free cash flow. Buybacks support per-share growth, but their attractiveness depends on purchase valuation and must be assessed alongside dividends and acquisition spending rather than treated as independent value creation.
AI COMMERCIALIZATION: STRONGER EVIDENCE, INCOMPLETE MONETIZATION DISCLOSURE
The most persuasive strategic message was that AI is increasingly influencing the purchase of SAP’s existing platform and applications, not merely adding an optional product category. Klein stated, “Our strategy is not just resonating, it’s being adopted.” Management identified 3 commercial mechanisms: faster migration, a stronger economic case for the application suite, and demand for the AI and data platform required to support deployment.
Approximately 90% of the 50 largest deals included AI and business data. That is strong evidence of commercial relevance within major transactions. It is not a disclosure of the proportion of revenue attributable to AI, the incremental annual contract value generated by AI, or the share of paid production usage. Attachment can reflect meaningful incremental monetization, promotional inclusion, or a combination. The call did not quantify the split.
Management’s description of richer RISE contracts is more important than the attachment statistic alone. Customers are reportedly combining ERP migration with AI capabilities, Business Data Cloud, and a more harmonized data layer. If those additions increase recurring contract value without proportionate delivery costs, SAP can capture a larger portion of the customer’s transformation budget. However, the absence of separate pricing, retention, expansion, and consumption disclosures prevents a precise estimate of the incremental economics.
Cloud ERP Suite revenue increased 28% at constant currencies to EUR5.924 billion and represented approximately 88.8% of cloud revenue. Its EUR1.338 billion reported increase accounted for approximately 97% of the increase in total cloud revenue. Extension Suite revenue grew 8% at constant currencies, while IaaS revenue declined 27%. The strategic suite is overwhelmingly responsible for growth, but Cloud ERP Suite is a broad category encompassing applications and platform offerings. It is not a standalone ERP or AI revenue measure.
Named wins and deployments provide useful evidence of breadth. AstraZeneca’s AI co-development, Henkel’s finance use cases, and Business Data Cloud selections by Austrian Post and Fraport support demand across industries and functions. Go-lives at companies including Mondelez, Panasonic, Roche, and Infosys show that activity extends beyond contract signing. Nevertheless, selected customer references do not establish average deployment duration, cohort-level returns, retention, or the proportion of customers progressing to scaled production.
Management cited customer outcomes including up to 66% improvement in time to shelf and up to 70% reduction in manual category-management time. These illustrate potentially attractive use cases, but they are selected company-reported results rather than independently validated portfolio averages. Their investment relevance depends on repeatability, implementation cost, and how much of the resulting value SAP can monetize.
The reported internal productivity metrics require similar discipline. Approximately 70% more code contributions do not establish a 70% improvement in useful software output, quality, or developer cost efficiency. Approximately 20% productivity gains in central functions do not automatically produce a corresponding reduction in expense. The monetizable evidence will be lower delivery costs, faster deployment, reduced external spending, improved sales productivity, and sustained expense growth below revenue growth.
TECHNICAL DIFFERENTIATION AND PRODUCT EXECUTION RISK
SAP’s strongest potential AI advantage is the combination of business context, transaction execution, authorization, and auditability. A general-purpose model can interpret a supplier contract, but an enterprise system must also identify the authorized alternative supplier, validate master data, respect approval policies, and execute the transaction correctly. SAP’s existing position in systems of record gives it a credible foundation for connecting reasoning to controlled business actions.
Management described a knowledge graph spanning more than 7 million fields, 500,000 tables, and 400 data products. Dremio and Reltio are intended to extend the context layer beyond SAP-controlled data, while the proposed TechWolf acquisition would add workforce and skills intelligence. The strategic logic is coherent: enterprise agents become more valuable when they can operate across a consistent representation of customers, suppliers, materials, employees, and processes.
The investment case depends on usable context rather than the size of the data catalog. Klein acknowledged that “not everything works out of the box” and emphasized the continuing need for a clean core. Poor data quality and heavily customized customer landscapes can delay AI deployment even when the software itself is capable. Migration tools may reduce implementation effort, but they do not eliminate organizational, process, and data-remediation requirements.
Agent accuracy and response time remain explicit development priorities. Management discussed tracing queries through the data layer, ontology, and APIs, including situations in which agents enter loops. These comments are consistent with a product category still undergoing substantial engineering refinement. They should temper interpretations that a fully autonomous enterprise is already a broadly proven production state.
The reference to 95% accuracy arose in a discussion of internal testing standards, not as a verified production benchmark. For illustration, 95% independent success at each of 10 required steps would produce approximately 60% success across the complete sequence before retries, validation, or human intervention. Actual workflows differ materially from that simplified calculation, but it demonstrates why isolated task accuracy cannot substitute for end-to-end business-process reliability.
The claim that Joule delivers 2x the accuracy of leading frontier models in Ariba at 50% of the token cost is potentially meaningful but lacks sufficient benchmark disclosure for independent validation. The test population, model versions, definitions of accuracy, and treatment of retrieval, orchestration, hosting, and human review were not specified. Lower token expense is not equivalent to a proportionate reduction in total cost per completed business outcome.
Model choice provides a genuine strategic option. Access to more than 70 models and increasing use of open-weight models can reduce dependence on a particular provider and improve price-performance through routing. The offset is the engineering burden of evaluation, security, regression testing, and governance across a changing model landscape. The relevant economic metric is cost per reliably completed workflow, not model count.
The call’s broad statements about customer data protection also require contractual and architectural precision. The assertion that customer data and process intellectual property are not uploaded into large language models was not accompanied by a detailed explanation distinguishing training, inference, hosting, retention, and logging. Later references to training models do not establish a contradiction or misuse of customer data, but the language is insufficient to characterize every deployment arrangement.
The question about headless software was not substantively resolved in the available exchange following the audio interruption. SAP may retain economic relevance as the transaction and governance layer even when users interact through another interface. However, retention of the backend does not automatically ensure control of the user relationship, orchestration layer, or AI pricing. The relative bargaining power of application vendors, model providers, and competing assistants remains an open strategic issue.
SERVICES, SUPPORT ATTRITION, AND MIGRATION ECONOMICS
Services revenue declined 5% at constant currencies to EUR1.021 billion, compared with a 2% decline in Q2 and 6% growth in Q3 2025. Management attributed the current strategy to redeploying services toward adoption rather than maximizing billable hours. Asam described the economic logic as converting low-margin consulting activity into recurring AI and data business.
This is rational if the additional recurring gross profit exceeds the foregone services contribution and the ongoing cost of adoption support. It is not economically costless. Employees and contractors remain expenses unless capacity is eliminated, redeployed efficiently, or offset by future revenue. Reduced billings can precede the subscription benefits, creating a timing mismatch between strategic value creation and near-term reported growth.
At approximately EUR1 billion of quarterly services revenue, each additional 5 percentage points of annual decline represents roughly EUR200 million of annual revenue pressure, or approximately 0.5 percentage point of growth on a EUR40 billion revenue base. Management’s warning of further services pressure in 2027 is therefore large enough to affect the consolidated acceleration objective even if the long-term economics are favorable.
Software support revenue declined 6% at constant currencies to EUR2.434 billion, while license revenue declined 9% to EUR147 million. Support remains approximately 24% of quarterly group revenue and is therefore a much larger forecasting variable than perpetual licenses. Faster cloud migration can increase recurring cloud revenue while accelerating the runoff of historically attractive support economics. The appropriate measure is the net lifetime value gained from migration, not cloud growth viewed in isolation.
The approaching maintenance deadlines support migration urgency without creating a universal 2027 conversion deadline. SAP’s 10/07/26 maintenance communication confirms mainstream Business Suite 7 maintenance through 12/31/27 and optional extended maintenance through 12/31/30. A conditional transition offering is available for qualifying customers through 2033. These options provide customers with flexibility, making a sudden, mandatory migration surge in 2027 an inappropriate base assumption.
REGIONAL PERFORMANCE, CONCUR, AND COMPETITIVE READ-THROUGHS
APJ and EMEA again outperformed the Americas in cloud growth. Management attributed the relative Americas profile partly to greater existing cloud penetration, rather than weaker AI adoption. North American customers were described as particularly active in AI experimentation and co-development. Regional growth differences should therefore be evaluated against migration maturity and revenue mix, not interpreted automatically as evidence of regional AI competitiveness.
Concur’s defense centered on expense management, compliance, and deep integration into finance workflows rather than travel booking. Management also described strong agent adoption within Concur and prospective partnerships with card providers and airlines. This is a credible explanation of incumbent durability, but the call did not disclose competitive win rates, retention, or standalone growth sufficient to resolve the challenge from faster-growing entrants.
The transactional business returned to positive growth after hovering around flat or slightly negative performance. Asam’s qualification was explicit: it is “reducing the headwind as opposed to being a tailwind.” Its growth remains below the overall cloud average. Stabilization improves the aggregate growth mix, but it should not be modeled as a new major accelerator.
The broader software read-through is favorable for vendors that control critical business records and can convert AI into governed execution. It is less favorable for undifferentiated billable-hour models and isolated applications lacking proprietary context or transaction authority. Even so, SAP’s results do not independently establish that every system-of-record vendor will preserve pricing or that all services firms will experience declining economics. Distribution, integration quality, and monetization remain company-specific.
SCENARIO ANALYSIS AND INVESTMENT IMPLICATIONS
A base case with a 55% probability assumes approximately 23% cloud growth in 2027, an 8% support decline, a 15% license decline, and a 7% services decline. Using the illustrative 64%/25%/1%/10% revenue mix, these assumptions produce approximately 11.9% consolidated growth. If total operating costs grow at approximately 85% of the revenue growth rate, a 29.5% starting operating margin would generate approximately 16% operating profit growth. This scenario assumes successful Q4 execution, stable cloud gross margin, and a largely traditional backlog-to-revenue conversion.
A bull case with a 25% probability assumes 25% cloud growth, a 6% support decline, a 10% license decline, and a 3% services decline. The resulting consolidated growth is approximately 14.1%. Cost growth at 80% of revenue growth would produce approximately 21% operating profit growth from the same illustrative margin base. This outcome requires stronger monetization of AI and data, faster deployments, and efficiency gains that exceed the costs of expansion.
A bear case with a 20% probability assumes 19% cloud growth, a 10% support decline, a 25% license decline, and a 12% services decline. Consolidated growth would be approximately 8.2%. If costs fail to flex according to the stated framework, operating profit growth could fall to approximately 5%-8%, with the possibility of weaker outcomes if collections, customer distress, or acquisition integration deteriorate simultaneously. This scenario would invalidate the near-term acceleration thesis.
These probabilities are judgmental scenario weights, not statistical forecasts or company guidance. Their principal implication is that durable earnings growth remains plausible without a return to faster cloud growth, but the difference between attractive and mediocre equity returns may depend heavily on valuation. For example, 15% EPS growth combined with 15% earnings-multiple compression produces approximately a 2% share-price decline before dividends. Strong operating performance alone does not guarantee a positive investment return.
The supplied Bloomberg notice reported a 6.6% ADR increase after results. That reaction appears more consistent with improved confidence and reduced concern about the cloud outlook than with the approximately 1.7% operating profit beat alone. The call supports some reduction in near-term demand risk, but not the elimination of valuation, margin, or Q4 execution risk. No verified post-call valuation multiple is available to establish whether that repricing leaves an attractive margin of safety.
The appropriate action is therefore to hold measured existing exposure while requiring additional evidence before increasing conviction. For an otherwise diversified portfolio, an illustrative 1%-2% NAV allocation is more consistent with the remaining event risk than a concentrated position. A 12% entry-relative stop would imply approximately 12-24 basis points of planned NAV loss, although gaps and liquidity can produce larger realized losses. This is a risk-sizing framework rather than a portfolio-specific instruction, since existing holdings, factor exposures, and entry prices are not available.
The intended investment horizon is approximately 6-12 months, with the Q4 results as the immediate decision point. SAP provides exposure to recurring enterprise software and business-process modernization rather than direct AI infrastructure spending, but it still carries growth-duration, interest-rate, enterprise IT-budget, and AI-expectation risk. It should not be assumed to diversify an existing software-heavy portfolio merely because its customer workflows are mission-critical.
The main positive catalysts are product and deployment evidence at TechEd following the call, Q4 bookings and collections, the formal 2027 outlook, and the expected Q1 expansion of automated non-SAP data-product capabilities. Over the subsequent 12 months, contractor reductions and cloud-delivery automation should provide evidence on whether internal productivity claims are becoming financial savings.
The main thesis review triggers are a material backlog shortfall, cloud revenue growth below the trajectory implied by existing commitments, a reduction in annual cash flow expectations, persistent deterioration in cloud gross margin, or failure to maintain the promised relationship between revenue and expense growth. Analyst-defined warning levels would include current cloud backlog growth below approximately 22%, cloud gross margin below approximately 73.5% without a credible recovery bridge, or a 2027 outlook combining no revenue acceleration with weaker operating leverage. These are investment thresholds, not management guidance.
The central conclusion is that Q3 strengthened the commercial case for SAP’s cloud, data, and AI strategy more than it strengthened the case for immediate earnings acceleration. The business continues to generate substantial recurring growth, but temporary revenue benefits, favorable profit comparisons, tax support, and collection requirements limit the quality of the headline beat. Sustained upside depends on converting richer contracts and stronger adoption into cash-generative growth while preserving delivery economics.
SOURCE AND INTERPRETATION NOTES
Financial comparisons use SAP’s company-issued Q3 2026, Q2 2026, and Q3 2025 releases, the supplied earnings-call transcript, and the supplied Bloomberg consensus notice. Direct quotations are from the supplied Q3 call. Growth rates are stated at constant currencies unless identified otherwise; euro amounts are reported figures unless explicitly described as constant-currency guidance.
The transcript is an initial draft with audio interruptions, apparent speaker-label reversals, and garbled passages. Uncertain Q&A statements are attributed to management rather than assigned definitively to a particular executive. The apparent reference to EUR2.2 billion of prior-year cloud effects was not corroborated and is excluded from the numerical analysis. The complete supplemental PDF footnote reconciliation was not available in readable form, limiting further normalization. Live Bloomberg pricing was unavailable, so the supplied ADR reaction is treated as a contemporaneous notice rather than a verified closing return.
COMPANY EMPLOYEES ON THE CALL
• Alexandra Steiger, Global Head of Investor Relations. • Christian Klein, Chief Executive Officer. • Dominik Asam, Chief Financial Officer.
RESEARCH ANALYSTS ON THE CALL
• Adam Wood, Morgan Stanley. • Toby Ogg, JPMorgan. • Charles Brennan, Jefferies. • Jackson Ader, KeyBanc Capital Markets. • Mark Moerdler, Bernstein Research. • Michael Briest, UBS. • Johannes Schaller, Deutsche Bank. • Ben Castillo, BNP Paribas. • Frederic Boulan, Bank of America. • Kirk Materne, Evercore ISI. • Patrick Walravens, Citizens. • Balajee Tirupati, Citi. • Richard Wynn, Bernstein, as identified by the operator. The line was called without an audible response; participation and name spelling remain unconfirmed.
Key Read-Throughs
KEY READ-THROUGHS FROM SAP’S Q3 2026 EARNINGS CALL
SAP’s results indicate a redistribution of enterprise technology spending toward cloud infrastructure, governed data, and business-process automation, rather than an indiscriminate expansion in IT budgets. Current cloud backlog grew 26% at constant currencies, approximately 90% of the 50 largest deals included AI and business data, and management described increasingly comprehensive cloud contracts. Simultaneously, services revenue declined 5%, SAP identified opportunities to reduce external contractors, and cloud gross margin contracted despite strong revenue growth. The most actionable implications are positive for established data-distribution and cloud-hosting partners, negative for labor-intensive service delivery, and competitively challenging for application vendors seeking to sell separate data and AI platforms into SAP-centered enterprises. The strongest conclusions concern identifiable revenue channels and competitive pressure, not automatic changes to other companies’ earnings forecasts.
ENTERPRISE DATA AND ANALYTICS
SNOWFLAKE GAINS A DISTRIBUTION CHANNEL, NOT JUST ANOTHER DATA CONNECTOR (READ-THROUGH 1)
Affected company: Snowflake (SNOW: United States). Directional impact: Positive. Magnitude: Moderate fundamental opportunity, potentially meaningful within SAP-intensive enterprise accounts; no defensible near-term revenue uplift can be quantified from this call.
The supporting evidence is SAP’s statement that AI, data, and platform products significantly contributed to cloud growth, together with approximately 90% attachment of AI and business data across its 50 largest transactions. Management also described RISE contracts becoming richer as customers purchase a harmonized data layer alongside ERP migration. This matters because Snowflake is an established participant in that architecture, not simply an external platform competing for access to SAP data.
Snowflake’s published partnership terms establish 2 commercial routes. Existing customers can connect their Snowflake environments to SAP Business Data Cloud through bidirectional, zero-copy integration. New customers can purchase SAP Snowflake, a full Snowflake offering certified, sold, and supported by SAP, with Snowflake participating in co-selling. The latter creates a direct distribution mechanism: SAP’s account relationships and ERP transformation budgets can introduce or expand Snowflake deployments without requiring Snowflake to originate every opportunity independently.
The transmission mechanism is broader access to governed financial, procurement, inventory, and customer data, followed by incremental analytical and AI workloads. Business context that previously required expensive extraction and reconciliation becomes more accessible for production use. That can increase Snowflake compute consumption and improve the commercial viability of projects previously constrained by data preparation. Zero-copy access does not itself generate billable usage, but it lowers an important obstacle to workloads that do.
The non-consensus implication is that stronger SAP Business Data Cloud adoption is not necessarily negative for Snowflake. SAP’s ownership of business semantics can coexist with Snowflake’s monetization of analytics and execution. Management’s acknowledgment that expanding resale arrangements and Business Data Cloud structures affect cloud margins is consistent with an ecosystem in which some revenue growth carries payments to external technology partners. The call does not disclose how much of that effect relates to Snowflake, so a specific revenue transfer cannot be inferred.
The near-term catalyst is confirmation of partner-sourced wins, deployment activity, and consumption in Snowflake’s subsequent reporting. The fundamental opportunity develops over approximately 2-8 quarters as integrations move into production. The principal limitation is that zero-copy sharing reduces the need for duplicated storage and some data movement; the positive thesis rests on incremental workloads and distribution, not an assumption that every additional SAP data set creates equivalent storage revenue.
SAP’S MASTER-DATA EXPANSION INCREASES COMPETITION FOR SALESFORCE’S INFORMATICA PLATFORM (READ-THROUGH 2)
Affected company: Salesforce (CRM: United States). Directional impact: Negative competitive read-through for Informatica and the broader enterprise data-platform opportunity. Magnitude: Moderate strategic pressure in overlapping accounts, but low immediate impact on consolidated Salesforce earnings.
SAP stated that its acquisitions of Dremio and Reltio extend its capabilities “far beyond SAP data” and provide “a unified context layer across the entire data landscape.” Management additionally discussed automated generation of non-SAP data products and AI-assisted matching of customer, supplier, and material records. These capabilities move SAP beyond supplying application data into managing the broader enterprise data foundation.
The competitive exposure belongs to Salesforce because its acquisition of Informatica was completed in November 2025. Informatica’s capabilities include master data management, data integration, quality, governance, and metadata management. These functions overlap directly with the problems SAP intends to address through Reltio, Dremio, and Business Data Cloud. This is therefore more specific than a generic assertion that SAP and Salesforce compete in enterprise AI.
The transmission mechanism is budget consolidation during ERP transformation. A customer already purchasing SAP cloud migration and AI may obtain identity resolution, data harmonization, governance, and business context within the same commercial program. That increases the burden on a separate Informatica-led proposal to demonstrate incremental functionality or superior economics. Even where displacement does not occur, a more credible alternative can constrain pricing, reduce expansion scope, or lengthen competitive evaluations.
The pressure is strongest in SAP-centered operating environments where customer, supplier, material, and financial records are central to the proposed AI use case. It is less direct in Salesforce-centered customer-engagement environments or heterogeneous estates where Informatica’s existing coverage and integration relationships remain valuable. Salesforce also has substantial application context and distribution of its own; SAP’s progress does not establish universal architectural superiority.
The near-term catalyst is product evidence at SAP TechEd and delivery of the non-SAP data capabilities discussed for Q1. The fundamental effect is more likely to appear over 12-36 months through new-project selection, expansion decisions, and renewals. No customer displacement from Informatica was identified on the call. The high-conviction conclusion is increased competitive overlap and pricing pressure within a defined opportunity, not an immediate Salesforce revenue shortfall.
IT SERVICES AND DIGITAL TRANSFORMATION
AUTOMATION IS REDUCING THE REVENUE INTENSITY OF SAP IMPLEMENTATION AND MANAGED SERVICES (READ-THROUGH 3)
Affected companies: Accenture (ACN: Ireland), Capgemini (CAP: France), Infosys (INFY: India), and Tata Consultancy Services (TCS: India). Directional impact: Negative for labor-based delivery revenue and conventional application-management economics. Magnitude: High structural importance for exposed service lines; moderate and contract-dependent impact at the consolidated company level.
The clearest evidence is SAP’s 5% services revenue decline and management’s warning of further “downward pressure on billable hours and services revenue also next year.” SAP also described AI-driven migration tools, approximately 70% more internal code contributions, and automation across deployment, monitoring, incident management, and application operations. Management specifically identified an opportunity to “cut some of our third party contractors we deploy in our cloud delivery.”
The transmission mechanism is fewer paid human interventions per implementation or operating workload. Automated data migration, code conversion, testing, incident resolution, and application administration reduce the labor required to deliver a given customer outcome. Providers paid by time and materials can experience revenue compression even when customer project activity remains healthy. In managed services, automation can lower delivery costs initially, but customers can reclaim part of the benefit through productivity commitments and contract repricing.
This creates a crucial distinction between revenue and margin. A fixed-price provider that automates faster than its contractual pricing resets can initially improve margins. A time-and-materials provider may surrender revenue more quickly. Over time, competitive bidding tends to transfer some productivity gains to customers. Consequently, the call is more clearly negative for the historical relationship between project activity and billable headcount than it is for every provider’s immediate operating margin.
The non-consensus risk is that strong SAP cloud bookings and weak services revenue can coexist without inconsistency. Enterprise modernization can accelerate while the services revenue earned per migration declines. A bullish interpretation based solely on the size of the SAP installed-base transition would therefore overstate the benefit to labor-intensive delivery models.
The near-term catalyst is commentary on productivity commitments, contract repricing, utilization, and application-management demand in upcoming services earnings. SAP’s stated intention to adjust third-party arrangements over the next 12 months makes this more than a distant technology scenario. However, the call did not identify the contractors affected. Accenture, Capgemini, Infosys, and TCS should be treated as exposed ecosystem participants, not as confirmed recipients of SAP contract reductions.
The longer-duration effect is a change in competitive advantage over approximately 1-3 years. Reusable intellectual property, industry-specific implementation assets, and outcome-based pricing become more important than the ability to supply large teams. Geographic exposure follows the global delivery model: this is relevant to Indian providers serving European and North American clients, not merely to European consulting firms.
DATA REMEDIATION AND PROCESS REDESIGN REMAIN REAL SERVICES BOTTLENECKS (READ-THROUGH 4)
Affected companies: Accenture (ACN: Ireland), Capgemini (CAP: France), and Infosys (INFY: India). Directional impact: Positive for complex transformation, data engineering, and industry-specific deployment work. Magnitude: Moderate demand support, with greater relevance to project mix and bookings than to an immediate broad-based earnings upgrade.
The supporting evidence is the combination of 26% current cloud backlog growth, a strong Q4 pipeline, broader RISE contract scope, and management’s acknowledgment that customer data problems still constrain deployment. Klein stated that “not everything works out of the box” and emphasized that customers “need still a clean core.” The call also identified completed migrations at major enterprises, demonstrating that the opportunity extends beyond software demonstrations and pilot announcements.
The transmission mechanism is the work required to make enterprise AI operational. Customers must reconcile master data, redesign approval processes, map authorization rules, remove unnecessary customization, integrate non-SAP systems, and manage organizational adoption. These activities depend on business-specific judgment and accountability. Faster code generation does not eliminate disagreement over which customer record is authoritative, which employee may approve a transaction, or how a redesigned process should operate.
Accenture has a particularly direct channel through its established forward-deployed engineering program with SAP. The program covers discovery, process redesign, data integration, AI implementation, and production activation. That positioning matches the bottlenecks described in the call more closely than a generic claim that all consulting benefits from AI spending. Capgemini and Infosys also have established SAP transformation capabilities, although the call did not allocate any particular customer project to them.
The positive conclusion is deliberately narrower than a general IT-services recovery. More complex, higher-value work can offset some erosion in routine delivery hours, but it does not guarantee that total services revenue per customer will rise. Providers must capture the architecture and adoption budget rather than merely retain the coding and support work that automation is reducing.
The near-term catalysts are Q4 SAP bookings and subsequent implementation awards. Because approximately 50% of SAP’s annual bookings occur in Q4, the largest potential replenishment of transformation activity remains ahead. Software bookings are not equivalent to service-provider bookings, however, and implementation revenue can lag contract signing by several quarters.
Over approximately 6-24 months, the strongest relative positioning belongs to firms demonstrating paid production deployments, reusable industry solutions, and improved delivery economics. The cross-portfolio implication is that labor commoditization and transformation demand are simultaneous exposures. A services portfolio should not assume that the positive migration cycle automatically neutralizes the negative pricing and productivity cycle.
ENTERPRISE APPLICATIONS AND HUMAN CAPITAL MANAGEMENT
SAP’S SUITE-LEVEL AI OFFERING INCREASES THE COMPETITIVE BURDEN ON WORKDAY (READ-THROUGH 5)
Affected company: Workday (WDAY: United States). Directional impact: Negative incremental competitive pressure, particularly in SAP-centered enterprises. Magnitude: Moderate strategic significance; low immediate earnings impact without evidence of changed win rates or renewals.
SAP management cited IDC estimates indicating that SAP was growing more than 1.7x faster than the overall HCM market. The call identified SuccessFactors activity, a SmartRecruiters deployment, and the intended acquisition of TechWolf to extend workforce and skills intelligence. These disclosures support a more specific competitive conclusion than the general observation that SAP is adding AI features.
The transmission mechanism is the integration of workforce information with finance, procurement, operational planning, and enterprise permissions. An organization evaluating HR software may increasingly assess whether workforce decisions can be executed within a broader governed process. SAP’s proposition is that the customer can obtain this context across its suite without assembling every connection independently. That can strengthen SAP’s position in HCM expansion and replacement decisions, particularly where SAP already controls the financial and operational backbone.
The potential effect on Workday is higher sales friction, increased investment required to demonstrate cross-system value, and pressure on the economics of competitive deals. It is not necessarily the loss of an existing subscription. Large HCM deployments are difficult to replace, and the more immediate competition may concern adjacent modules, recruiting, skills intelligence, or new AI budgets rather than the core system.
Workday is not a passive competitor. Its October product announcements included agents across hiring, payroll, accounting, and deployment, with orchestration and controls linked to customer policies and permissions. Those capabilities directly address the same requirements SAP emphasized. The high-conviction implication is therefore a more demanding competitive market and a higher cost of differentiation, not a conclusion that Workday lacks a viable response.
The near-term trading catalyst is the comparison between SAP’s HCM commentary and Workday’s subsequent subscription outlook, competitive commentary, and evidence of paid AI adoption. The longer-duration effect unfolds over 12-36 months through enterprise selection cycles. SAP’s reported HCM outgrowth is a warning against assuming that AI demand lifts all HCM vendors equally; market expansion and market-share redistribution must be evaluated separately.
CLOUD INFRASTRUCTURE AND AI PLATFORMS
ERP MIGRATION SUPPORTS HYPERSCALER WORKLOADS, WITHOUT PROVING A PROPORTIONATE GPU SPENDING CYCLE (READ-THROUGH 6)
Affected companies: Amazon (AMZN: United States), Microsoft (MSFT: United States), and Alphabet (GOOGL: United States). Directional impact: Positive for cloud infrastructure and related data services. Magnitude: Moderate within SAP-related workloads, but modest at the diversified parent-company level.
The supporting evidence is SAP’s 25% constant-currency cloud revenue growth, 26% current cloud backlog growth, named customer go-lives, and management’s statement that AI was a principal driver of cloud migration. These are more relevant to infrastructure demand than the number of AI agents announced: they indicate movement of production business systems and associated data into cloud environments.
The supplier relationships are established. AWS hosts RISE with SAP workloads, Azure supports SAP cloud deployments and Business Data Cloud, and Google Cloud provides SAP hosting and data-platform integrations. The transmission mechanism is recurring consumption of compute, memory, storage, networking, backup, and resilience services as customer environments are deployed and operated. Additional analytics and AI use can create further consumption around the core ERP workload.
The important non-consensus distinction is between SAP’s software revenue and the infrastructure revenue earned underneath it. Higher application pricing or broader software bundles do not create a proportionate increase in hyperscaler consumption. Conversely, actual customer go-lives can be more economically relevant to infrastructure providers than a software contract signed well before deployment. The call supports the direction of infrastructure demand, not an equivalent 25% growth forecast for any supplier’s SAP business.
Model choice reinforces the value of broad cloud platforms while limiting conclusions about any particular model vendor. SAP offers access to more than 70 models, is increasing its use of open-weight models, and stated that it is “not committing to a preferred model.” Customers may consume infrastructure and model-management services even as the identity of the underlying model changes. The more durable exposure is to hosting and orchestration across models, rather than an assumption that SAP adoption creates exclusive demand for a particular proprietary model.
The geographic signal is also constructive but specific. Stronger cloud growth in EMEA and APJ was attributed partly to lower existing cloud penetration, while North America was described as advanced in AI adoption. This points to a broader geographic migration opportunity, including regional hosting and compliance capabilities. Slower Americas growth should not automatically be interpreted as weaker US AI demand.
The near-term catalyst is corroboration in hyperscaler commentary on enterprise migrations and production consumption over the next 1-2 reporting periods. The fundamental benefit develops over approximately 1-3 years as contracted environments go live and expand. Competition for hosting share, customer optimization, and SAP’s own delivery efficiencies limit the amount of revenue each provider ultimately captures.
The semiconductor implication is intentionally narrower. The call does not disclose GPU orders, accelerator utilization, model-training capacity, or a supplier allocation. ERP hosting, model inference, and frontier-model training have different infrastructure requirements. SAP’s results therefore support enterprise cloud demand more directly than a new earnings revision for AI semiconductor suppliers. Across portfolios, exposure to Snowflake, hyperscalers, and SAP implementation providers should also be recognized as partially linked to the same customer deployment cycle, rather than treated as independent AI growth opportunities.
Report record
- Sector
- Information Technology
- Fiscal period end
- September 30, 2026
- Report date
- October 21, 2026
- Analysis
- 6106 words
- Read-throughs
- 2678 words
- Content fingerprint (PDF)
40d25e5c11db- Content fingerprint (analysis)
6b1c5865b896- Content fingerprint (read-throughs)
68b06c1ee060
Prepared from the company's earnings release and earnings call transcript. Figures as reported by the company. For information only. Not investment advice.
More from SAP SE
No other reports yet.
More in Information Technology
Operating Thesis Strengthened; Cash Conversion Remains Unproven
Optical and IP Growth Validated; Cash Conversion Moved the Other Way
All Information Technology reports
Follow @AtlasPeakRes on X for new earnings reports as they publish.