AI Participation Is Proven; a Consolidated Growth Inflection Is Not
Earnings Reports
Teledyne Technologies Incorporated FQ3 2026 Earnings Report
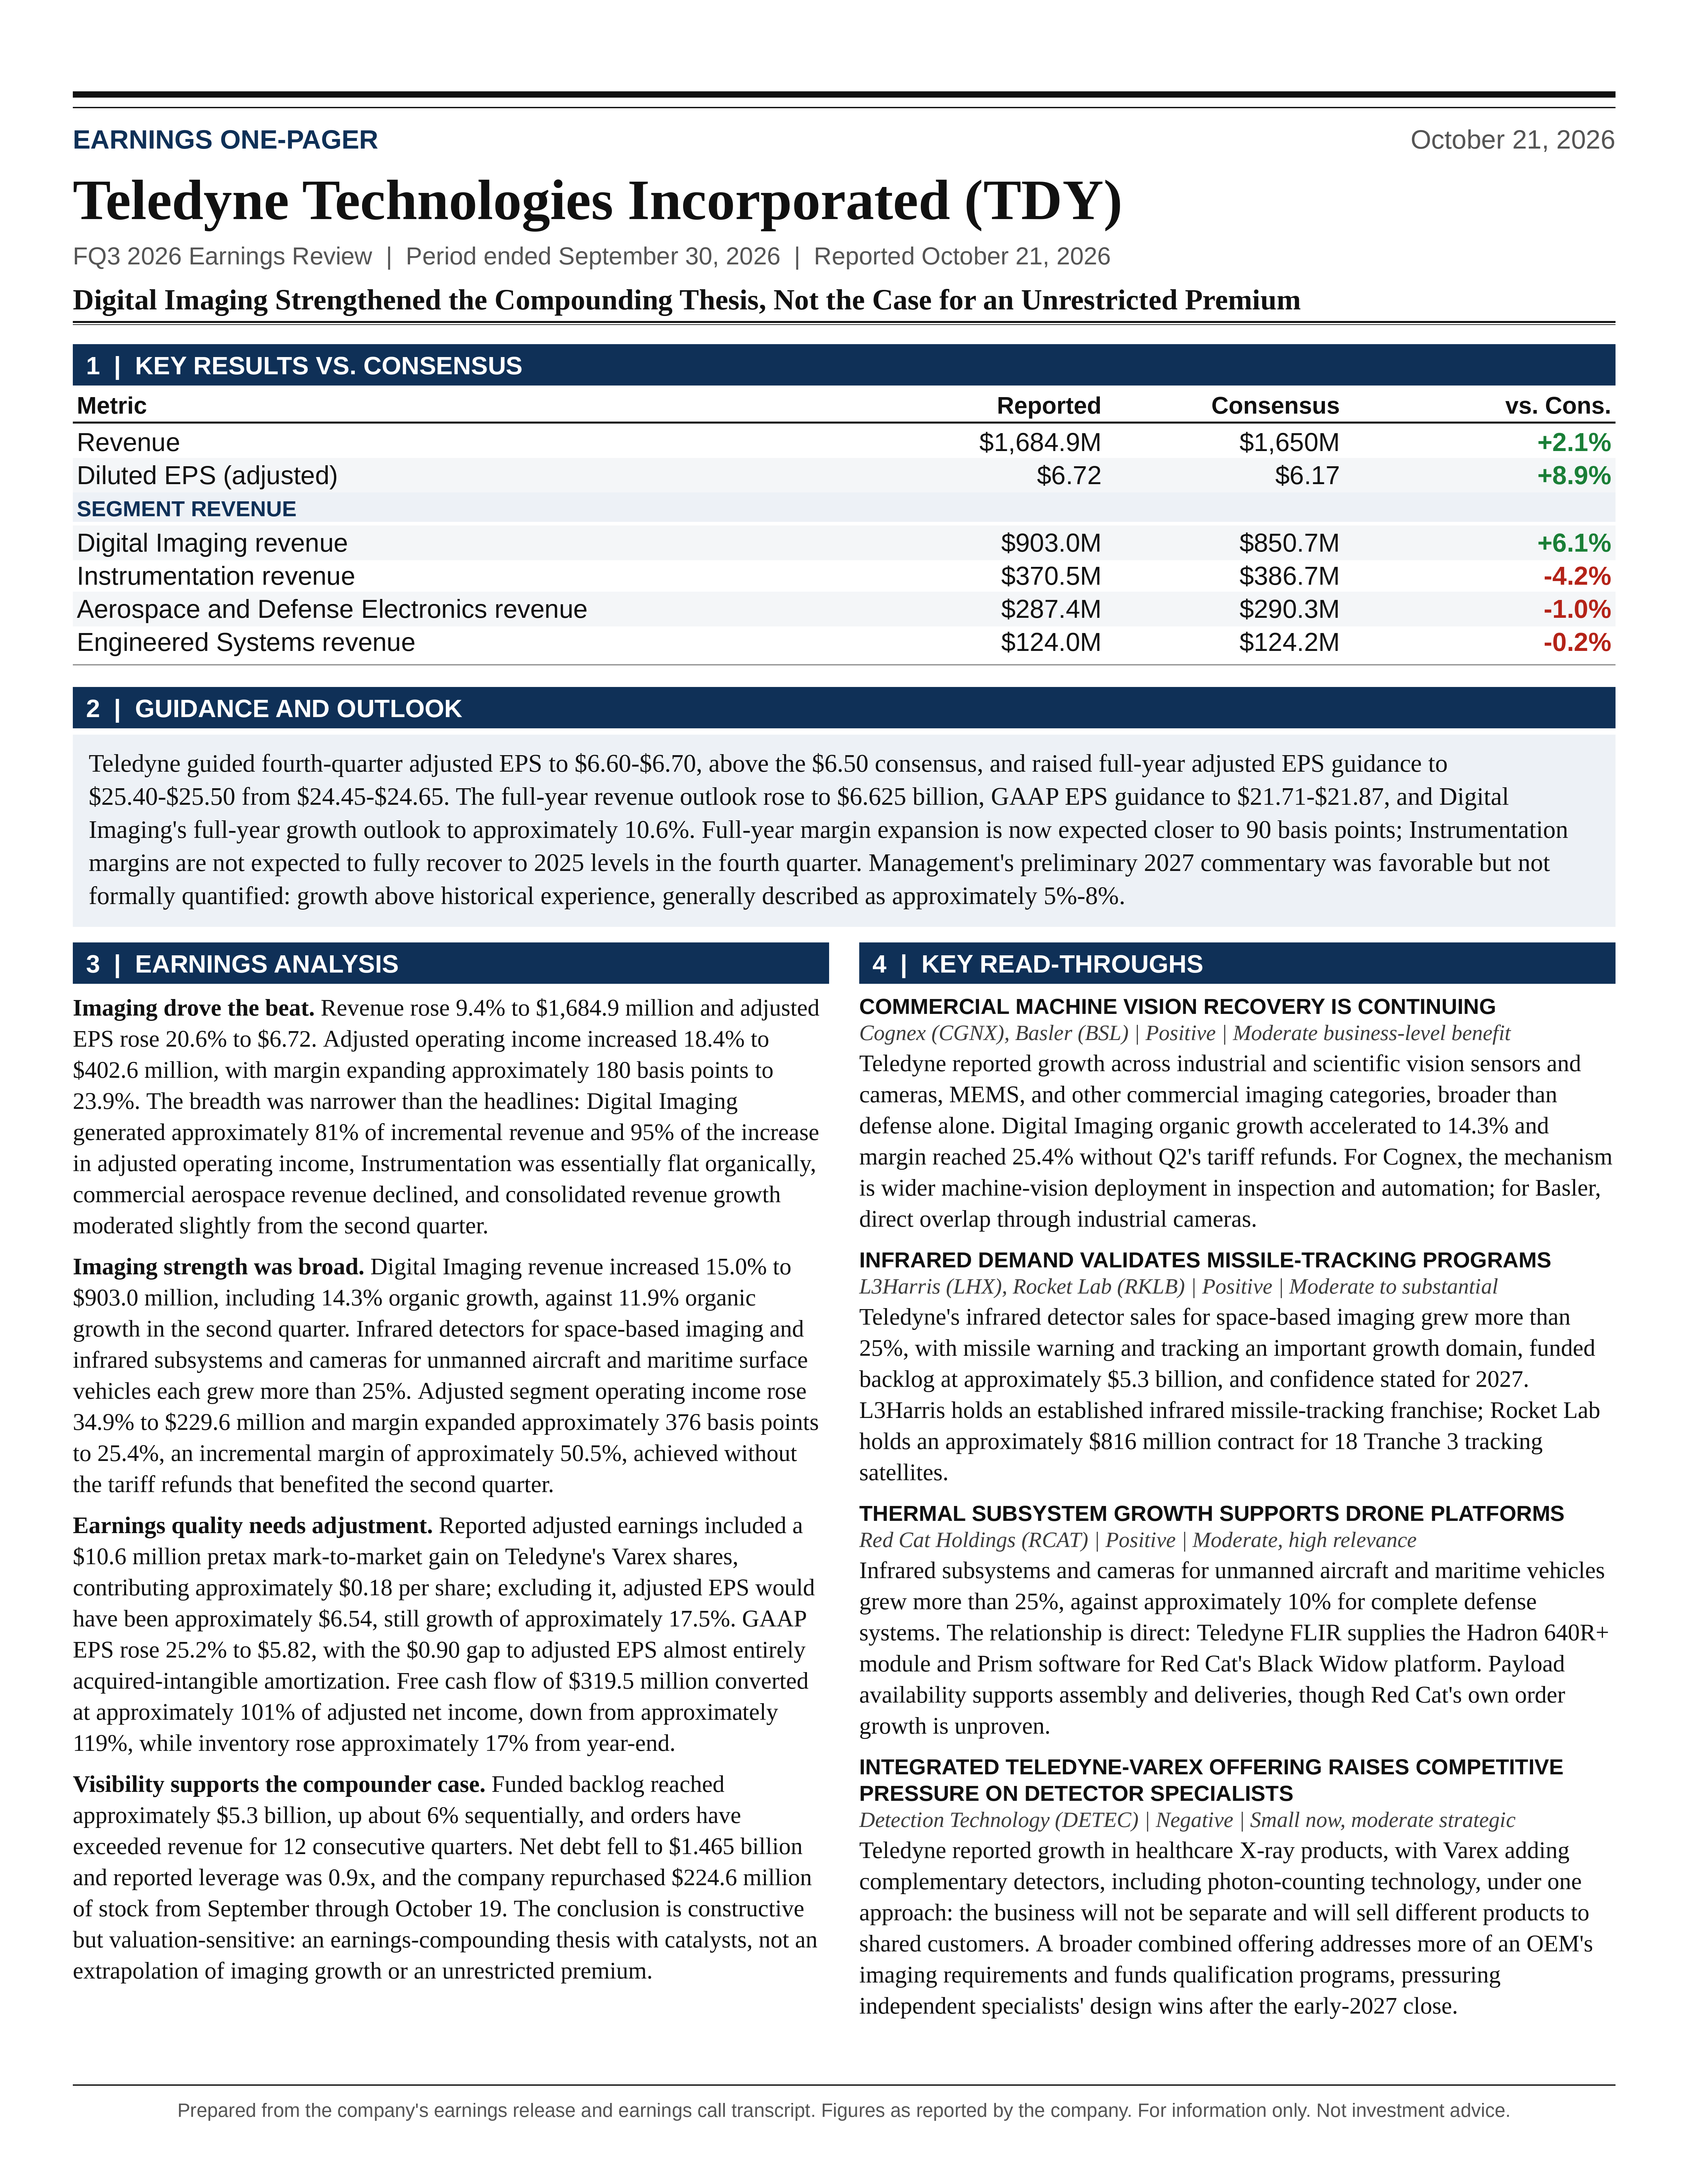
Teledyne Technologies Incorporated (TDY) FQ3 2026 earnings: Digital Imaging Strengthened the Compounding Thesis, Not the Case for an Unrestricted Premium. Full earnings analysis, key read-throughs, and the one-page exhibit from Atlas Peak Research.
Teledyne Technologies Incorporated (TDY)
Sector: Information Technology · FQ3 2026 · Period end September 30, 2026 · Reported October 21, 2026
Teledyne’s Q3 2026 earnings call supports a constructive investment view, with valuation-disciplined accumulation preferable to an unconditional momentum purchase.
Download the one-page report (PDF)
View one-page exhibit
Download analysis (.md)
Download read-throughs (.md)
Post to X
One-Page Exhibit
Earnings Analysis
EXECUTIVE CALL SUMMARY: Teledyne Technologies Incorporated (10/21/26)
Teledyne’s Q3 2026 earnings call supports a constructive investment view, with valuation-disciplined accumulation preferable to an unconditional momentum purchase. The quarter demonstrated accelerating Digital Imaging demand, substantial operating leverage, continued backlog accumulation, and increased confidence in 2027. The strongest investment evidence is the combination of 14.3% organic growth in Digital Imaging, a 25.4% segment operating margin, and a 1.22x segment book-to-bill ratio. Revenue growth, profitability, and incoming orders improved simultaneously, reducing the likelihood that the earnings advance merely reflected liquidation of previously accumulated backlog.
The October 21 earnings release reported revenue of $1,684.9 million, up 9.4%, and adjusted EPS of $6.72, up 20.6%. Adjusted operating income increased 18.4% to $402.6 million, with operating margin expanding approximately 180 basis points to 23.9%. Full-year adjusted EPS guidance increased to $25.40-$25.50 from $24.45-$24.65, a $0.90 increase at the midpoint. Management also raised its annual revenue outlook to $6.625 billion and described a favorable, although not formally quantified, outlook for 2027.
The principal qualification is that the economic contribution was less diversified than the breadth of management’s commentary might suggest. Digital Imaging generated approximately 81% of consolidated incremental revenue and 95% of the increase in consolidated adjusted operating income. Instrumentation was essentially flat organically, commercial aerospace revenue declined, and consolidated revenue growth moderated slightly from Q2. The portfolio is diversified, but the current earnings revision cycle is disproportionately dependent on imaging sensors, infrared subsystems, and associated defense and commercial applications.
Reported adjusted earnings also benefited from a $10.6 million pretax mark-to-market gain on Teledyne’s existing Varex shares. This gain remained within adjusted earnings and contributed approximately $0.18 per share using the quarterly effective tax rate. Excluding that item alone, adjusted EPS would have been approximately $6.54, still representing strong growth of approximately 17.5%. The distinction matters because Q4 guidance of $6.60-$6.70 is approximately flat to slightly lower than reported Q3 earnings, but modestly higher than this more representative Q3 earnings base.
The most important forward-looking conclusion is that Teledyne appears capable of sustaining above-historical organic growth into 2027 without requiring continued Digital Imaging growth at Q3’s 14.3% rate. Backlog, recovering commercial demand, and retained cost reductions support that conclusion. However, the call did not establish a durable double-digit corporate growth trajectory, provide formal 2027 EPS guidance, or quantify Varex accretion. The investment case is therefore strongest as an earnings-compounding thesis with identifiable execution catalysts, rather than as an unrestricted extrapolation of the current defense demand environment.
QUARTERLY PERFORMANCE AND EARNINGS QUALITY
Revenue increased $145.4 million from Q3 2025. Recent acquisitions contributed $11.7 million, implying acquisition-adjusted growth of approximately 8.7%, broadly consistent with strong underlying demand rather than acquisition-driven expansion. The same calculation produces approximately 9.0% growth in Q2. Consolidated reported revenue growth also moderated from 9.8% in Q2 to 9.4% in Q3. Consequently, the statement that organic growth accelerated applies specifically to Digital Imaging, not to the entire company.
Sequential revenue growth was 1.3%, while adjusted EPS increased 7.0% from $6.28. Some of that sequential earnings improvement reflects the Varex investment gain and differences in unusual items between periods. Nevertheless, the operating results independently establish meaningful improvement: consolidated adjusted operating margin increased from 23.4% in Q2 to 23.9% in Q3, and Digital Imaging improved despite the absence of the tariff refunds that benefited Q2.
Adjusted operating income increased $62.6 million on $145.4 million of incremental revenue, implying a consolidated incremental operating margin of approximately 43.1%. That is strong evidence of operating leverage, favorable mix, and benefits from earlier restructuring. It is not an appropriate steady-state incremental margin assumption. The quarter combined rapid growth in attractive imaging applications, unusually strong segment mix, and reduced quarterly R&D expense. A more normalized growth environment would likely produce lower incremental profitability.
The income statement provides a useful response to the analyst’s concern about operating expenses. Consolidated gross margin, calculated from revenue less cost of sales before separately reported acquired-intangible amortization, increased approximately 105 basis points to 43.9%. SG&A increased 8.5%, slightly below revenue growth. R&D declined 5.8% to $78.6 million, reducing R&D intensity to approximately 4.7% of sales from 5.4%. Accordingly, the quarter did not feature broad-based operating expense inflation overwhelming revenue growth.
The R&D comparison requires perspective. Year-to-date R&D increased 5.5%, so the quarterly decline does not establish a sustained reduction in innovation spending. It nevertheless contributed to the Q3 earnings outcome and makes extrapolation of the quarterly margin improvement less straightforward. Continued investment in infrared detectors, autonomous systems, software, and advanced X-ray technologies remains necessary to sustain product differentiation.
GAAP EPS increased 25.2% to $5.82, compared with adjusted EPS growth of 20.6%. The $0.90 difference between GAAP and adjusted EPS was almost entirely attributable to acquired-intangible amortization. Excluding this noncash charge is useful for assessing operating cash generation, but acquisition spending remains an economic cost. For a company whose strategy relies heavily on purchased technologies and customer relationships, adjusted EPS should be evaluated alongside cash returns on acquisition capital, not treated as a complete measure of value creation.
The Varex investment gain is the most important additional earnings-quality adjustment. Teledyne had acquired approximately 1.3 million Varex shares for $13.9 million before signing the acquisition agreement. The Q3 remeasurement generated a $10.6 million pretax gain included in other income and not removed from the company’s adjusted results. At the 21.3% quarterly effective tax rate and approximately 46.9 million diluted shares, the contribution was approximately $0.18 per share. This is equivalent to approximately 29% of the $0.62 EPS beat against the prior guidance midpoint, although management did not provide a bridge establishing how much of the gain was absent from that forecast.
Other below-the-line developments were mixed. Net interest expense declined to $10.5 million from $12.6 million, reflecting lower borrowings. Conversely, the effective tax rate increased to 21.3% from 19.3%, and discrete tax benefits declined to $1.6 million from $4.9 million. The quarter therefore did not depend on an unusually favorable tax rate. Lower average diluted shares provided a modest additional contribution to EPS growth, but operating profit growth remained the dominant driver.
DIGITAL IMAGING: THE CENTRAL DRIVER OF THE EARNINGS REVISION
Digital Imaging revenue increased 15.0% to $903.0 million, including 14.3% organic growth. This compares with 12.7% reported and 11.9% organic growth in Q2. The acceleration was meaningful because it occurred across both defense-related and commercial applications, rather than through an isolated program shipment.
Sales of infrared detectors for space-based imaging increased more than 25%, as did infrared subsystems and cameras supplied into customers’ unmanned aircraft and unmanned maritime surface vehicles. Management also reported growth across industrial and scientific vision, healthcare X-ray products, commercial thermography, maritime navigation electronics, geospatial sensors and software, and MEMS. The investment significance is that defense strength is being reinforced by a commercial recovery rather than offsetting broad commercial contraction.
The competitive positioning is attractive because Teledyne participates at multiple levels of the imaging architecture. It supplies sensors and subsystems to external platform manufacturers while also selling integrated systems. This creates opportunities to participate in spending growth without needing to identify the ultimate platform winner. The strategy potentially broadens the addressable revenue pool across competing aircraft, maritime, space, and ground systems.
That positioning is not riskless. Component suppliers remain exposed to platform selection, qualification requirements, program delays, and customer concentration. Participation in both subsystems and complete platforms also requires careful management of relationships with customers that may compete with Teledyne elsewhere. The call did not quantify design-win concentration, market share, or the profitability of externally supplied subsystems relative to internally integrated platforms.
Management indicated that subsystems were growing substantially faster than complete defense systems, for which growth was approximately 10%. This is consistent with a broadening opportunity around infrared content rather than dependence solely on Teledyne-branded vehicles. It also suggests that revenue mix could remain favorable if high-value detectors and modules continue growing faster than larger integrated systems. However, the call did not provide sufficient product-level margin disclosure to quantify that effect directly.
The discussion of migration from 12-micron to 8-micron detectors indicates continued product development, but the figures should not be interpreted as optical wavelength specifications or as proof of a proportional improvement in system performance. Smaller detector pitch can support reduced package dimensions or increased resolution within a given format, while imposing trade-offs involving sensitivity, optics, manufacturing yield, and signal processing. The investment relevance lies in maintaining competitive product performance and customer qualification positions, not in assigning an unsupported premium to the dimensional change alone.
Adjusted segment operating income increased 34.9% to $229.6 million. The margin increased approximately 376 basis points to 25.4%, producing an incremental margin of approximately 50.5%. Digital Imaging represented 53.6% of company revenue but contributed approximately 95% of the increase in consolidated adjusted operating profit after corporate expenses. That concentration makes Digital Imaging the principal determinant of whether the earnings upgrade cycle continues.
The quality of the margin performance was stronger than the sequential comparison initially suggests. Q2 Digital Imaging margin was approximately 25%, but management disclosed that tariff benefits contributed approximately 120 basis points. On the current call, Mehrabian stated, “the refunds were really taken up in Q2, so it does not affect Q3.” Achieving 25.4% without that benefit supports the argument that underlying profitability improved materially. A precise sequential normalization is complicated by the other accruals and expense movements discussed in Q2, but the directional conclusion is favorable.
The cost framework remains disciplined. Mehrabian summarized the intended operating model as, “When necessary, cut costs. When things improve, don’t put it back.” The sustainable interpretation is preservation of structural efficiencies while funding capacity and product development where returns justify investment. A literal assumption that costs can remain fixed indefinitely would be inappropriate given strong demand, component inflation, and the need to support new products.
Management raised the full-year Digital Imaging growth outlook to approximately 10.6%, including 10% organic growth. The July call had indicated approximately 7.5% segment growth. FLIR’s expected growth increased from more than 9% in July to approximately 12%. These are substantive upward revisions, although the current 14.3% quarterly organic growth rate remains above the annual forecast and above management’s preliminary longer-term framing.
OTHER SEGMENTS: POSITIVE ORDERS, BUT UNEVEN CURRENT GROWTH
Instrumentation revenue increased 1.9% to $370.5 million, while adjusted operating income increased only 0.5% to $102.6 million. Adjusted margin declined approximately 39 basis points to 27.7%. The segment remains highly profitable, but its immediate earnings contribution was considerably weaker than Digital Imaging’s.
The acquisition contribution materially changes the interpretation of Instrumentation’s growth. The earnings release disclosed $6.2 million of acquired revenue against a total segment revenue increase of $6.9 million. Excluding that contribution, growth was approximately 0.2%. Environmental instrumentation increased 7.1%, but approximately $6.2 million of its $8.3 million revenue increase came from the acquisition. Its implied organic increase was closer to 1.8%. Accordingly, the environmental growth figure should not be interpreted as evidence of a broad 7% underlying acceleration.
Marine instrumentation increased approximately 2%, supported by submarine interconnects and offshore energy activity. Electronic test and measurement revenue declined 6.3%, but orders increased 18%, producing a record 1.23x book-to-bill ratio. This divergence supports the explanation that shipment timing contributed to the revenue decline. It does not, by itself, establish the magnitude or timing of a subsequent revenue rebound.
Instrumentation’s overall book-to-bill ratio of 1.07x provides some reassurance that demand is improving faster than recognized sales. Nevertheless, management did not promise an immediate return to prior-year profitability. George Bobb stated, “I don’t think we quite get back to 2025 margins in Q4.” Sequential improvement is therefore the appropriate near-term expectation, with year-over-year margin recovery remaining a 2027 execution question.
Aerospace and Defense Electronics revenue increased 4.3% to $287.4 million. Defense electronics increased 7.4%, while commercial aerospace declined. Adjusted operating income increased 7.5% to $83.1 million, and margin improved approximately 86 basis points to 28.9%. This improvement is notable because the sales mix shifted toward defense electronics, which management described as lower margin than commercial avionics. Operational improvements and better profitability at acquired businesses appear to have more than offset that unfavorable mix.
The segment’s 1.29x book-to-bill ratio was strong, with favorable bookings in both defense and aerospace. That creates a potential source of future growth outside Digital Imaging. However, reported revenue growth moderated from 8.2% in Q2 to 4.3%, and the call did not quantify how quickly commercial aerospace orders would convert into shipments.
Engineered Systems revenue increased 7.8% to $124.0 million, driven primarily by marine and other manufacturing programs. Operating income increased 6.6% to $13.0 million, leaving margin broadly stable at approximately 10.5%. The segment provides useful end-market diversification, but its smaller size and lower margin limit its ability to offset a material slowdown in Digital Imaging.
ORDERS, BACKLOG, AND THE QUALITY OF 2027 VISIBILITY
Funded backlog reached approximately $5.3 billion, up about 6% from approximately $5.0 billion at Q2. Orders have exceeded revenue for 12 consecutive quarters. Sustained order intake above shipments through both weaker commercial conditions and the current recovery is stronger evidence than a single elevated booking quarter.
Management stated that approximately 72% of backlog would be available for revenue recognition over the following 12 months. This equates to approximately $3.82 billion, or 57.6% of the $6.625 billion 2026 revenue outlook. The resulting visibility is substantial, although it is not equivalent to having 57.6% of calendar 2027 revenue secured. The conversion window begins around the current reporting period and extends through approximately Q3 2027.
The distinction between funded backlog and prospective program opportunity is particularly important in defense. Funded backlog generally provides firmer support than an unfunded contract ceiling or a potential program selection. Nevertheless, delivery schedules, customer acceptance, production constraints, cancellations, and government administrative delays can still affect realization. Backlog also provides limited information about future margins without disclosure of contract mix and pricing provisions.
The current-quarter Digital Imaging book-to-bill ratio of 1.22x was below Q2’s approximately 1.40x, but remained strongly above 1.0x while revenue increased. A lower ratio following exceptionally strong bookings does not necessarily indicate weakening demand. It can also reflect increased conversion of prior orders into revenue. The more relevant evidence is continued backlog growth alongside higher shipments.
Management rejected the suggestion that order strength reflected unusual customer behavior or excessive advance purchasing. Mehrabian stated, “We haven’t noticed anything unusual across our portfolio.” This is reassuring but remains management’s assessment rather than independent proof that all ordering is normalized. Backlog aging, shipment rescheduling, cancellations, and subsequent customer inventory behavior remain important confirmation indicators.
The budget discussion was deliberately bounded. Regarding 2027, Mehrabian stated, “we think we are okay in 2027,” citing longer-duration programs, including recent Golden Dome-related work. He separately acknowledged uncertainty for 2028 and 2029. The appropriate conclusion is that existing awards improve near-term resilience, not that Teledyne is insulated from future appropriations, program reprioritization, or geopolitical changes. No contract value or revenue schedule was disclosed for the referenced Golden Dome work.
GUIDANCE REVISIONS AND THE Q4 EARNINGS BRIDGE
The full-year revenue outlook increased to $6.625 billion, compared with more than $6.53 billion discussed in July and $6.37 billion in January. Relative to the rounded July figure, the latest outlook is approximately $95 million higher. Relative to January, it is $255 million, or 4.0%, higher. Management’s observation that the expected growth rate has nearly doubled is accurate, but the absolute revenue forecast increase is 4.0%, not a doubling of revenue expectations.
Adjusted EPS guidance progressed from $23.45-$23.85 in January, to $23.85-$24.15 after Q1, to $24.45-$24.65 after Q2, and now to $25.40-$25.50. The current midpoint is 7.6% above January and 3.7% above July. The narrowing of the range to $0.10 reflects increased visibility late in the fiscal year, but should not be confused with unusually low economic risk beyond 2026.
GAAP EPS guidance increased to $21.71-$21.87 from $20.73-$20.99. The midpoint increase of $0.93 was slightly larger than the $0.90 adjusted EPS increase. The comparable improvement in both measures reinforces that the upgrade was not primarily created by changes in the definition or magnitude of excluded acquisition expenses.
Q3 adjusted EPS of $6.72 exceeded the prior $6.05-$6.15 guidance range by $0.57 at the upper end and $0.62 at the midpoint. Approximately 69% of the full-year midpoint increase can therefore be associated arithmetically with the Q3 beat. The remaining increase implies a more favorable Q4 expectation, although weighted-average share counts and rounding prevent a perfectly additive bridge.
Using the prior annual midpoint, the previously expected Q3 midpoint, and the reported first-half earnings base produces an implied prior Q4 adjusted EPS expectation of approximately $6.39. The new Q4 midpoint is $6.65, representing an improvement of roughly $0.26, or 4%. The annual upgrade therefore incorporates improved expectations for the remaining quarter rather than simply passing through the completed quarter’s upside.
The Q4 guide is nevertheless more restrained than the headline demand commentary. Adjusted EPS of $6.60-$6.70 implies growth of approximately 4.8%-6.3% over Q4 2025’s $6.30, substantially below Q3’s 20.6% growth. The midpoint is 1.0% below reported Q3 EPS, but approximately 1.6% above Q3 EPS after removing the estimated Varex investment gain. The apparent sequential earnings stagnation is therefore partly a comparison issue rather than evidence of operating deterioration.
Tax commentary warrants particular care. Management suggested that additional tax benefits might become available, but did not quantify their amount, timing, or treatment in adjusted EPS. Q4 2025 included $20.8 million of FLIR-related tax benefits that were excluded from adjusted earnings. Those specific benefits cannot explain the adjusted EPS comparison in the same way they explain the GAAP comparison. Unspecified future tax benefits should remain outside a recurring earnings forecast until their nature is established.
The consolidated margin outlook also improved. July commentary indicated approximately 56 basis points of annual expansion. The current call indicated closer to 90 basis points. Digital Imaging’s expected annual margin improvement increased to approximately 225 basis points. The longer-term corporate target remains approximately 50 basis points annually, meaning the current year should be viewed as unusually favorable rather than as the new recurring pace of margin expansion.
Several numerical inconsistencies require explicit treatment. First, the $6.625 billion annual revenue forecast, less reported 9-month revenue of $4.9075 billion, implies Q4 revenue of $1.7175 billion. Against Q4 2025 revenue of $1.6123 billion, that represents approximately 6.5% reported growth. This does not directly reconcile with management’s Q4 organic growth commentary of 7%-8%. A currency or other scope bridge could explain the difference, but none was provided. The figures should not be forced into a single internally precise forecast.
Second, the closing reference to approximately $2.5 billion of annual Digital Imaging revenue is inconsistent with reported 9-month segment revenue of $2.5886 billion. That figure is therefore unsuitable as an annual modeling input and appears to reflect a verbal or transcription error. The explicitly clarified 10% organic and 10.6% reported growth expectations are more usable.
Third, the Q&A reference to approximately 180 basis points of margin improvement should not replace the 376-basis-point Digital Imaging improvement stated in the prepared remarks and supported by the release. Approximately 180 basis points corresponds to consolidated adjusted margin expansion. Maintaining the correct segment and consolidated scope is essential to avoid materially understating the imaging recovery.
2027: ABOVE-HISTORICAL GROWTH, NOT FORMAL DOUBLE-DIGIT GUIDANCE
Management’s preliminary 2027 commentary was favorable but intentionally noncommittal. Mehrabian indicated growth above historical experience, generally described as approximately 5%-8% or toward the upper portion of that range. The discussion did not establish a formal consolidated or segment revenue forecast, and it did not support assuming that Q3 Digital Imaging organic growth persists unchanged.
The most credible 2027 framework combines continued defense-related sensor demand, conversion of existing backlog, and a more normalized commercial recovery. Operating leverage can continue if previously removed costs remain structurally absent. However, comparisons will become more demanding as the strong 2026 quarters enter the base period. Growth moderation would not necessarily invalidate the thesis if margins and order conversion remain healthy.
The unmanned outlook also requires reconciliation with prior disclosures. The current call described approximately 15% growth for 2026. In July, management had discussed approximately $575 million of revenue against approximately $500 million in 2025, while describing that increase as approximately 12%. The dollar figures already imply 15% growth. Consequently, the current commentary confirms the arithmetic of the earlier dollar outlook but does not establish a new dollar increase beyond $575 million.
Space, unmanned systems, electronic warfare, missiles, and underwater applications were collectively described as growing approximately 11.3%-11.5%. These categories should not be added mechanically to construct a larger addressable market because product and application exposures can overlap. The call supports broad participation in attractive defense priorities, but does not provide a sufficiently granular exposure map to quantify independent revenue streams.
CASH FLOW, INVENTORY, AND CAPITAL ALLOCATION
Operating cash flow increased 2.7% to $352.5 million, while free cash flow increased 1.8% to $319.5 million. Both were strong in absolute terms, and free cash flow exceeded adjusted net income. However, cash generation grew substantially more slowly than earnings.
Free cash flow conversion declined to approximately 101% of adjusted net income from approximately 119% in Q3 2025. Free cash flow margin declined to approximately 19.0% from 20.4%. These comparisons do not indicate poor cash generation, but they temper the impression created by the record absolute figure.
Inventory is the principal disclosed pressure point. Inventory increased approximately 17.0% from year-end to $1.2203 billion, compared with 9.0% year-to-date revenue growth. Management attributed part of the cash flow offset to higher inventory purchases. This is consistent with supply-chain protection and preparation for backlog execution, but the balance sheet does not independently distinguish productive inventory investment from potential excess or slow-moving stock.
The quarterly cash flow statement showed a $44.4 million unfavorable year-over-year swing in changes in operating assets, liabilities, and other operating activity. That aggregate is broader than inventory alone. Sustained improvement in inventory conversion would provide important confirmation that the company is translating order growth into cash rather than permanently increasing the working-capital intensity of the business.
Capital expenditure increased 13.0% to $33.0 million, approximately 2.0% of revenue. Depreciation and amortization of $84.7 million should not be compared directly with capital expenditure as evidence of underinvestment because it includes substantial acquired-intangible amortization. The July call also indicated higher annual capital investment and customer or government support for selected capacity additions. The current call did not provide a detailed capacity-utilization or bottleneck analysis.
Quarter-end net debt was $1.465 billion, down $657.6 million from year-end, and reported consolidated leverage was 0.9x. Cash was $562.4 million, with approximately $1.158 billion available under the revolving credit facility. This supports meaningful acquisition capacity, although cash availability, target debt treatment, fees, and post-quarter capital deployment must be incorporated into any transaction financing model.
The timing of share repurchases is important. The $224.6 million announced amount covered September through October 19, while only $94.8 million was reflected in Q3 cash flow. Approximately $129.8 million therefore occurred after quarter-end. The 0.9x leverage figure does not incorporate all announced repurchases.
At the reported average purchase price of $607.03, the repurchases represented approximately 370,000 shares, or about 0.8% of the quarterly diluted share base. The mechanical annualized EPS benefit is approximately 0.8% before foregone interest income or financing costs. This is supportive but not large enough to explain the principal earnings acceleration.
The repurchase price equates to approximately 23.9x the new full-year adjusted EPS midpoint. It provides evidence of management’s capital-allocation judgment, not an independently established valuation floor. Historical repurchase success and management’s belief that the shares were undervalued do not eliminate the need to assess prospective returns from the actual entry price.
VAREX: STRATEGIC COMPLEMENTARITY WITH MATERIAL NORMALIZATION WORK
The Varex acquisition remains scheduled to close in early 2027, with the shareholder meeting scheduled for October 28. The August 10 transaction announcement specified $18.90 per share in cash and an aggregate transaction value of approximately $1.1 billion, including equity awards and net debt. That aggregate figure should not be confused with the equity purchase price or the precise amount of new Teledyne borrowing.
The strategic rationale is credible. Varex adds X-ray tubes, flat-panel detectors, high-voltage interconnects, imaging software, and photon-counting technologies. These extend Teledyne’s existing positions in CMOS-based imaging and radiotherapy-related electronics. The transaction increases content opportunities across related OEM customers without relying solely on overlapping product consolidation.
Management’s discussion of detectors for oncology should be interpreted as a comparison of the companies’ existing product portfolios, not as a universal assertion that all CMOS-based detector systems are unsuitable for high-radiation applications. Product architecture, materials, shielding, operating conditions, and qualification requirements matter. Varex’s practical contribution is an established suite of products and customer qualifications in applications where Teledyne currently has less participation.
Photon-counting detectors provide a potentially valuable longer-duration technology option. Direct-conversion architectures can support energy discrimination and advanced imaging capabilities, but commercialization depends on detector-material quality, manufacturing yield, performance at high photon flux, system integration, and OEM qualification. The call did not quantify current photon-counting revenue, design wins, market share, or the timing of material earnings contribution. Technology optionality should therefore be separated from near-term acquisition economics.
The most important new information was management’s willingness to accept initial revenue contraction. Mehrabian stated, “that might actually reduce our revenue a little bit at the beginning,” referring to the application of Teledyne’s 80/20 portfolio discipline. This indicates that the initial integration objective is improved profitability and operating complexity, not maximization of reported sales.
Revenue pruning can create value if discontinued products and customers consume disproportionate engineering, service, inventory, or selling resources. However, smaller products can also support broader OEM relationships or future platform positions. Execution requires identifying genuinely unattractive business rather than eliminating low-volume offerings whose strategic importance exceeds their immediate profitability.
Varex’s latest disclosed quarter provides a caution against using headline margins without adjustment. Its August 10 fiscal Q3 release reported approximately $211 million of revenue, 4% growth, and approximately 12% adjusted operating margin. The quarter also included $17 million of tariff refunds and approximately $7 million of expected customer reimbursements recorded as a revenue reduction, producing a net gross profit benefit of approximately $10 million.
That benefit was material relative to Varex’s operating profit. The roughly 12% adjusted operating margin should not be annualized as a clean recurring acquisition baseline. The appropriate transaction model needs to normalize both the reimbursement-related revenue reduction and the tariff-related cost benefit, rather than subtracting an expense item while leaving the corresponding revenue adjustment untouched.
Varex’s quarterly revenue annualizes mechanically to approximately $844 million, equivalent to nearly 13% of Teledyne’s current annual revenue outlook. This is a scale illustration, not a 2027 forecast, because closing timing, seasonality, customer reimbursements, and deliberate revenue pruning will affect the actual contribution. Even at the reported 12% operating margin, Varex would enter below Teledyne’s current consolidated and Digital Imaging margins. Initial consolidated margin dilution can therefore coexist with EPS accretion and attractive long-term returns.
The economics remain sensitive to financing and integration. At an $844 million revenue scale, each 100 basis points of operating margin improvement represents approximately $8.4 million of operating profit, or roughly $0.14 per Teledyne share after applying a 21.3% tax rate and the current share base. By comparison, $1.0 billion of incremental funding at an illustrative 5% annual cost would create approximately $50 million of pretax financing or cash-opportunity cost. This is a sensitivity, not a financing forecast, but it demonstrates why quantified synergies and normalized target earnings are necessary before assigning a precise EPS contribution.
The proposed unified sales approach creates potential cross-selling benefits. It may also reduce duplication and improve visibility across the combined product portfolio. However, revenue synergies generally require customer qualification and purchasing-cycle conversion and should not be assumed to arrive as quickly as public-company cost savings or administrative consolidation.
Management cited FLIR’s acquisition multiple declining from 16.7x EBITDA at purchase to 13.7x based on current EBITDA. Holding acquisition value constant, that implies approximately 22% cumulative EBITDA growth, or about 5% annually over 4 years. This supports a record of earnings improvement, but it is not equivalent to a realized investment return. A proper acquisition assessment must also consider cash generated, integration costs, financing, incremental investment, and the persistence of the acquired earnings.
SUPPLY CHAIN, PRICING, AND UNDERAPPRECIATED RISKS
Management acknowledged component shortages and above-normal inflation in selected categories, while indicating that price increases had offset pressure reasonably well. The favorable interpretation is that differentiated products and supplier management are supporting price realization. The limitation is that the call did not separate pricing from volume, so reported organic growth cannot be treated entirely as unit growth.
The absence of a large direct AI infrastructure demand contribution does not eliminate AI-related supply-chain exposure. Teledyne can face competition for printed circuit boards, electronic components, manufacturing capacity, and specialized materials even when its own sales are not driven by hyperscaler spending. The company’s earnings sensitivity therefore includes indirect exposure to the capital spending cycle through input availability and cost.
The July call had identified more than $1 billion of annual revenue dependent on materials such as germanium and rare-earth magnets. The current call did not quantify whether those exposures had declined. Strong backlog does not remove the risk that a constrained input delays revenue conversion, increases inventory requirements, or forces unfavorable procurement terms.
The principal concentration risk is economic rather than organizational. A broad portfolio does not guarantee diversified incremental profit. Digital Imaging now accounts for more than half of revenue and almost all of the quarterly increase in adjusted operating income. A slowdown in infrared subsystems, unfavorable defense program mix, or renewed weakness in commercial imaging could therefore have a larger earnings effect than the number of end markets might suggest.
INVESTMENT IMPLICATIONS, SCENARIOS, AND VALUATION DISCIPLINE
The quarter strengthens the case for Teledyne as a high-quality sensor and instrumentation compounder with an improving growth profile. The evidence supports higher earnings estimates, but not an unlimited valuation premium. An attractive investment outcome requires recurring operating performance to replace the unusual gains embedded in 2026 earnings and requires Varex to improve returns without materially weakening cash conversion or customer relationships.
A rough normalization of the $25.45 annual adjusted EPS midpoint for the Q3 Varex investment gain and Q2’s approximately $10 million net tariff-related benefit produces an earnings base near $25.10, using the current quarterly tax rate and share count. This is not a complete normalization of every discrete item, but it is a more conservative starting point for assessing recurring growth.
An illustrative base case, assigned a 55% probability, assumes 2027 organic revenue growth of approximately 6%-7%, around 50 basis points of margin expansion in the existing portfolio, and no major tax windfall. That supports approximately $27.50-$28.50 of adjusted EPS before a separately quantified Varex contribution. At $28.00 and an assumed 25x multiple, the valuation is approximately $700 per share. This case requires continued backlog conversion and cost discipline, but not sustained 14% Digital Imaging growth.
An illustrative bull case, assigned a 25% probability, assumes approximately 9%-10% organic growth, stronger commercial imaging recovery, continued sensor demand, and approximately 75-100 basis points of existing-portfolio margin improvement. Adjusted EPS could approach $29.50-$30.50 before a separately modeled Varex contribution. Applying an assumed 28x multiple to $30.00 produces approximately $840 per share. The premium would require evidence that the growth improvement is durable rather than predominantly cyclical.
An illustrative bear case, assigned a 20% probability, assumes organic growth of approximately 0%-3%, weaker backlog conversion, and flat to moderately lower margins as price-cost pressure and mix offset earlier efficiencies. Adjusted EPS of approximately $24.00-$25.50 would become plausible. Applying an assumed 20x multiple to $24.75 produces approximately $495 per share. This outcome does not require a severe recession; normalization of unusually favorable imaging growth and operating leverage could be sufficient.
These are analytical scenarios, not management guidance, consensus forecasts, or verified peer-derived valuation multiples. They intentionally avoid assigning an unsupported Varex accretion estimate. The probability-weighted valuation is approximately $694. Relative to the disclosed $607.03 repurchase price, the base, bull, and bear outcomes imply approximately 15%, 38%, and negative 18% returns, respectively, with a probability-weighted return of approximately 14%. The repurchase price is a historical reference, not a current executable quotation.
The preferred action is selective accumulation around or below approximately $625, where the scenario framework offers a more acceptable prospective return over 12-18 months. Above approximately $700, the base case provides limited appreciation and the investment increasingly depends on the bull case or demonstrable acquisition value creation. A verified current market price is necessary before translating this framework into an unconditional buy or hold decision.
An illustrative initial position of 1.0% of portfolio NAV, rising toward 1.5% only after confirmation of 2027 guidance and Varex economics, is consistent with the remaining execution uncertainty. A 12% price-based review or stop threshold implies approximately 0.12%-0.18% of NAV at risk before gaps, slippage, or correlation effects. This is a risk-budget framework rather than a portfolio-specific allocation, because existing holdings and factor exposures are not specified.
Fundamental exit criteria should take precedence over reliance on backlog size or management’s repurchase activity. Thesis-breaking developments would include sustained orders below shipments accompanied by cancellations, a material reversal in Digital Imaging profitability, failure to convert elevated inventory into cash, or acquisition disclosures showing inadequate returns after financing and integration costs. A price decline without deterioration in these indicators would require a different assessment from an earnings decline caused by structural competitive loss.
Portfolio exposure would include defense modernization, industrial and healthcare capital spending, acquisition execution, and quality-growth valuation sensitivity. Teledyne should not be treated as a pure defense hedge or as unrelated to other premium-multiple industrial and technology holdings. The combination of commercial cyclicality and a valuation premium can produce meaningful correlation with broader growth-factor drawdowns.
CATALYSTS AND FINAL ASSESSMENT
The immediate catalysts are the October 28 Varex shareholder meeting, subsequent regulatory progress, Q4 results, and the initial formal 2027 outlook. The most informative operating confirmations will be Digital Imaging profitability without unusual gains, conversion of test-and-measurement bookings into revenue, stabilization of Instrumentation margins, and improvement in inventory conversion. Early-2027 acquisition disclosures should establish normalized Varex earnings, financing terms, integration costs, revenue-pruning expectations, and the timetable for synergies.
The quarter materially improves confidence in Teledyne’s near-term operating trajectory. The strongest evidence is the simultaneous improvement in Digital Imaging growth, underlying margins, and order coverage. The main qualifications are concentrated incremental profit, unusual gains retained within adjusted earnings, uneven performance outside imaging, and incomplete acquisition economics. The resulting investment conclusion is constructive but valuation-sensitive: the earnings-compounding thesis strengthened, while the case for extrapolating exceptional quarterly growth or paying an unrestricted premium did not.
COMPANY EMPLOYEES ON THE CALL
• Robert Mehrabian, Executive Chairman. • George Bobb, President and Chief Executive Officer. • Steve Blackwood, Executive Vice President and Chief Financial Officer. • Jason VanWees, Vice Chairman. • Melanie Cibik, Executive Vice President, General Counsel, Chief Compliance Officer, and Secretary. Introduced as attending; no speaking remarks appear in the transcript.
RESEARCH ANALYSTS WHO PARTICIPATED
• Zachary Walljasper, UBS. • Andrew Buscaglia, BNP Paribas. • Adam Samuelson, Jefferies, participating on behalf of Sheila Kahyaoglu. • Jonathan Siegmann, Stifel. • Guy Hardwick, Barclays. • Joe Giordano, TD Cowen. • Ron Epstein, Bank of America. • Noah Poponak, Goldman Sachs. • Robert Jamieson, Needham & Company. • Bradley Eyster, Citigroup, participating on behalf of John Godyn.
Key Read-Throughs
KEY READ-THROUGHS FROM TELEDYNE’S Q3 2026 EARNINGS CALL
Teledyne’s results support a selective recovery in industrial technology spending alongside sustained investment in defense sensing, unmanned systems, and submarine production. The most actionable incremental signals are stronger electronic test orders despite declining shipments, continued recovery in commercial machine vision, and evidence that AI-related component demand is creating procurement pressure outside the AI infrastructure sector. The negative implications are concentrated in input costs, working capital, and the competitive consequences of Teledyne’s planned expansion in X-ray imaging. The evidence does not establish an indiscriminate industrial recovery: Digital Imaging generated approximately 81% of incremental consolidated revenue, while Instrumentation was essentially flat organically. The directional assessments below distinguish verified commercial relationships from shared end-market exposure. Magnitude refers to business relevance and potential earnings sensitivity, not an assumed share-price reaction.
INDUSTRIAL AUTOMATION AND ELECTRONIC TEST
DESIGN-TEST ORDERS ARE STRONGER THAN CURRENT REVENUE SUGGESTS (READ-THROUGH 1)
Affected company: Keysight Technologies (KEYS: United States). Direction: positive. Magnitude: moderate for relevant electronic design and validation businesses; smaller and less certain for consolidated earnings.
Supporting evidence: Teledyne’s electronic test and measurement revenue declined 6.3%, but orders increased 18%, producing a record 1.23x book-to-bill ratio. Management attributed part of the revenue decline to order timing. This is a materially stronger demand signal than the reported sales figure alone would suggest.
The transmission mechanism is renewed spending on engineering, validation, and product-development equipment. Teledyne LeCroy and Keysight overlap in oscilloscopes and related electronic design-test applications. Higher customer orders can precede recognized revenue, particularly when equipment configurations, delivery schedules, and customer acceptance separate booking from shipment. For Keysight, confirmation of comparable demand would support backlog conversion and operating leverage against an engineering-intensive cost base.
The non-obvious implication is that weak current shipments need not indicate renewed demand deterioration. An assessment based only on Teledyne’s 6.3% revenue decline would miss the substantially stronger incoming order trajectory. Conversely, the 18% order increase should not be transferred mechanically to Keysight, whose product and customer mix differs.
The near-term catalyst is Keysight’s next disclosure of orders, backlog, and demand across overlapping design-test applications, followed by shipment conversion over the next 1-3 quarters. The longer-duration implication would be an expansion in electronics development activity beyond narrowly concentrated AI infrastructure projects. The call does not establish which applications generated the test-equipment orders, so attribution entirely to AI would be unsupported. It also does not justify equivalent earnings upgrades for semiconductor production-test companies, where wafer volumes, device complexity, and test intensity create different demand drivers.
COMMERCIAL MACHINE VISION RECOVERY IS CONTINUING BEYOND AN INITIAL REBOUND (READ-THROUGH 2)
Affected companies: Cognex (CGNX: United States) and Basler (BSL: Germany). Direction: positive. Magnitude: moderate business-level benefit, with potentially greater proportional earnings sensitivity where earlier restructuring has reduced fixed costs.
Supporting evidence: Teledyne reported growth in industrial and scientific vision sensors and cameras, MEMS, and other major commercial imaging categories. Management explicitly described the improvement as broader than defense. Digital Imaging organic growth accelerated to 14.3%, while segment margin reached 25.4% without the tariff refunds that benefited Q2. Mehrabian’s cost framework was explicit: “When necessary, cut costs. When things improve, don’t put it back.”
The transmission mechanism for Cognex is increased deployment of machine vision in inspection, identification, and manufacturing automation. For Basler, the overlap is particularly direct through industrial cameras and associated vision components. Rising equipment orders and normalization of customer purchasing support revenue, while manufacturing utilization and operating expense discipline can amplify the profit contribution.
The useful incremental information is continuity into Q3, not discovery of an entirely new recovery. Cognex had already reported 17% Q2 revenue growth and substantial profitability improvement. Teledyne’s subsequent results provide independent evidence that improving vision demand was not confined to a single vendor or reporting period. This reduces the probability that the earlier improvement represented only a brief replenishment cycle, although it does not eliminate that risk.
The near-term catalysts are subsequent Cognex and Basler order disclosures, industrial customer commentary, and evidence that revenue growth is converting into cash rather than accumulating in receivables or inventory. The longer-duration opportunity is a higher earnings base if automation investment remains healthy and restructuring savings persist.
The geographic interpretation must remain disciplined. Basler’s German domicile does not make this evidence of a German manufacturing recovery. Teledyne did not provide sufficient geographic detail to distinguish European, Chinese, or North American demand contributions. Similarly, Teledyne’s 376-basis-point Digital Imaging margin improvement should not be assigned directly to commercial vision peers because defense and space product mix contributed materially.
ELECTRONIC COMPONENTS AND SUPPLY CHAINS
COMPONENT SCARCITY FAVORS QUALIFIED PCB CAPACITY BUT CREATES COST AND CASH-FLOW HEADWINDS DOWNSTREAM (READ-THROUGH 3)
Affected companies: TTM Technologies (TTMI: United States), positive with moderate business-level significance; Rockwell Automation (ROK: United States) and Keysight Technologies (KEYS: United States), negative input-cost and working-capital implications of small-to-moderate magnitude before mitigation.
Supporting evidence: When asked about printed circuit boards and electronic components being absorbed by hyperscaler and AI investment, Mehrabian acknowledged shortages and said inflation in the affected categories was “higher than normal.” Teledyne had offset pressure with pricing, but also reported increased inventory purchases. Inventory was approximately 17% above year-end, compared with 9% year-to-date revenue growth.
The positive transmission mechanism for TTM is stronger demand for qualified, technically demanding PCB capacity serving both data infrastructure and aerospace and defense. TTM’s own Q2 disclosure showed these end markets representing approximately 40% and 37% of revenue, respectively, alongside a 1.49x book-to-bill ratio. Teledyne’s commentary corroborates demand pressure from the customer side of the electronics supply chain. Higher utilization, stronger demand for delivery reliability, and favorable product mix can improve the economics of scarce qualified capacity.
This is matched end-market exposure, not evidence that TTM is the specific supplier responsible for Teledyne’s procurement issues. Nor are AI and defense PCB production lines perfectly interchangeable. Qualification requirements, materials, manufacturing processes, and capacity location constrain how quickly a producer can redirect supply.
The negative transmission mechanism for Rockwell and Keysight is competition for electronic inputs used in control and test equipment. Higher component prices, expedited procurement, and larger safety inventories can reduce margins or cash conversion even when end demand remains healthy. The less obvious risk is that successful price increases can preserve operating profit while failing to prevent a deterioration in working capital. Protecting deliveries by buying earlier consumes cash before the associated equipment revenue is recognized.
The near-term catalysts are procurement lead times, inventory disclosures, pricing realization, and gross-margin guidance over the next 2-4 quarters. The longer-duration implication is a potential shift in value toward dependable, qualified component capacity. However, Teledyne itself demonstrated successful price mitigation, so this evidence supports scrutiny of downstream price-cost performance, not an automatic earnings downgrade. For Keysight, the procurement headwind offsets part of the positive order read-through rather than reversing it.
DEFENSE AND SPACE
INFRARED PAYLOAD DEMAND VALIDATES FUNDED MISSILE-TRACKING PROGRAMS MORE THAN SPECULATIVE DEFENSE OPTIONALITY (READ-THROUGH 4)
Affected companies: L3Harris Technologies (LHX: United States) and Rocket Lab Corporation (RKLB: United States). Direction: positive. Magnitude: moderate for L3Harris’s relevant space businesses and potentially substantial for Rocket Lab’s space-systems business, but only moderate incremental information from this call.
Supporting evidence: Teledyne’s infrared detector sales for space-based imaging increased more than 25%. Management identified missile warning and tracking as an important growth domain. Funded backlog reached approximately $5.3 billion, and Mehrabian stated that existing longer-duration programs meant, “we do not see an issue for us in 2027,” despite budget uncertainty.
The transmission mechanism is execution of awarded satellite and payload programs. L3Harris has an established infrared missile-tracking franchise and completed its Tranche 3 preliminary design review in September. Rocket Lab holds an approximately $816 million contract to build 18 Tranche 3 tracking satellites, including its own Phoenix infrared payloads. These are identifiable program exposures rather than generic associations with space or Golden Dome.
Teledyne’s detector growth provides evidence that spending is reaching specialized hardware suppliers. That supports confidence in the broader transition from program announcements to engineering and production activity. For the affected companies, successful execution can generate contract revenue, improve utilization of space-system capabilities, and strengthen positioning for subsequent awards.
No direct Teledyne supply relationship to either specific satellite configuration is established by this call. Rocket Lab’s internally developed payload also creates competitive overlap at certain architectural levels. The read-through is therefore shared program demand, not an assumption that Teledyne’s shipments directly determine either company’s revenue.
The near-term catalysts are manufacturing milestones, payload deliveries, funded backlog conversion, and the next earnings updates. The longer-duration shift is the proliferation of space-based missile sensing and the associated demand for specialized infrared technology. Budget protection should not be extrapolated indefinitely: Teledyne explicitly distinguished its confidence in 2027 from uncertainty in 2028 and 2029. Existing funded programs merit more confidence than valuation assigned to unidentified future awards.
THERMAL SUBSYSTEM GROWTH SUPPORTS FIELDABLE DRONE PLATFORMS, NOT EVERY UNMANNED EQUITY EQUALLY (READ-THROUGH 5)
Affected company: Red Cat Holdings (RCAT: United States). Direction: positive demand and supply-readiness signal. Magnitude: moderate incremental confirmation, with potentially high business relevance because of Red Cat’s concentrated platform exposure.
Supporting evidence: Teledyne reported more than 25% growth in infrared subsystems and cameras supplied to customers’ unmanned aircraft and unmanned maritime surface vehicles. Management described subsystems as its strongest defense activity and emphasized the importance of customers trusting that suppliers could meet demand. Complete defense systems were growing approximately 10%, materially slower than the strongest subsystem categories.
The commercial relationship is explicit: Teledyne FLIR supplies the Hadron 640R+ imaging module and Prism software for Red Cat’s Black Widow platform. Red Cat is therefore a more directly connected read-through than an unrelated listed drone manufacturer. Reliable availability of qualified thermal payloads supports platform assembly, delivery schedules, and the day-and-night mission capability required by military customers.
The mechanism is not simply higher drone unit demand. Thermal performance, embedded processing, and software can increase the value and importance of the payload relative to the airframe. Teledyne’s subsystem growth suggests that sensing content is a particularly strong area of expenditure. Red Cat benefits from access to that capability, but the same evidence indicates that economically valuable differentiation may reside partly with its suppliers rather than exclusively with the platform integrator.
The near-term catalysts are Red Cat’s production, funded-order, delivery, and acceptance disclosures. Teledyne’s aggregate subsystem growth is not proof that Red Cat’s specific orders or deliveries increased at the same rate. Sensor shipments can also precede completed aircraft deliveries, and purchasing objectives must not be confused with funded commitments.
The longer-duration positive is the growing operational importance of thermal sensing in small unmanned systems. The principal qualification is execution: a favorable supplier ecosystem does not remove platform manufacturing, software integration, customer acceptance, or cash-management risk. The call supports targeted confidence in a verified platform relationship, not an indiscriminate rerating of drone equities.
SUBMARINE COMPONENT DEMAND FAVORS QUALIFIED SUPPLIERS MORE CLEARLY THAN SHIPBUILDING MARGIN RECOVERY (READ-THROUGH 6)
Affected companies: BWX Technologies (BWXT: United States) and Curtiss-Wright (CW: United States). Direction: positive. Magnitude: moderate confirmation for exposed naval businesses; limited evidence of an immediate consolidated earnings surprise.
Supporting evidence: Teledyne identified strong defense-related sales of interconnects for Virginia- and Columbia-class submarines as a principal contributor to marine instrumentation growth. This is a specific program-level signal rather than a general statement about defense budgets.
The transmission mechanism is procurement across the submarine supply chain. BWXT supplies naval nuclear reactor components and fuel, while Curtiss-Wright supplies pumps, propulsion valves, instrumentation, and control systems. These businesses benefit from long qualification cycles, specialized manufacturing requirements, and positions in programs whose production commitments extend across multiple years.
The exposure is supported by actual awards. BWXT announced an approximately $189 million naval nuclear fuel contract in October, with completion scheduled for August 2027. Curtiss-Wright’s disclosed naval awards include engineering and manufacturing work extending through 2029. Teledyne’s interconnect sales provide an independent indication that at least part of the broader component procurement chain is converting into shipments.
The near-term catalysts are supplier backlog conversion, naval segment sales, and capacity execution. The longer-duration implication is continued demand for difficult-to-replicate qualified components across submarine production and fleet support.
The important cross-portfolio distinction is that component shipments can rise before final vessel completion. This supports suppliers more directly than it supports a conclusion that labor productivity, construction schedules, or contract margins have improved at General Dynamics (GD: United States) or Huntington Ingalls Industries (HII: United States). The call does not establish a recovery in shipyard profitability. Upstream component strength and downstream construction challenges can coexist.
The signal is also narrower than an offshore energy upcycle. Teledyne’s overall marine revenue increased only approximately 2%, with both defense and offshore energy contributing. The clearest actionable exposure is qualified submarine equipment, not a broad upgrade to offshore services or marine capital spending.
MEDICAL AND INDUSTRIAL X-RAY IMAGING
A MORE INTEGRATED TELEDYNE-VAREX OFFERING RAISES COMPETITIVE PRESSURE ON INDEPENDENT DETECTOR SPECIALISTS (READ-THROUGH 7)
Affected company: Detection Technology (DETEC: Finland). Direction: negative for the longer-duration competitive environment, partly offset by positive current X-ray demand. Magnitude: small near-term earnings impact; potentially moderate strategic significance over subsequent OEM qualification and procurement cycles.
Supporting evidence: Teledyne reported growth in healthcare X-ray products and described Varex as adding complementary detectors, including products suited to high-radiation applications and photon-counting technology. Management explicitly rejected a separate commercial structure: “It’s not going to be separate. It’s going to be One Teledyne approach.” The stated objective includes selling different products to shared customers and applying Teledyne’s portfolio and cost discipline.
Detection Technology competes in medical, industrial, and security X-ray detectors, including flat-panel and photon-counting technologies. The overlap is therefore identifiable. The competitive change is not simply the addition of detector revenue to a larger company. A combined Teledyne-Varex offering can address more of an OEM’s imaging requirements through related detector technologies, X-ray sources, electronics, software, and established commercial relationships.
The transmission mechanism is stronger competition for future design wins and customer spending. Broader account coverage can improve access to procurement decisions, support coordinated product development, and increase the value of an integrated supplier relationship. Teledyne’s financial capacity also gives Varex greater ability to fund development and support lengthy qualification programs. These factors can pressure the future growth opportunity available to independent specialists even without immediate price reductions.
The negative conclusion is strongest for competitive intensity, not for a forecast of imminent share loss. Existing detector qualifications are difficult to replace, and Detection Technology already offers integrated detector solutions of its own. The call provides no evidence that customers have switched suppliers, that Teledyne possesses superior photon-counting performance, or that a particular competitor will lose an established program.
The near-term demand implication is favorable: growth in Teledyne’s healthcare imaging products supports a recovering component market. The more important negative catalyst begins after the expected early-2027 acquisition close, when integration, coordinated selling, and investment priorities become visible. The fundamental effect would emerge over multiple product-selection cycles rather than immediately upon transaction completion.
Management’s willingness to prune low-profit Varex revenue also limits the case for an immediate price war. Mehrabian acknowledged that integration could initially reduce revenue. Smaller competitors may capture some discontinued business, but that revenue should not automatically be considered attractive if its engineering, inventory, or service requirements make it economically weak. The durable competitive issue is a better-capitalized, broader imaging supplier pursuing higher-quality business, not an assumption that every dollar of relinquished revenue becomes profitable growth for a rival.
Report record
- Sector
- Information Technology
- Fiscal period end
- September 30, 2026
- Report date
- October 21, 2026
- Analysis
- 5838 words
- Read-throughs
- 2546 words
- Content fingerprint (PDF)
4b1c40ecc07d- Content fingerprint (analysis)
1621eebaa499- Content fingerprint (read-throughs)
cefc6d21d78a
Prepared from the company's earnings release and earnings call transcript. Figures as reported by the company. For information only. Not investment advice.
More from Teledyne Technologies Incorporated
No other reports yet.
All Teledyne Technologies Incorporated reports
More in Information Technology
Operating Thesis Strengthened; Cash Conversion Remains Unproven
Optical and IP Growth Validated; Cash Conversion Moved the Other Way
All Information Technology reports
Follow @AtlasPeakRes on X for new earnings reports as they publish.