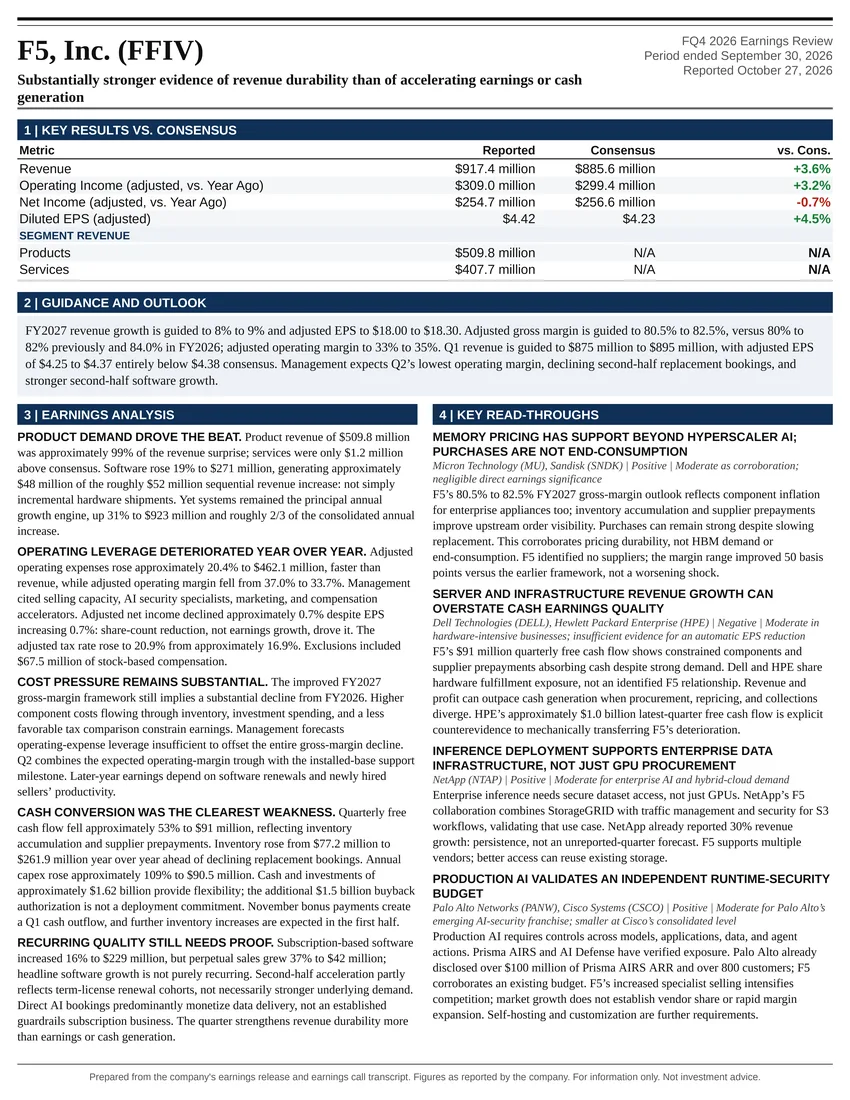
Substantially stronger evidence of revenue durability than of accelerating earnings or cash generation
Earnings Reports
Teradyne, Inc. FQ3 2026 Earnings Report
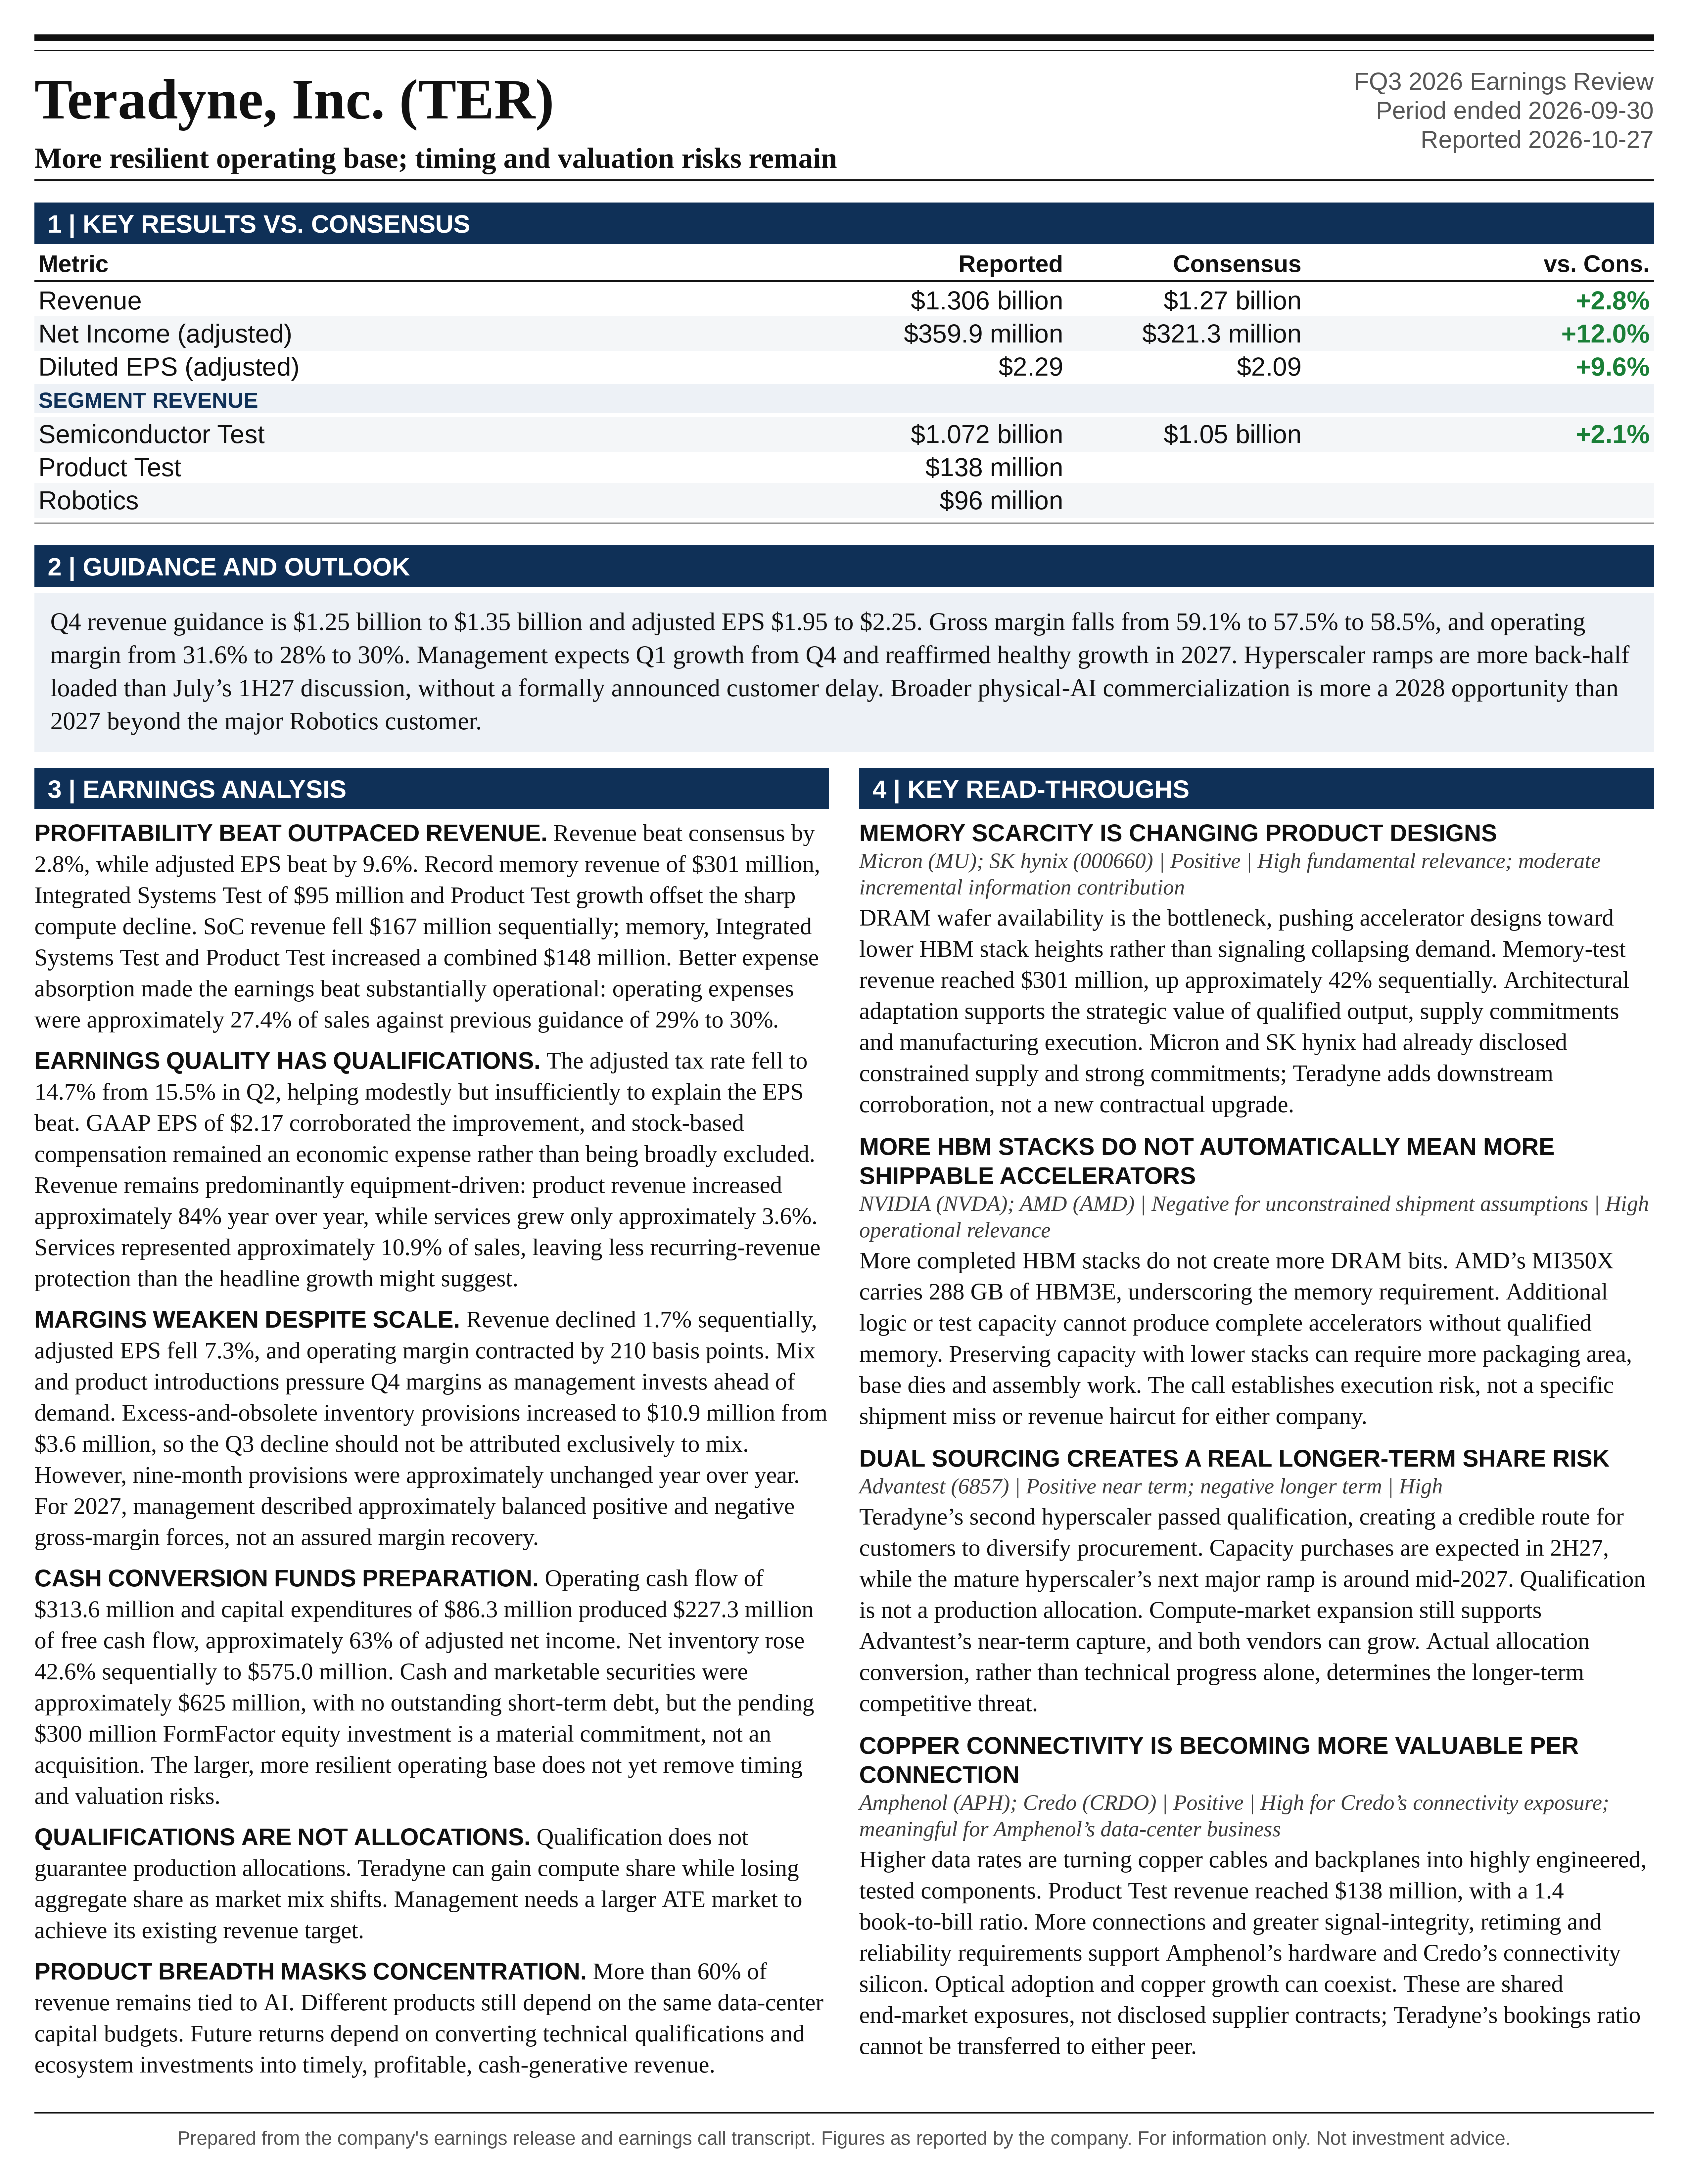
Teradyne, Inc. (TER) FQ3 2026 earnings: More resilient operating base; timing and valuation risks remain. Full earnings analysis, key read-throughs, and the one-page exhibit from Atlas Peak Research.
Teradyne, Inc. (TER)
Sector: Information Technology · FQ3 2026 · Period end September 30, 2026 · Reported October 27, 2026
Teradyne’s Q3 results support a constructive operating outlook but a more selective investment conclusion: hold rather than initiate an aggressive new position at the $306 reference price in the accompanying Bloomberg notice.
Download the one-page report (PDF)
View one-page exhibit
Download analysis (.md)
Download read-throughs (.md)
Post to X
One-Page Exhibit
Earnings Analysis
EXECUTIVE CALL SUMMARY: Teradyne Inc. (10/28/26)
Teradyne’s Q3 results support a constructive operating outlook but a more selective investment conclusion: hold rather than initiate an aggressive new position at the $306 reference price in the accompanying Bloomberg notice. The quarter demonstrated that memory, storage, interconnect, power-management test, and robotics can substantially offset a sharp decline in compute-related semiconductor test demand between customer deployment cycles. However, diversification across products should not be confused with diversification across underlying demand drivers. More than 60% of revenue remains tied to AI, profitability is declining sequentially despite approximately stable sales, and several important growth programs are increasingly concentrated in 2H27. The principal investment question is no longer whether AI can materially expand Teradyne’s business. It is whether the timing, market-share capture, and incremental profitability of that expansion justify the valuation.
Q3 revenue of $1.306 billion increased 69.8% year over year and exceeded Bloomberg consensus by 2.8%. Adjusted EPS of $2.29 increased 169.4% and exceeded consensus by 9.6%. Both measures surpassed management’s previous guidance ceilings, although revenue exceeded the ceiling by only $6 million, or 0.5%, while EPS exceeded it by $0.14, or 6.5%. The distinction matters: the quarter was a more significant profitability beat than a revenue beat. Non-GAAP operating margin reached 31.6%, compared with 20.4% a year earlier and management’s previous 28% to 30% guidance.
The sequential picture was less favorable. Revenue declined 1.7% from Q2, adjusted EPS declined 7.3%, and operating margin contracted by 210 basis points. Q4 guidance implies another approximately flat revenue quarter but an additional 8.3% decline in adjusted EPS at the midpoint. This establishes a clear tension between strong annual growth and weakening near-term earnings productivity. Management is investing ahead of anticipated demand, while product mix and new-product introductions are pressuring margins.
The most consequential forward statement was Michelle Turner’s explicit expectation of growth from Q4 into Q1: “I also expect between Q4 and Q1 that we’re also going to have growth.” Management also expects growth through 2027, supported by stronger backlog and visibility extending approximately 2 quarters. Nevertheless, the timing of major hyperscaler programs and the largest robotics customer suggests greater 2H27 concentration. Relative to July’s discussion of a renewed compute surge in 1H27, the latest commentary introduces a meaningful timing qualification, even though it does not establish a formally announced customer delay.
The strongest positive developments were record memory revenue of $301 million, record Integrated Systems Test revenue of $95 million, Product Test bookings exceeding revenue by 40%, and the progression of additional compute customers through dual-source qualification. The principal offsets were declining margins, substantial working-capital investment, uncertainty around the conversion of qualifications into production orders, and management’s acknowledgment that a larger ATE market is now required to achieve the revenue embedded in its existing target model.
EARNINGS PERFORMANCE AND QUALITY OF THE BEAT
The October 27 earnings release provides revenue of $1,305.95 million, compared with $1,328.99 million in Q2 and $769.21 million in Q3 2025. Against Bloomberg consensus of $1.27 billion, the revenue beat was approximately $36 million. Adjusted net income of $359.9 million exceeded the $321.3 million consensus by 12.0%, while adjusted EPS exceeded the $2.09 consensus by $0.20. The net-income and EPS surprise percentages differ because the supplied consensus aggregates do not imply the same share denominator. They should not be combined into a precise share-count contribution to the earnings surprise.
The comparison with management guidance is more informative. The July 28 release guided Q3 revenue to $1.20 billion to $1.30 billion and adjusted EPS to $1.85 to $2.15. Actual revenue exceeded the midpoint by 4.5%, while EPS exceeded the midpoint by 14.5%. Gross margin of 59.1% exceeded the 58% to 59% range. Operating expenses were approximately 27.4% of sales, materially below the previously indicated 29% to 30%, and operating margin exceeded the upper end of guidance by 160 basis points.
The improvement relative to guidance therefore reflected both revenue outperformance and better expense absorption. At the previous revenue midpoint of $1.25 billion and operating-margin midpoint of 29%, implied operating profit was approximately $362.5 million. Actual adjusted operating profit of $412.9 million was approximately $50.4 million higher. This is a mechanical comparison of guidance midpoints, not a disclosed management variance bridge, but it confirms that the earnings beat was substantially operational.
The adjusted tax rate also helped modestly. The Q3 presentation reports a 14.7% effective rate, compared with 15.5% in Q2. On an earnings base of roughly $400 million, that difference represents approximately $3 million to $4 million, or about $0.02 per share. The tax benefit is relevant but insufficient to explain the $0.20 consensus EPS beat.
Year-over-year operating leverage was substantial. Adjusted operating profit increased 163.2%, and the incremental operating margin on the $536.7 million revenue increase was approximately 47.7%. Engineering and development spending increased 30.7% to $163.1 million, materially slower than revenue growth. R&D declined from approximately 16.2% of revenue to 12.5%, despite significant absolute investment. This is evidence that the larger revenue base can support substantial innovation spending while producing materially better profitability than the prior-year business.
GAAP results corroborate the improvement. GAAP EPS was $2.17, compared with $0.75 a year earlier, and GAAP operating margin was 30.8%. The $0.12 difference between GAAP and adjusted EPS was not large enough to alter the overall earnings conclusion. Adjustments included equity-method investment amortization, acquired intangible amortization, ERP-related costs, and restructuring charges. Stock-based compensation remained an economic expense within the reported earnings framework rather than being broadly excluded from adjusted earnings.
The important qualification is that current revenue remains predominantly equipment-driven. Product revenue increased approximately 84% year over year to $1.164 billion, while service revenue increased only approximately 3.6% to $142 million. Services represented approximately 10.9% of sales, down from approximately 17.8% a year earlier. The earnings expansion therefore reflects a powerful equipment investment cycle, not a comparable increase in recurring revenue protection.
PORTFOLIO BREADTH: STRONGER PRODUCT COVERAGE, PERSISTENT AI CONCENTRATION
Semiconductor Test generated $1.072 billion, approximately 82.1% of consolidated revenue. Product Test contributed $138 million, or 10.6%, and Robotics contributed $96 million, or 7.4%. Semiconductor Test increased approximately 77% year over year, Product Test increased approximately 56%, and Robotics increased 28%.
Within Semiconductor Test, SoC revenue was $676 million, memory was $301 million, and Integrated Systems Test was $95 million. These are components of Semiconductor Test, not additional revenue streams to be added again to the consolidated total.
The sequential revenue bridge is particularly revealing. SoC declined $167 million, or 19.8%, from Q2. Memory increased $89 million, or 42.0%; Integrated Systems Test increased $28 million, or 41.8%; and Product Test increased $31 million, or 29.0%. Robotics declined $4 million, or 4.0%. Together, these movements explain approximately the $23 million consolidated revenue decline.
The portfolio therefore performed an economically valuable stabilizing function. Without the $148 million combined sequential increase in memory, Integrated Systems Test, and Product Test, the SoC decline would have produced a materially weaker quarter. However, this does not mean each business expanded sequentially. Robotics achieved a record Q3 and strong annual growth, but revenue was below Q2.
Management stated that businesses outside compute contributed close to 80% of sales, while AI-related revenue exceeded 60% of the total. These disclosures imply that a substantial portion of AI exposure lies outside the compute category. Even assigning all approximately 20% compute exposure to AI would leave roughly 40% of consolidated revenue, or approximately $0.5 billion, associated with AI elsewhere in the portfolio.
The high-confidence investment inference is that Teradyne is becoming less dependent on the timing of individual accelerator test programs. The equally important inference is that the business remains highly dependent on a shared AI infrastructure investment cycle. Memory, power devices, hard drives, interconnects, boards, and assembly robots are different products, but many ultimately depend on the same data-center capital budgets.
Q4 GUIDANCE: ABOVE CONSENSUS, BELOW Q3 EARNINGS PRODUCTIVITY
Q4 revenue guidance of $1.25 billion to $1.35 billion has a midpoint of $1.30 billion, 4.8% above the supplied Bloomberg consensus of $1.24 billion. Adjusted EPS guidance of $1.95 to $2.25 has a midpoint of $2.10, 5.0% above consensus of $2.00. The revenue floor is already above consensus, while the EPS range straddles consensus. This is a stronger revenue outlook than the headline sequential comparison might suggest, but it is not an earnings acceleration.
At the midpoint, revenue declines approximately 0.5% from Q3 and EPS declines 8.3%. Even the $2.25 upper end of EPS guidance remains below Q3’s $2.29. Gross margin is expected to decline from 59.1% to 57.5% to 58.5%, and operating margin from 31.6% to 28% to 30%.
The presentation pairs the lower revenue case with operating expenses of 29.5% of sales and the higher revenue case with 28.5%. Those pairings matter because operating expenses do not fall proportionately with revenue. At the midpoint, gross profit is approximately $754 million and operating expenses approximately $377 million, producing operating profit of approximately $377 million.
Relative to Q3, that midpoint implies approximately $17 million less gross profit and approximately $19 million more operating expense. Combined, these changes explain an approximately $36 million, or 8.7%, operating-profit decline. The Q4 tax rate of 15.3%, versus 14.7% in Q3, adds a modest further headwind.
Management expects compute to recover from its Q3 low, with Product Test and Robotics also growing sequentially. However, Turner clarified that Q3 should remain the record memory quarter within 2026, implying some sequential memory digestion in Q4. This is not inconsistent with continued strong annual memory growth, but it prevents extrapolating the $301 million result as a steadily rising quarterly baseline.
The consolidated outlook thus reflects rotation among growth engines rather than simultaneous acceleration across all of them. A recovery in compute does not automatically translate into stronger consolidated earnings if memory normalizes, product-launch costs increase, and spending remains elevated.
COMPARISON WITH PRIOR ANNUAL AND FORWARD GUIDANCE
The July call indicated that 1H26 would represent 50% to 52% of annual revenue. Applying that range to actual 1H revenue of approximately $2.611 billion implied full-year revenue of approximately $5.02 billion to $5.22 billion.
Actual 9-month revenue of $3.917 billion plus the new Q4 range implies full-year revenue of approximately $5.17 billion to $5.27 billion, with a midpoint of approximately $5.217 billion. The new midpoint is approximately 1.9% above the midpoint mechanically implied by the July framework and close to the upper end of that earlier range.
This constitutes an improvement in the implied annual outlook, not a dramatic new step-up. Approximately $56 million of the improvement reflects Q3 revenue exceeding its previous midpoint. Using consistent midpoint arithmetic, the remaining approximately $39 million reflects a stronger implied Q4 outcome than embedded in the earlier annual weighting framework. Because the previous annual outlook was a revenue-weighting range rather than explicit full-year dollar guidance, this bridge is analytical rather than a management-described revision.
The current presentation explicitly shows full-year adjusted EPS of $9.41 at the Q4 midpoint, up approximately 138% from $3.96 in 2025. Full-year adjusted operating margin is mechanically approximately 32.9%, using reported 9-month operating profit and the Q4 midpoint. Full-year gross margin is approximately 59.4%.
The gross-margin comparison is more favorable than the sequential Q4 decline alone suggests. In July, management described annual gross margin around 59%, slightly below the target-model range. The current approximately 59.4% outlook is modestly better. Thus, the call simultaneously contains a weaker Q4 sequential margin outlook and an improved full-year margin outcome relative to the prior discussion.
Management’s description of 2027 as another year of healthy growth is a reiteration, not a newly introduced annual growth forecast. The incremental information is the stronger backlog, longer visibility, explicit expectation of Q1 growth from Q4, and more detailed customer-program timing.
COMPUTE: REAL QUALIFICATION PROGRESS, GRADUAL REVENUE CONVERSION
The dual-vendor strategy remains the central company-specific share-gain mechanism. The 1st hyperscaler customer is in the mature phase, with its next major ramp expected around the middle of 2027. The merchant GPU customer is in the fast-follower phase, with multiple devices under development and additional revenue expected in 2027. The 2nd hyperscaler has passed qualification and entered fast follower, with capacity purchases expected in 2H27. A 3rd hyperscaler is in initial qualification.
This is substantive progress relative to July, when management described the merchant GPU’s initial order as delivered and the 2nd hyperscaler as having completed correlation. However, qualification, correlation, initial production, fast follower, and mature dual sourcing are distinct commercial states. Passing qualification reduces technical risk but does not establish a fixed production allocation or immediate material revenue.
The current presentation describes fast-follower share rising gradually toward 30% and a mature dual-vendor share range of 30% to 70%. These are generic lifecycle expectations, not guaranteed allocations at the disclosed customers. July’s call also indicated that the initial qualification-to-ramp process could take approximately 9 to 12 months, with progression to mature dual sourcing potentially requiring several years.
The share-gain thesis is therefore credible but inherently staged. Customers must port programs, correlate measurements, establish yield equivalence, qualify interfaces and handling, and determine which devices can move between platforms without unacceptable production risk. A 2nd source can become strategically important while initially capturing a relatively small fraction of procurement.
Timing is the most significant change. July commentary anticipated the next surge for existing compute programs in 1H27. The current call places the 1st major hyperscaler ramp around midyear and the 2nd in 2H27. Smith acknowledged, “I think they are going to tend to be more back-half loaded.” The disclosures do not establish that an identical set of committed orders has slipped, but they weaken the case for assuming a broad compute acceleration early in 2027.
Management’s references to additional AI laboratories, custom-silicon programs, and potential investments beyond the named hyperscalers expand the opportunity set but should not be capitalized as awarded business. No revenue commitments, production allocations, or financial contributions were disclosed for those prospective engagements.
MARKET SHARE AND THE TARGET-MODEL RESET
Smith’s most important qualification was that “we need more ATE TAM in order to hit the revenue that we had in the model that we published.” This directly challenges a simplistic assumption that a larger test market automatically translates into proportionate Teradyne revenue.
The existing target model, dated February 3, 2026 in the current presentation, assumes an ATE market of $12 billion to $14 billion, approximately $6 billion of Teradyne revenue, gross margin of 59% to 61%, operating expenses of 27% to 29%, operating margin of 30% to 34%, and adjusted EPS of $9.50 to $11.00. It is not a calendar-2027 earnings commitment.
The model assumed revenue composition of approximately 80% Semiconductor Test, 10% Product Test, and 10% Robotics. More importantly, the semiconductor market has expanded disproportionately in compute, where Teradyne’s share is lower than in several legacy categories. Accordingly, Teradyne can gain share within compute while losing aggregate share through unfavorable market composition.
This distinction explains why management can simultaneously report successful customer qualifications, strong revenue growth, and dilution of overall market share. Market growth is concentrating where the incumbent competitor is strongest. Teradyne’s company-specific opportunity is to improve its participation over time, not to assume that the current market mix automatically produces historical aggregate share.
The existing earnings model is not uniformly deteriorating. Full-year EPS of approximately $9.41 is already close to its $9.50 lower bound despite revenue remaining approximately 13% below the $6 billion target. Profitability has scaled better than the revenue target alone would imply. The weakness is primarily in the relationship between total market size and achievable company revenue, together with uncertainty over the future business mix.
The next model update must therefore establish more than a larger addressable market. It must show achievable revenue capture, the investment required to support it, and the resulting earnings conversion. A higher TAM without a commensurate increase in company revenue and cash generation would not independently justify a higher valuation.
MEMORY: THE STRONGEST CURRENT GROWTH ENGINE
Memory revenue of $301 million increased 42.0% sequentially from $212 million and represented approximately 23.0% of consolidated sales. It was the 4th consecutive quarter above $200 million and followed July’s disclosure of a memory book-to-bill ratio above 2. The Q3 result therefore provides evidence that previously reported demand converted into shipments.
Management expects significant memory growth in 2027, with HBM likely to contribute the largest increase, accompanied by growth in conventional DRAM and NAND. The demand drivers differ. HBM benefits from accelerator deployment and technology transitions; conventional DRAM benefits from broader server and memory-capacity requirements; NAND is recovering as storage demand and customer capacity investment improve.
The investment implication is stronger than a generic memory-cycle recovery. Teradyne participates in both capacity additions and technology changes that require different signal integrity, speed, power, and characterization capabilities. However, memory is not uniformly accretive to margins. The July call explicitly identified memory as a continuing margin pressure, reinforcing the possibility that strong memory revenue can support growth while limiting consolidated gross-margin expansion.
Q4 normalization should not automatically be interpreted as a demand break after a 42% sequential increase. The more relevant evidence will be 2027 order conversion, customer fab schedules, product mix, and the duration of any digestion. A prolonged decline accompanied by weakening customer forecasts would have a different implication from a temporary shipment pause following a record quarter.
LOWER HBM STACK HEIGHTS: A PLAUSIBLE ADVANTAGE WITH IMPORTANT LIMITATIONS
The most differentiated technical disclosure was management’s observation that accelerator designs are moving toward lower HBM stack heights because DRAM wafer availability is constrained. Teradyne’s opportunity arises because its share in HBM performance test is higher than its share in DRAM wafer sort.
With a fixed number of usable DRAM dies, 4-high stacks can produce approximately 2 times as many stack units as 8-high stacks, before yield differences and other constraints. More completed stacks create more potential performance-test units. The favorable implication is therefore a change in the distribution of test spending toward a stage where Teradyne has stronger positioning.
That logic does not imply a 2 times increase in tester demand. Equipment requirements depend on stack count multiplied by test time per stack, adjusted for parallelism, utilization, yield, and available operating hours. Lower-capacity stacks may require less memory-array test time, while fixed interface checks, handling, thermal settling, and other per-stack procedures may preserve substantial unit-based content.
Lower stacks also do not create additional DRAM bits. They redistribute the same die supply across more packages. Accelerator shipments benefit only if system designs can accommodate lower memory capacity per accelerator, additional stack positions, or architectural changes elsewhere. More stacks can require more base dies, package area, assembly steps, and interconnect resources, potentially transferring the bottleneck rather than eliminating it.
Likewise, more stacks can increase aggregate interface bandwidth when incorporated into a suitable architecture, but they do not inherently raise per-pin data rates. The economic outcome depends on the specific accelerator, workload, packaging configuration, and memory-capacity requirement.
Management appropriately declined to quantify the sensitivity. The conclusion is a medium-confidence positive mix opportunity for Teradyne, not a proven step-change in memory revenue. The partially garbled analyst question about possible HBM specification reductions was not conclusively answered. The call therefore does not resolve whether lower interface speeds or other specification changes could offset some test-complexity benefits.
COMPETITIVE POSITION AND CAPACITY EXECUTION
Teradyne has expanded UltraFLEXplus manufacturing capacity to approximately 4 times its level 18 months earlier and is planning another increase. A 2nd contract manufacturer was qualified for the platform in 2026, with a similar process underway for memory test. Capacity is also being expanded for memory and the Eagle power-test line.
This is strategically necessary. Customers adopting dual sourcing partly seek supply assurance, so a technically qualified alternative with insufficient delivery capacity would have limited commercial value. Capacity expansion strengthens the credibility of the share-gain proposition.
However, capacity growth is not equivalent to revenue growth. It measures available production capability rather than committed demand or utilization. Management also acknowledged that unexpected demand without advance forecasts would face longer lead times than a year earlier.
The relevant competitive question is whether Teradyne can deliver complete, qualified test cells on the customer’s required schedule. Tester availability alone is insufficient if probe cards, interfaces, handlers, thermal control, or optical alignment are not ready. This explains the importance of ecosystem partnerships and the caution around quarterly shipment timing.
The call does not provide independently verified competitor share data. Management’s comments support gradual progress, but the stronger claim that competitive displacement is accelerating broadly remains unproven.
PRODUCT INNOVATION: ENABLING CAPABILITY RATHER THAN AUTOMATIC REVENUE MULTIPLIERS
The new UltraFLEXplus instruments address substantial engineering requirements. UltraPin5000-EM offers up to 80 times deeper instrument memory for characterization workloads. UltraVS64-HP supports testing accelerators with current requirements up to 15,000 amps. UltraPort-PCIe6 extends automated test capability to PCIe Gen6.
These specifications should be interpreted carefully. Deeper pattern memory is not equivalent to an 80 times increase in test time, throughput, or revenue. The 15,000-amp rating is a current capability, not a power figure without voltage and operating-condition information. PCIe Gen6 support establishes capability for newer interfaces but does not by itself determine customer allocations.
The commercial significance is that customers need test systems capable of supporting devices that existing configurations cannot adequately characterize or qualify. This can create both installed-base upgrade revenue and demand for new systems. The relative contribution from upgrades versus complete tester purchases was not disclosed.
Titan HP burn-in capability extends coverage across reliability and system-level testing, while Magnum E2 supports next-generation memory requirements. UltraFLEXplus S addresses smaller-footprint digital and edge-AI applications. These introductions broaden the opportunity set, but the call does not demonstrate that mobile or edge-AI demand has already recovered sufficiently to make those products major near-term earnings drivers.
PRODUCT TEST AND CONNECTIVITY: GROWTH WITHOUT A SINGLE ARCHITECTURAL BET
Product Test revenue increased 29.0% sequentially to $138 million, with a 1.4 book-to-bill ratio. Mechanically, that ratio implies approximately $193 million of bookings against quarterly revenue, or approximately $55 million more bookings than shipments, before cancellations, scope differences, and other backlog adjustments. It supports continued growth but is not a disclosed backlog balance or a guaranteed Q4 revenue forecast.
The growth spans production board test, optical test, and high-speed copper interconnect. As data rates rise, backplanes and cable assemblies require more demanding signal-integrity validation. Time-domain reflectometry and bit-error-rate testing become more economically important as failures at the rack or cluster level become more expensive.
Turner directly corrected the assumption that Product Test was diluting gross margin: “Product Test is actually accretive to the overall portfolio.” This means its growth can improve both diversification and consolidated gross-margin mix. It does not establish a particular segment operating margin, since investment requirements and corporate allocations were not quantified.
The Multi-Lane Test Products joint venture also introduces a distinction between consolidated revenue and earnings attributable to Teradyne shareholders. Reported net income attributable to noncontrolling interests increased to $5.3 million from approximately $0.4 million in Q2. The release does not allocate all of that change to an individual business, but the rising minority claim means consolidated operating growth should not be assumed to accrue entirely to the parent.
CPO: ATTRACTIVE OPTIONALITY, UNCHANGED NEAR-TERM UNCERTAINTY
Management reiterated a CPO test-equipment market of approximately $100 million in 2026 and $300 million to $700 million by 2028. The 2028 range is unchanged from July. A significant initial customer ramp is expected in 2027, but growth remains dependent on production economics, test times, assembly processes, and the readiness of the broader ecosystem.
The opportunity is meaningful but should be scaled correctly. The $300 million to $700 million figure refers to the total test-equipment market, not Teradyne revenue. The reference to an eventual market of $1 billion or more is a longer-term possibility without a firm date, not additional 2028 guidance.
The technical tension is important. High test intensity increases equipment content per unit, but excessive test cost can slow adoption of the architecture itself. Reductions in test time could lower equipment intensity per device while making broader CPO deployment more economically attractive. The net revenue outcome depends on whether higher deployment volumes outweigh lower test content.
Teradyne’s positioning across copper, pluggables, optical engines, switch silicon, and emerging co-packaged architectures reduces dependence on a single transition schedule. That is a stronger strategic argument than assuming the fastest CPO ramp. The company can benefit from rising connection counts even if the physical architecture evolves more slowly than expected.
POWER MANAGEMENT, STORAGE, AND ROBOTICS
Automotive and industrial SoC revenue increased nearly 90% year over year, driven primarily by power-management requirements for AI data centers. Management expects product revenue in this category to exceed $600 million in 2026, compared with less than $400 million in 2025. This implies growth exceeding 50%, but it should not be interpreted as evidence of an equally strong recovery in underlying automobile production or conventional industrial demand.
The shift toward 800-volt architectures and integrated voltage regulation can create new test requirements across power distribution and conversion. The opportunity is additional technical content as well as capacity. Nevertheless, not every architecture change automatically produces proportionate tester revenue, and the call provided no quantified contribution from these technologies.
Integrated Systems Test revenue reached $95 million, up approximately 150% year over year and 41.8% sequentially. Management linked growth primarily to AI-related hard-disk demand across all 3 major suppliers. Because hard-drive test time is more closely related to capacity than unit count, exabyte growth above 20% can support test-equipment demand even when drive shipments grow more slowly.
This makes storage exposure an important complement to accelerator test. However, customer additions and initial capacity deployments can create unusually strong shipment periods. The $95 million record should not be treated as a guaranteed recurring quarterly baseline.
Robotics generated $96 million and achieved profitability during the quarter. Electronics and semiconductor applications are now its largest vertical, while AI-related revenue represented approximately 20% of Robotics sales over the 1st 9 months. That is meaningful exposure, but most Robotics revenue still sits outside the specifically identified AI category.
The largest Robotics customer increased revenue approximately 3 times from 2025 to 2026. Deployment progressed from engineering validation in 2025 to initial distribution-center implementation in 2026, with broader deployment expected in 2027. The key constraint is the customer’s ability to convert facilities, refine workflows, and scale installation processes.
Broader physical-AI commercialization has a longer timetable. Smith stated, “I think it’s probably more of a 2028 thing than a 2027 thing beyond our sort of major customer in Robotics.” This is an important qualification to any thesis that assumes a near-term Robotics revenue inflection from newly announced AI partnerships. Laboratory sales and development relationships are not equivalent to scaled end-customer deployment.
Robotics visibility also remains shorter and more probabilistic than Semiconductor Test, except at the largest customer. Profitability is encouraging, but the call did not establish a durable segment margin or a fully recurring order base.
MARGINS: INVESTMENT PRESSURE, MIX, AND AN ADDITIONAL INVENTORY SIGNAL
The primary margin concern is the progression from 59.8% gross margin in Q2 to 59.1% in Q3 and approximately 58.0% at the Q4 midpoint. Operating margin falls more sharply because spending continues to rise.
Management attributed Q3 sequential gross-margin pressure mainly to mix and Q4 pressure to mix and product introductions. The earnings release provides an additional relevant data point: provisions for excess and obsolete inventory increased to $10.9 million from $3.6 million in Q2. Net of sales of previously written-down inventory, the associated charges increased from approximately $3.0 million to $10.7 million.
The $7.7 million increase is equivalent to approximately 59 basis points of Q3 revenue. That is significant relative to the reported 70-basis-point sequential gross-margin decline. This does not establish a complete causal reconciliation because revenue, product mix, and other costs also changed. It does establish that the margin decline should not be attributed exclusively to business mix without examining inventory charges.
The annual perspective is less alarming: 9-month excess-and-obsolete provisions were approximately $19.2 million in both 2026 and 2025. The Q3 increase may reflect timing or portfolio transitions rather than a broad deterioration in demand. Nonetheless, the combination of rapidly rising inventory and higher quarterly provisions deserves monitoring.
For 2027, management described approximately balanced positive and negative gross-margin forces. Volume and selected mix effects are potential benefits; component inflation and added capacity costs are potential pressures. The draft transcript reverses the headwind and tailwind labels in part of Turner’s answer, but Smith’s summary of “equal up-and-down forces” makes the intended interpretation clear.
A 100-basis-point operating-margin difference on $6.3 billion of revenue would change annual pretax operating profit by approximately $63 million and adjusted EPS by roughly $0.34, assuming a 15% tax rate and 157 million shares. Margin execution is therefore material enough to offset a meaningful portion of revenue upside.
CASH FLOW, INVENTORY, AND CAPITAL ALLOCATION
Q3 operating cash flow was $313.6 million and capital expenditures were $86.3 million, producing $227.3 million of free cash flow. Free cash flow represented 17.4% of revenue and approximately 63% of adjusted net income. It declined approximately 40% from Q2’s $378 million despite only a modest revenue decline.
Year-to-date free cash flow of $806.1 million was much stronger, up approximately 248% and representing approximately 20.6% of sales. The company is generating substantial cash, but the quarterly conversion profile reflects the cost of preparing for future demand.
Inventory and prepayments were the largest cash absorbers. The Q3 cash-flow statement shows approximately $171 million used by inventory and $165 million used by prepayments and other assets. Accounts payable and other liabilities provided approximately $226 million, partially financing those investments.
Net inventory increased from $403.3 million to $575.0 million, a 42.6% sequential increase. Prepayments increased from $468.2 million to $613.7 million. Combined, these balances increased approximately $317 million. The prepayment balance is not fully characterized in the call, so it should not be assumed that every dollar represents the same type of component commitment.
Turner described the inventory build as approximately 50% demand preparation and 50% protection against supply constraints, while also noting normalization from unusually low inventory levels. This makes inventory an ambiguous demand indicator. It supports management’s confidence in growth, but it cannot be converted directly into an implied revenue growth rate.
The draft transcript’s references to 189 inventory days and 35% quarterly growth do not reconcile directly to the reported net-inventory balances under a simple inventory-only calculation. A definition bridge is required before those figures can support peer comparisons. The presentation reports DSO of 62 days, down from 63 in Q2 and 69 a year earlier, using a trailing-period methodology.
Cash and marketable securities reached approximately $625 million. Q3 dividends and repurchases totaled approximately $120 million, leaving approximately $108 million of free cash flow after those distributions. The balance sheet showed no outstanding short-term debt at quarter-end.
The pending $300 million FormFactor investment is a material subsequent cash commitment, equivalent to approximately 48% of quarter-end cash and marketable securities. Holding all other cash movements constant, it would reduce that balance to approximately $325 million. This is a mechanical liquidity illustration, not a Q4 cash forecast.
FormFactor’s October 12 announcement confirms that the transaction is an equity investment linked to a broad technology collaboration, not an acquisition of the company. FormFactor revenue therefore should not be added to Teradyne’s consolidated outlook. The strategic rationale is stronger integration of probing, interfaces, characterization, and automated test across advanced packaging, HBM, compute, and photonics.
The investment can improve production readiness and customer engagement, but no quantified revenue synergies or earnings accretion were disclosed. Its strategic value must ultimately be assessed against the opportunity cost of cash and the resulting commercial wins.
2027 VISIBILITY AND THE RISK OF BACK-END CONCENTRATION
Management now has approximately 2 quarters of useful visibility, compared with a historical baseline near 13 weeks. That supports the expectation of Q1 growth and reduces reliance on traditional consumer-electronics seasonality.
However, visibility is not the same as a fixed shipment schedule. Management explicitly noted that test-cell readiness can move revenue between quarters. Customer forecasts also precede formal orders, and the call did not quantify consolidated backlog, cancellation provisions, or the proportion tied to firm delivery dates.
The most balanced interpretation is that the direction of demand is more visible than its quarterly recognition. Confidence is relatively high that AI-related test requirements remain strong. Confidence is lower regarding the exact timing of hyperscaler deployments, customer facility readiness, and the operating margin earned on the resulting mix.
The combination of midyear compute ramps, 2H27 purchases from the 2nd hyperscaler, and back-end deployment by the largest Robotics customer creates a concentration risk. These opportunities are commercially separate, but multiple delays could coincide and reduce the ability of the broader portfolio to offset them.
Management’s claim that historical mobile-driven seasonality has become less relevant is supported by the change in business composition. It does not eliminate cyclicality. The dominant cycle has shifted toward data-center investment, semiconductor capacity deployment, and large-customer program timing.
VALUATION AND PROBABILITY-WEIGHTED INVESTMENT IMPLICATIONS
The Bloomberg notice recorded a 5.5% aftermarket decline to $306 on 17,434 shares. That is a release-period price reference, not a verified post-call or current trading price. The reported trading volume is also insufficient to establish a broad institutional interpretation. The decline cannot be attributed specifically to statements made on the subsequent call.
At $306, the shares trade at approximately 32.5 times the company’s $9.41 full-year adjusted EPS outlook and approximately 36.4 times annualized Q4 midpoint EPS of $8.40. Annualizing Q4 is not a 2027 forecast, but it illustrates that the valuation already requires renewed earnings growth rather than merely maintenance of the current exit rate.
A medium-confidence investment interpretation is that the market is valuing successful conversion of 2027 and 2028 opportunities, not simply the delivered Q3 result. At 25 times earnings, a $306 price requires $12.24 of EPS. At 30 times, it requires $10.20. The distinction between those earnings levels is large enough that customer timing, margins, and valuation compression can dominate the modest quarterly consensus beat.
An illustrative base case, assigned 50% probability, assumes 2027 revenue of $6.3 billion, approximately 21% growth from the 2026 midpoint, and a 33% adjusted operating margin. Assuming a 15% tax rate, 157 million diluted shares, and approximately offsetting below-operating-line income and minority claims, EPS would be approximately $11.26. A 28 times multiple implies approximately $315 per share, only about 3% above the $306 reference.
An illustrative bull case, assigned 25% probability, assumes $7.2 billion of revenue, approximately 38% growth, and a 35% operating margin. This requires strong memory expansion, timely compute ramps, successful capacity execution, and better expense leverage despite ongoing investment. Under the same simplifying tax and share assumptions, EPS would be approximately $13.64. A 34 times multiple implies approximately $464, or approximately 52% upside.
An illustrative bear case, assigned 25% probability, assumes $5.4 billion of revenue, approximately 3.5% growth, and a 28% operating margin. This reflects delayed compute deployments, memory digestion, slower Robotics conversion, and costs incurred ahead of revenue. EPS would be approximately $8.19. A 23 times multiple implies approximately $188, or approximately 38% downside.
These are analyst scenarios, not management guidance or verified consensus, and the probability and multiple assumptions have low-to-medium confidence. Their probability-weighted value is approximately $321, only about 5% above the reference price before dividends. The principal conclusion is that an attractive operating outlook does not necessarily create an attractive new-entry risk-reward at a valuation already dependent on substantial execution.
POSITIONING, CATALYSTS, AND THESIS INVALIDATION
The appropriate stance is to retain a modest position where existing exposure is justified by a differentiated view of compute share gains or memory-test content, while avoiding aggressive additions solely because Q3 beat consensus. A new position becomes more compelling with either a materially lower entry price or evidence that sustainable 2027 EPS can exceed approximately $12 without requiring peak margins or unusually favorable timing.
An illustrative existing-position limit is 0.5% to 1.0% of NAV until the updated earnings model and early-2027 order conversion provide additional evidence. This is a risk-budget framework rather than a portfolio-specific sizing recommendation because actual holdings, liquidity requirements, and factor exposures are unavailable.
For a position referenced to $306, a 15% price stop is approximately $260. At a 0.5% to 1.0% NAV weight, that represents a planned portfolio loss of approximately 7.5 to 15 basis points, excluding gaps and slippage. The bear-case valuation implies a larger stress loss of approximately 19 to 38 basis points at those weights. A stop does not guarantee the maximum realized loss.
Fundamental exit or reduction triggers include the removal of expected Q1 sequential growth without a clearly recoverable shipment explanation, further material delays to hyperscaler ramps, sustained margin pressure below the Q4 framework despite higher revenue, rising inventory provisions without corresponding order conversion, or evidence that dual sourcing is failing to generate incremental production allocations.
The most important near-term catalyst is the updated target earnings model on the Q4 results call in early 2027. Subsequent catalysts are actual Q1 growth from Q4, the 1st hyperscaler’s midyear ramp, 2H27 purchases from the 2nd hyperscaler, and broader deployment by the largest Robotics customer. CPO and wider physical-AI adoption are more appropriately treated as 2027 to 2028 optionality than as assured near-term earnings.
Portfolio diversification benefits should be assessed conservatively. Teradyne can diversify individual chip-design and customer risks, but it remains exposed to the same AI capital-expenditure factor that drives accelerators, HBM, networking, optical components, and other semiconductor-equipment holdings. Adding Teradyne to an already concentrated AI infrastructure portfolio may increase correlated downside even when its product mix appears broader.
The quarter’s central conclusion is that Teradyne has established a materially larger and more resilient operating base, but the next stage of investment returns depends on converting technical qualifications and ecosystem investments into timely, profitable, cash-generative revenue. Q3 supports that opportunity. It does not yet remove the timing and valuation risks.
SOURCE AND TRANSCRIPT QUALIFICATIONS
Financial comparisons are based on Teradyne’s October 27, 2026 earnings release, October 28 presentation, July 28 earnings release, July 29 earnings call, the supplied October 28 draft transcript and Bloomberg notice, and FormFactor’s October 12 collaboration announcement. Consensus comparisons use the Bloomberg snapshot accompanying the event.
The official financial materials confirm Q3 gross margin of 59.1%; the temporary 51.1% statement in the draft call was explicitly corrected. The current presentation dates the existing target earnings model to February 3, 2026, notwithstanding conversational references to January. Unnamed compute and Robotics customers remain unidentified because the call does not establish their identities. Statements about future demand, market size, and customer deployment remain management expectations rather than independently guaranteed outcomes.
COMPANY EMPLOYEES ON THE CALL
• Amy McAndrews, Vice President of Corporate Relations. The draft participant header labels the role Corporate Affairs; the earnings release and call introduction use Corporate Relations. • Greg Smith, President and Chief Executive Officer. • Michelle Turner, Vice President and Chief Financial Officer.
RESEARCH ANALYSTS ON THE CALL
• CJ Muse, Cantor Fitzgerald. • Timothy Arcuri, UBS. • Mehdi Hosseini, Susquehanna International Group. • Jim Schneider, Goldman Sachs. • Joseph Cardoso, J.P. Morgan. • Vivek Arya, Bank of America Securities. • Krish Sankar, TD Cowen.
Key Read-Throughs
KEY READ-THROUGHS FROM TERADYNE’S Q3 2026 EARNINGS CALL
Teradyne’s results indicate that AI investment is expanding beyond accelerators into memory, storage, interconnects, power conversion, and production reliability. The most actionable implications are not simply that semiconductor demand remains strong. Memory shortages are influencing system architecture; sophisticated copper connectivity retains a substantial commercial runway; test and qualification are capturing more of semiconductor investment; and competitive opportunities are opening as customers prioritize supply assurance. The negative implications are equally important: additional test capacity does not eliminate memory constraints, customer qualification does not guarantee immediate production revenue, and emerging architectures such as co-packaged optics remain constrained by manufacturing economics. The strongest conclusions concern industry demand, competitive positioning, and deployment timing, rather than mechanically transferring Teradyne’s growth rates to other companies. Country labels below identify listing markets, not legal domicile. Magnitudes refer to fundamental business exposure, not predicted share-price moves.
MEMORY AND AI ACCELERATORS
MEMORY SCARCITY IS CHANGING PRODUCT DESIGNS, REINFORCING SUPPLIER BARGAINING POWER (READ-THROUGH 1)
Affected companies: Micron Technology (MU: US); SK hynix (000660: South Korea). Direction: positive. Magnitude: high fundamental relevance, with a moderate incremental information contribution because both suppliers have already disclosed strong demand and constrained supply.
The most important evidence is Greg Smith’s statement that “the bottleneck is the total number of DRAM wafers that can be produced.” Management reported that accelerator manufacturers are moving toward lower HBM stack heights to obtain more completed stacks from available DRAM wafers. Memory-test revenue reached $301 million, increasing approximately 42% sequentially, and management expects significant additional memory growth in 2027, led by HBM.
The transmission mechanism is stronger than a conventional demand indicator. Customers are adjusting architecture around constrained memory availability rather than simply waiting for lower prices. That supports the strategic value of qualified DRAM output, supply commitments, and manufacturing execution. It also argues against interpreting lower stack heights as evidence of collapsing HBM demand. At unchanged delivered bits and die density, moving from 12-high to 8-high requires 50% more stacks; it does not reduce the number of DRAM dies consumed. Actual outcomes depend on density, capacity requirements, and product mix.
Micron’s September 30 prepared remarks already reported agreements covering the vast majority of calendar-2027 HBM bit supply at significantly higher year-over-year prices. SK hynix’s October 28 release disclosed signed agreements covering more than 50% of planned 2027–2028 production capacity. Teradyne therefore supplies independent downstream corroboration, not a previously undisclosed contractual upgrade. The evidence supports sustained utilization and favorable supply economics, but not an assumption that every HBM contract reprices immediately or that higher stack shipments translate proportionately into profit.
Near-term trading catalysts are subsequent disclosures on 2027 HBM pricing, capacity commitments, and shipment mix. The longer-duration implication is that memory remains a binding input to AI infrastructure through the upcoming capacity cycle. New fabs eventually weaken scarcity, but their construction, qualification, and production ramps prevent an immediate supply response.
MORE HBM STACKS DO NOT AUTOMATICALLY MEAN MORE SHIPPABLE ACCELERATORS (READ-THROUGH 2)
Affected companies: NVIDIA (NVDA: US); Advanced Micro Devices (AMD: US). Direction: negative for unconstrained shipment and memory-content assumptions, with a potentially positive mitigation mechanism from architectural adaptation. Magnitude: high operational relevance; no defensible company-specific revenue haircut can be derived from the call.
Teradyne stated that memory constraints are “so severe” that accelerator designs are moving toward lower stack heights. Smith illustrated that available DRAM wafers can produce approximately 2 times as many 4-high stacks as 8-high stacks. This establishes an industry supply constraint, but it does not identify which NVIDIA or AMD products are changing configuration.
The precise transmission mechanism is the requirement to match accelerator compute silicon with sufficient qualified memory capacity, bandwidth, packaging, and interconnect resources. Additional logic-wafer output or test capacity cannot produce a complete accelerator if the necessary memory is unavailable. NVIDIA’s HBM dependence is reinforced by Micron’s disclosed collaboration on custom HBM4E for future NVIDIA platforms. AMD’s published MI350X specifications include 288 GB of HBM3E, demonstrating the materiality of memory to its accelerator architecture.
Lower stack heights can mitigate the bottleneck only through a compatible design change. Maintaining the same memory capacity requires more stacks, higher-density dies, or another architectural solution. More stacks can increase packaging area, base-die requirements, assembly work, and interface complexity. Accepting less memory per accelerator may increase available accelerator units but alter workload suitability and system economics. None of these outcomes follows automatically from stack count.
The actionable negative conclusion is that forecasts should not simultaneously assume unrestricted accelerator-unit growth, uninterrupted memory-capacity growth per device, and unchanged packaging requirements. The call provides no basis for declaring a specific shipment miss, product downgrade, or loss of demand at either company.
Near-term catalysts are product-configuration disclosures, memory supply commentary, and shipment-conversion updates during the next earnings cycle. Over 2027–2028, the fundamental advantage accrues to platforms that optimize scarce memory resources without materially compromising workload performance. That supports the importance of hardware-software co-design while increasing execution risk around transitions.
SEMICONDUCTOR TEST AND PRODUCTION INFRASTRUCTURE
ADVANTEST RETAINS NEAR-TERM MARKET SUPPORT, BUT DUAL SOURCING CREATES A REAL LONGER-TERM SHARE RISK (READ-THROUGH 3)
Affected company: Advantest (6857: Japan). Direction: positive near term; negative to longer-term assumptions of unchanged compute dominance. Magnitude: high, given the importance of advanced SoC testing to the business.
Teradyne reported that test represented 8.1% of semiconductor capital expenditure during the 1st 8 months of 2026, versus 6.4% in 2025. The periods differ, so this is not a matched annual growth comparison, but it supports increasing test intensity. Smith also acknowledged that the competitor has established “a very powerful share position in compute” and that compute-market expansion has diluted Teradyne’s aggregate share despite progress within individual accounts.
These statements are positive for the incumbent’s near-term demand capture. Advantest’s October 28 forecast independently raised fiscal-year sales guidance from ¥1.714 trillion to ¥1.863 trillion and operating-profit guidance from ¥846 billion to ¥967 billion. Teradyne’s call corroborates that expansion rather than predicting an earnings release that had already occurred.
The negative transmission mechanism is customer-driven diversification. Teradyne’s 2nd hyperscaler has passed qualification and entered fast follower; a merchant GPU customer has multiple devices in development; and a 3rd hyperscaler is in initial qualification. As customers establish viable alternative platforms, incremental procurement can be allocated away from the incumbent, while sole-source dependence and switching barriers gradually decline.
Timing materially limits the near-term bearish interpretation. The next major ramp at Teradyne’s mature hyperscaler is expected around mid-2027, and capacity purchases at the 2nd hyperscaler are expected in 2H27. Qualification is not a fixed production allocation, and a rapidly expanding market can allow both vendors to grow even as their relative shares change.
The immediate trading implication is that Teradyne’s progress is insufficient evidence for a near-term Advantest earnings short. The more consequential catalyst is actual allocation and production conversion during mid-to-late 2027. Over several years, dual sourcing creates a credible constraint on market-share durability and potentially commercial bargaining power, although the call does not establish current price compression.
PROBE AND INTERFACE CAPABILITIES ARE BECOMING A GREATER PART OF THE COMPETITIVE ADVANTAGE IN TESTING (READ-THROUGH 4)
Affected companies: FormFactor (FORM: US); Technoprobe (TPRO: Italy). Direction: positive. Magnitude: material strategic relevance for both; the direct disclosed financial commitment is specific to FormFactor.
Smith emphasized an “open non-exclusive ecosystem of probing, handling and interface partners” that allows complete test cells to be validated before reaching customers. He specifically identified FormFactor and Technoprobe as partners. The call also highlighted higher current requirements, deeper characterization memory, faster interfaces, and rapidly changing optical alignment techniques.
The transmission mechanism is that a tester cannot generate productive throughput without a compatible interface, probe solution, handling system, thermal environment, and validated test process. Rising current density and signal-integrity requirements increase the engineering value of these interfaces. Their suppliers can participate through customized products, qualification work, new-device introductions, and installed production capacity.
FormFactor’s October 12 announcement establishes a broad collaboration covering compute, advanced packaging, HBM, and silicon photonics, alongside Teradyne’s proposed $300 million equity investment. The earnings call adds an expected Q4 closing window, subject to approvals and customary conditions. This is a concrete strategic commitment, but the investment is not a $300 million product order and should not be treated as operating revenue.
Technoprobe’s existing relationship remains relevant because management explicitly described a nonexclusive ecosystem. FormFactor’s inclusion is not evidence that Technoprobe has been displaced. Equally, neither partner should be assigned all of Teradyne’s incremental test-cell demand. Customer designs, technical suitability, and sourcing decisions determine allocation.
The near-term catalyst for FormFactor is transaction closing and subsequent disclosure of commercial programs. For both companies, the more important 2027 catalyst is conversion of advanced-device qualifications into production interfaces and probe-card demand. The geographic implication is that strategic beneficiaries extend beyond US and Japanese tester manufacturers to specialized European interface suppliers, without establishing a shift in semiconductor production geography.
BURN-IN DEMAND IS EXPANDING, BUT THE SCARCITY PREMIUM FOR SPECIALIST SUPPLIERS IS LESS SECURE (READ-THROUGH 5)
Affected company: Aehr Test Systems (AEHR: US). Direction: positive for underlying demand; negative for assumptions of limited competition and uniquely defensible AI burn-in exposure. Magnitude: potentially high for a specialist supplier, but no observed share loss is established.
Teradyne stated that customers are increasingly adopting system-level test and burn-in to protect data-center reliability. It introduced burn-in capabilities for Titan HP that provide “full system test coverage across burn-in temperature ranges.”
The positive mechanism is straightforward: expensive AI processors and tightly coupled systems increase the economic cost of latent defects and early-life failures. Additional reliability screening creates demand for equipment, device-specific consumables, thermal control, and production software. Aehr has directly verified exposure. Its October 7 announcement disclosed approximately $6 million of follow-on Sonoma orders for a hyperscaler’s next-generation AI processor, with deliveries over 6 months and production expected to ramp in 2027.
The negative implication is competitive rather than evidence of lost orders. Teradyne is extending an established platform into additional reliability-testing functionality and can offer customers broader test integration and support. That weakens the assumption that expanding AI burn-in expenditure necessarily accrues predominantly to smaller specialists.
The distinction between test insertions remains critical. Aehr’s package-level Sonoma platform and Teradyne’s system-level capabilities are not proven interchangeable substitutes in every application. Aehr’s disclosed multi-zone thermal control and device-specific production qualifications can remain meaningful differentiators. The high-conviction conclusion is that the competitive set is broadening, not that Aehr’s existing production programs have been displaced.
Aehr’s November 2 results are the immediate catalyst for bookings, backlog conversion, and competitive commentary. Over 2027, repeat orders and retention across successive processor generations will distinguish durable platform adoption from temporary demand created by limited available capacity.
NETWORKING AND OPTICAL INFRASTRUCTURE
COPPER CONNECTIVITY IS BECOMING MORE VALUABLE PER CONNECTION, NOT SIMPLY WAITING TO BE REPLACED BY OPTICS (READ-THROUGH 6)
Affected companies: Amphenol (APH: US); Credo Technology Group (CRDO: US). Direction: positive. Magnitude: high for Credo’s connectivity exposure and meaningful for Amphenol’s data-center business, with a smaller proportional effect on Amphenol’s diversified group.
Teradyne stated that scale-up networking remains predominantly copper and that unprecedented data rates have transformed backplanes and cables “from commodities to highly-engineered and tested elements of the HPC system.” Product Test revenue increased approximately 29% sequentially to $138 million, with a 1.4 book-to-bill ratio and particular strength in the Multi-Lane Test Products joint venture.
The transmission mechanism is a combination of more connections and greater engineering content per connection. Higher signaling rates increase the importance of connectors, cable assemblies, signal integrity, retiming, power efficiency, and reliability. Amphenol participates through interconnect hardware. Credo participates through active electrical cables and related connectivity silicon. These are shared end-market exposures, not newly disclosed supplier contracts with Teradyne.
The non-consensus implication is that optical adoption and copper growth are not mutually exclusive. Reach, power, latency, serviceability, and cost determine which medium is appropriate for each link. Expanding clusters can increase both copper and optical requirements even as optical technology penetrates additional applications.
Credo’s own October product disclosures also show why the distinction matters: it is developing optical solutions alongside copper products, rather than relying exclusively on copper’s persistence. Teradyne’s commentary supports a prolonged period in which several architectures coexist, not a permanent technological barrier to optical substitution.
Amphenol had already released Q3 results on October 28, including 37% organic sales growth and a 1.19 company-wide book-to-bill ratio. Teradyne therefore corroborates demand rather than supplies an undisclosed Q3 beat. Its 1.4 ratio must not be transferred to either peer because Product Test also includes boards, optical testing, and other applications.
Near-term catalysts are subsequent order-conversion and customer-ramp disclosures through Q4 and early 2027. The longer-duration shift is toward higher-value interconnect content and more stringent qualification, supporting differentiated suppliers rather than undifferentiated cable-volume exposure.
PLUGGABLE OPTICS RETAIN A LONGER RUNWAY, WHILE AGGRESSIVE CPO RAMP ASSUMPTIONS REQUIRE MORE EVIDENCE (READ-THROUGH 7)
Affected companies: Fabrinet (FN: US); Coherent (COHR: US). Direction: positive for established optical production; negative for overly aggressive CPO-specific timing assumptions. Magnitude: meaningful for Fabrinet’s manufacturing demand and Coherent’s optical portfolio, but not a justified company-wide earnings downgrade.
Teradyne reiterated a CPO test-equipment market of approximately $100 million in 2026 and $300 million to $700 million by 2028. Smith said high test intensity could limit deployment until production economics improve, while emphasizing that connections must be implemented “whether they get made with CPO or NPO or pluggables or copper.”
The positive transmission mechanism for Fabrinet is the continuing need to manufacture, package, align, and test complex optical components and modules across multiple architectures. A slower transition to CPO can preserve established pluggable production while new architectures generate additional qualification and packaging work. Fabrinet is a manufacturing-services provider, so benefits depend on customer program allocation and manufacturing value added, not ownership of every underlying optical technology.
For Coherent, the conclusion is more balanced. Its components and integrated assemblies participate in several optical architectures, supporting broad demand exposure. However, delays in achieving efficient optical-engine assembly and testing can postpone the revenue ramp associated with specific CPO programs and extend the period of capacity investment before full utilization.
Important counterevidence prevents an indiscriminate bearish interpretation. Coherent’s September 21 PhotonLink announcement disclosed more than 10 CPO engagements, more than 10 NPO engagements, anchor customers, and expected initial revenue ramping in Q4 2026. Teradyne’s discussion of broader 2027 adoption does not contradict initial supplier revenue in late 2026. Moreover, Teradyne’s 2028 market range was reiterated, not cut.
The actionable distinction is between initial commercialization and large-scale deployment. Fabrinet’s November 2 results and Coherent’s November 4 results are immediate catalysts for production timing, qualification conversion, and capacity utilization. Over 2027–2028, the winners should be suppliers capable of serving several architectures while reducing assembly and test costs. High test intensity creates equipment demand, but excessive total manufacturing cost can delay the end market that funds it.
DATA STORAGE
HARD-DRIVE TEST CAPACITY CONFIRMS EXABYTE DEMAND, NOT A RETURN TO UNIT-DRIVEN COMMODITY GROWTH (READ-THROUGH 8)
Affected companies: Seagate Technology (STX: US); Western Digital (WDC: US). Direction: positive. Magnitude: high business relevance, but primarily corroborative rather than a fresh earnings surprise.
Teradyne’s Integrated Systems Test revenue reached $95 million, approximately 150% above the prior year and 42% above Q2. Management cited AI-related hard-drive demand from all 3 major suppliers and annual industry exabyte growth above 20%. Smith explained that hard-drive test time is more closely related to capacity than unit volume.
The transmission mechanism is increasing storage capacity shipped and validated per drive. Higher-capacity products can support exabyte growth without requiring equivalent increases in drive units. For manufacturers, the financial benefit depends on capacity mix, pricing, yields, technology transitions, and cost per terabyte. For Teradyne, longer capacity-related testing requirements can increase equipment demand even when drive-unit growth is modest.
The involvement of all 3 suppliers makes the signal broader than a single manufacturer’s technology transition. However, Teradyne’s addition of a 3rd customer also increases its own addressable revenue. The 150% test-revenue increase must not be interpreted as an equivalent increase in industry demand or as evidence that Seagate or Western Digital gained market share.
Both companies had already reported the relevant quarter before this call: Western Digital on October 22 and Seagate on October 27. Their disclosures independently cited strong storage demand and pricing. Seagate also emphasized meeting exabyte requirements through areal-density gains while maintaining supply discipline. Teradyne adds evidence that production infrastructure is being expanded to support that demand.
Near-term catalysts are delivery against December-quarter guidance and subsequent customer capacity commitments, not an earnings beat inferred for an already completed reporting event. The longer-duration positive is that AI infrastructure requires persistent storage alongside compute and memory. The principal risk is confusing test-capacity expansion with disciplined industry supply: excess drive capacity could eventually weaken pricing even while exabyte demand continues to rise.
POWER SEMICONDUCTORS
AI POWER DEMAND IS DRIVING APPARENT INDUSTRIAL STRENGTH, MAKING EXPOSURE SELECTION MORE IMPORTANT THAN SECTOR LABELS (READ-THROUGH 9)
Affected company: Infineon Technologies (IFX: Germany). Direction: positive. Magnitude: high for its AI power franchise and moderate at the diversified group level.
Teradyne reported nearly 90% year-over-year growth in automotive and industrial SoC revenue, “driven primarily by power management demand increases for AI data center build-outs.” It expects product revenue in this category to exceed $600 million in 2026, versus less than $400 million in 2025. Management also identified 800-volt architectures and integrated voltage regulation as future growth drivers.
The precise mechanism is semiconductor content across power distribution, conversion, protection, and regulation. Higher rack power increases the value of efficiency, thermal performance, power density, and reliable switching. Architecture changes create new design and qualification requirements in addition to capacity demand.
Infineon is a verified beneficiary of this specific application rather than merely a company in the broad industrial semiconductor category. Its October 21 announcement described expanded NVIDIA collaboration on GaN-based conversion for 800-volt AI data centers, including 800-volt conversion to 50-volt, 12-volt, and 6-volt rails. Its August results had already identified AI data-center power as its most important growth driver.
The important qualification is that 800-volt distribution does not imply 800 volts at the processor. Multiple conversion stages remain necessary, and technology selection differs by stage. Benefits accrue to qualified devices and system solutions, not automatically to every GaN, silicon-carbide, or analog supplier.
The non-consensus implication is that Teradyne’s strong automotive and industrial category is not evidence of an equally strong recovery in vehicle production or conventional factory demand. Sector labels are increasingly obscuring end-market exposure. Infineon’s own automotive order commentary must be assessed separately rather than inferred from Teradyne’s aggregate category.
The next earnings update and subsequent 800-volt production qualifications are the near-term catalysts. The longer-duration opportunity is expanding semiconductor value within the data-center power chain. This is already an identified growth driver, so Teradyne supplies manufacturing-side confirmation rather than evidence of a newly awarded Infineon design win.
Report record
- Sector
- Information Technology
- Industry
- Semiconductors & Semiconductor Equipment
- Fiscal period end
- September 30, 2026
- Report date
- October 27, 2026
- Analysis
- 6464 words
- Read-throughs
- 3102 words
- Content fingerprint (PDF)
188c9936e32d- Content fingerprint (analysis)
a65a658eb9be- Content fingerprint (read-throughs)
224ea61e5441
Prepared from the company's earnings release and earnings call transcript. Figures as reported by the company. For information only. Not investment advice.
More from Teradyne, Inc.
No other reports yet.
More in Information Technology
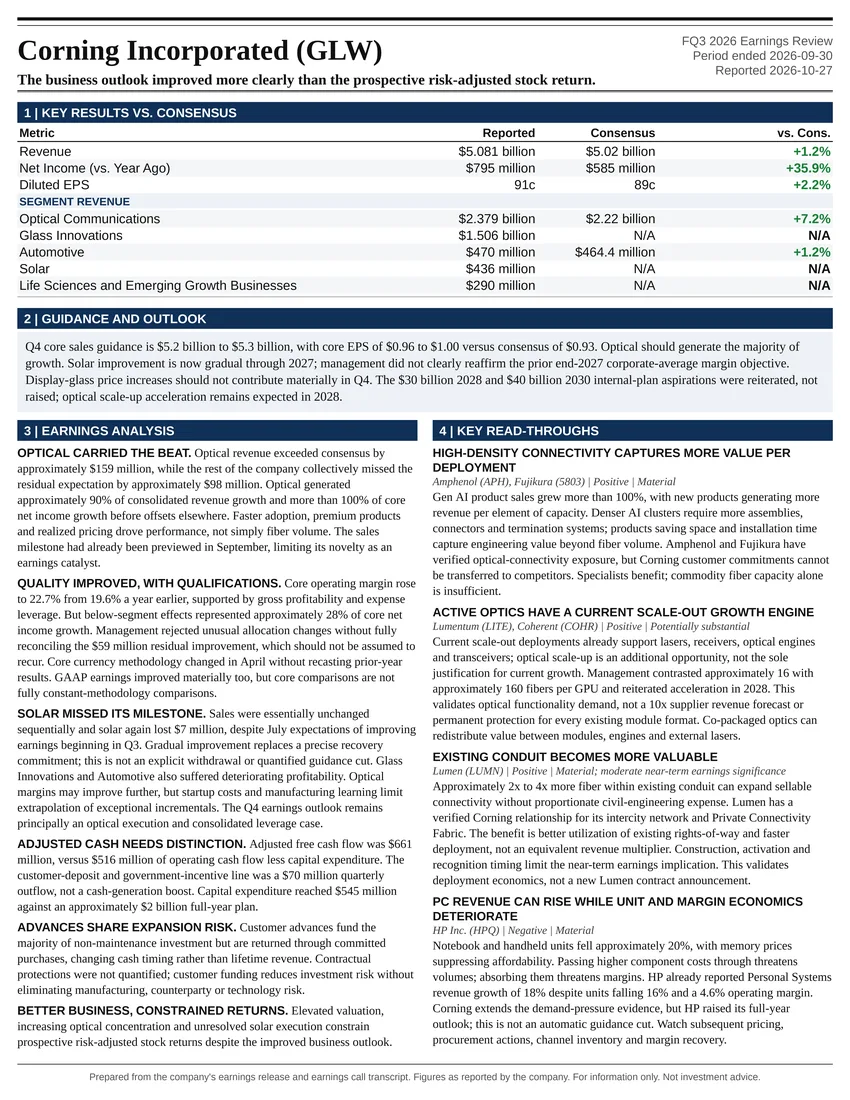
The business outlook improved more clearly than the prospective risk-adjusted stock return.
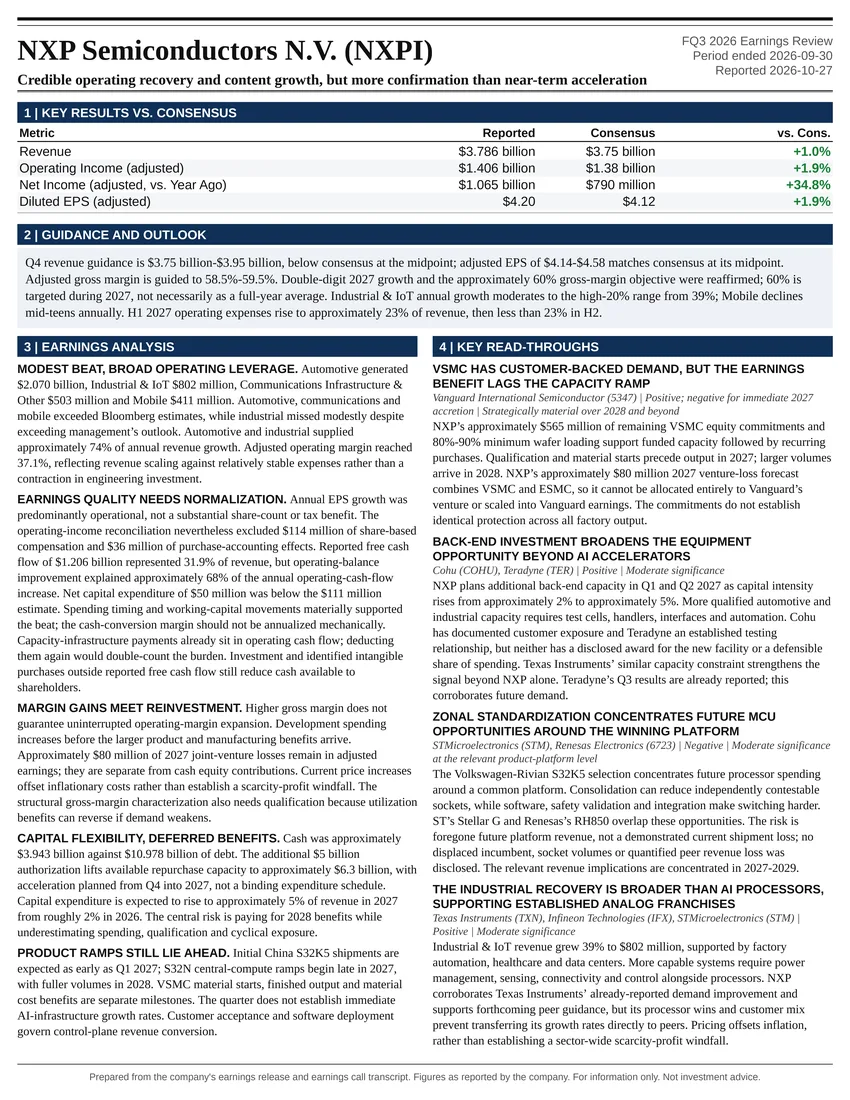
Credible operating recovery and content growth, but more confirmation than near-term acceleration
All Information Technology reports
Teradyne, Inc. on the Atlas Peak ticker page
Follow @AtlasPeakRes on X for new earnings reports as they publish.