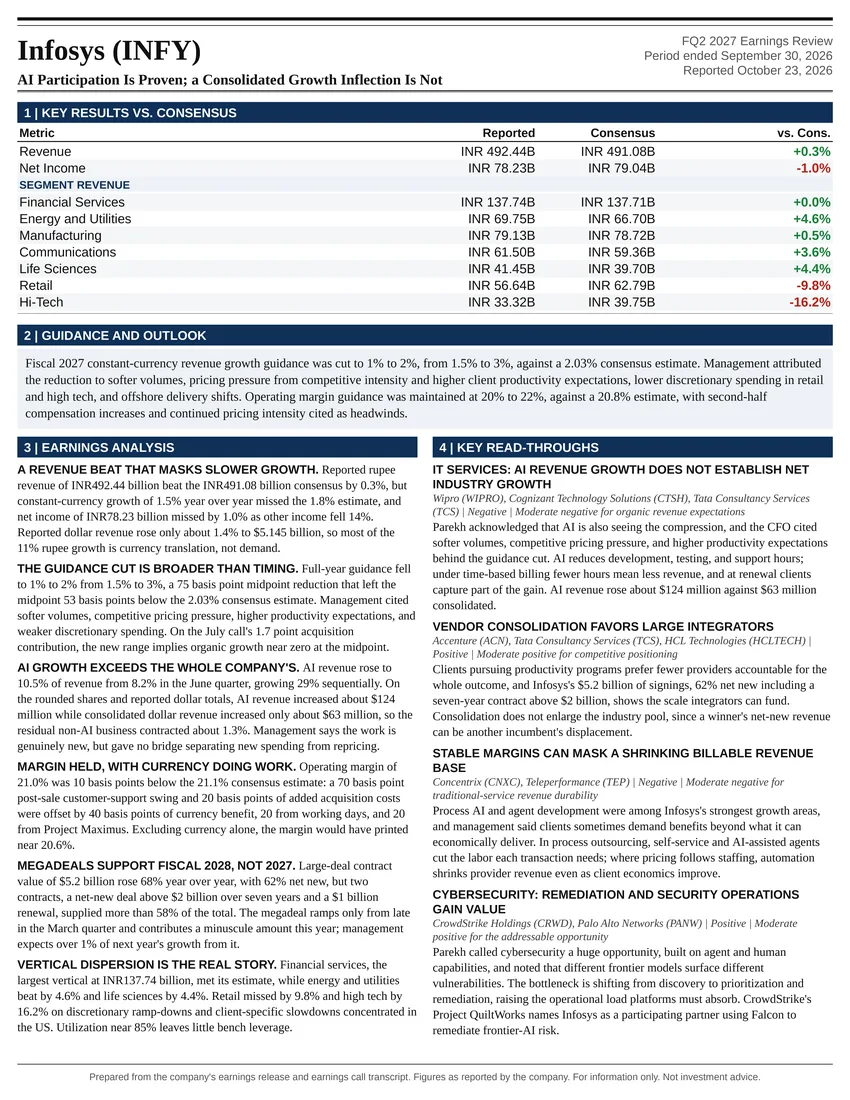
AI Participation Is Proven; a Consolidated Growth Inflection Is Not
Earnings Reports
Texas Instruments Incorporated FQ3 2026 Earnings Report
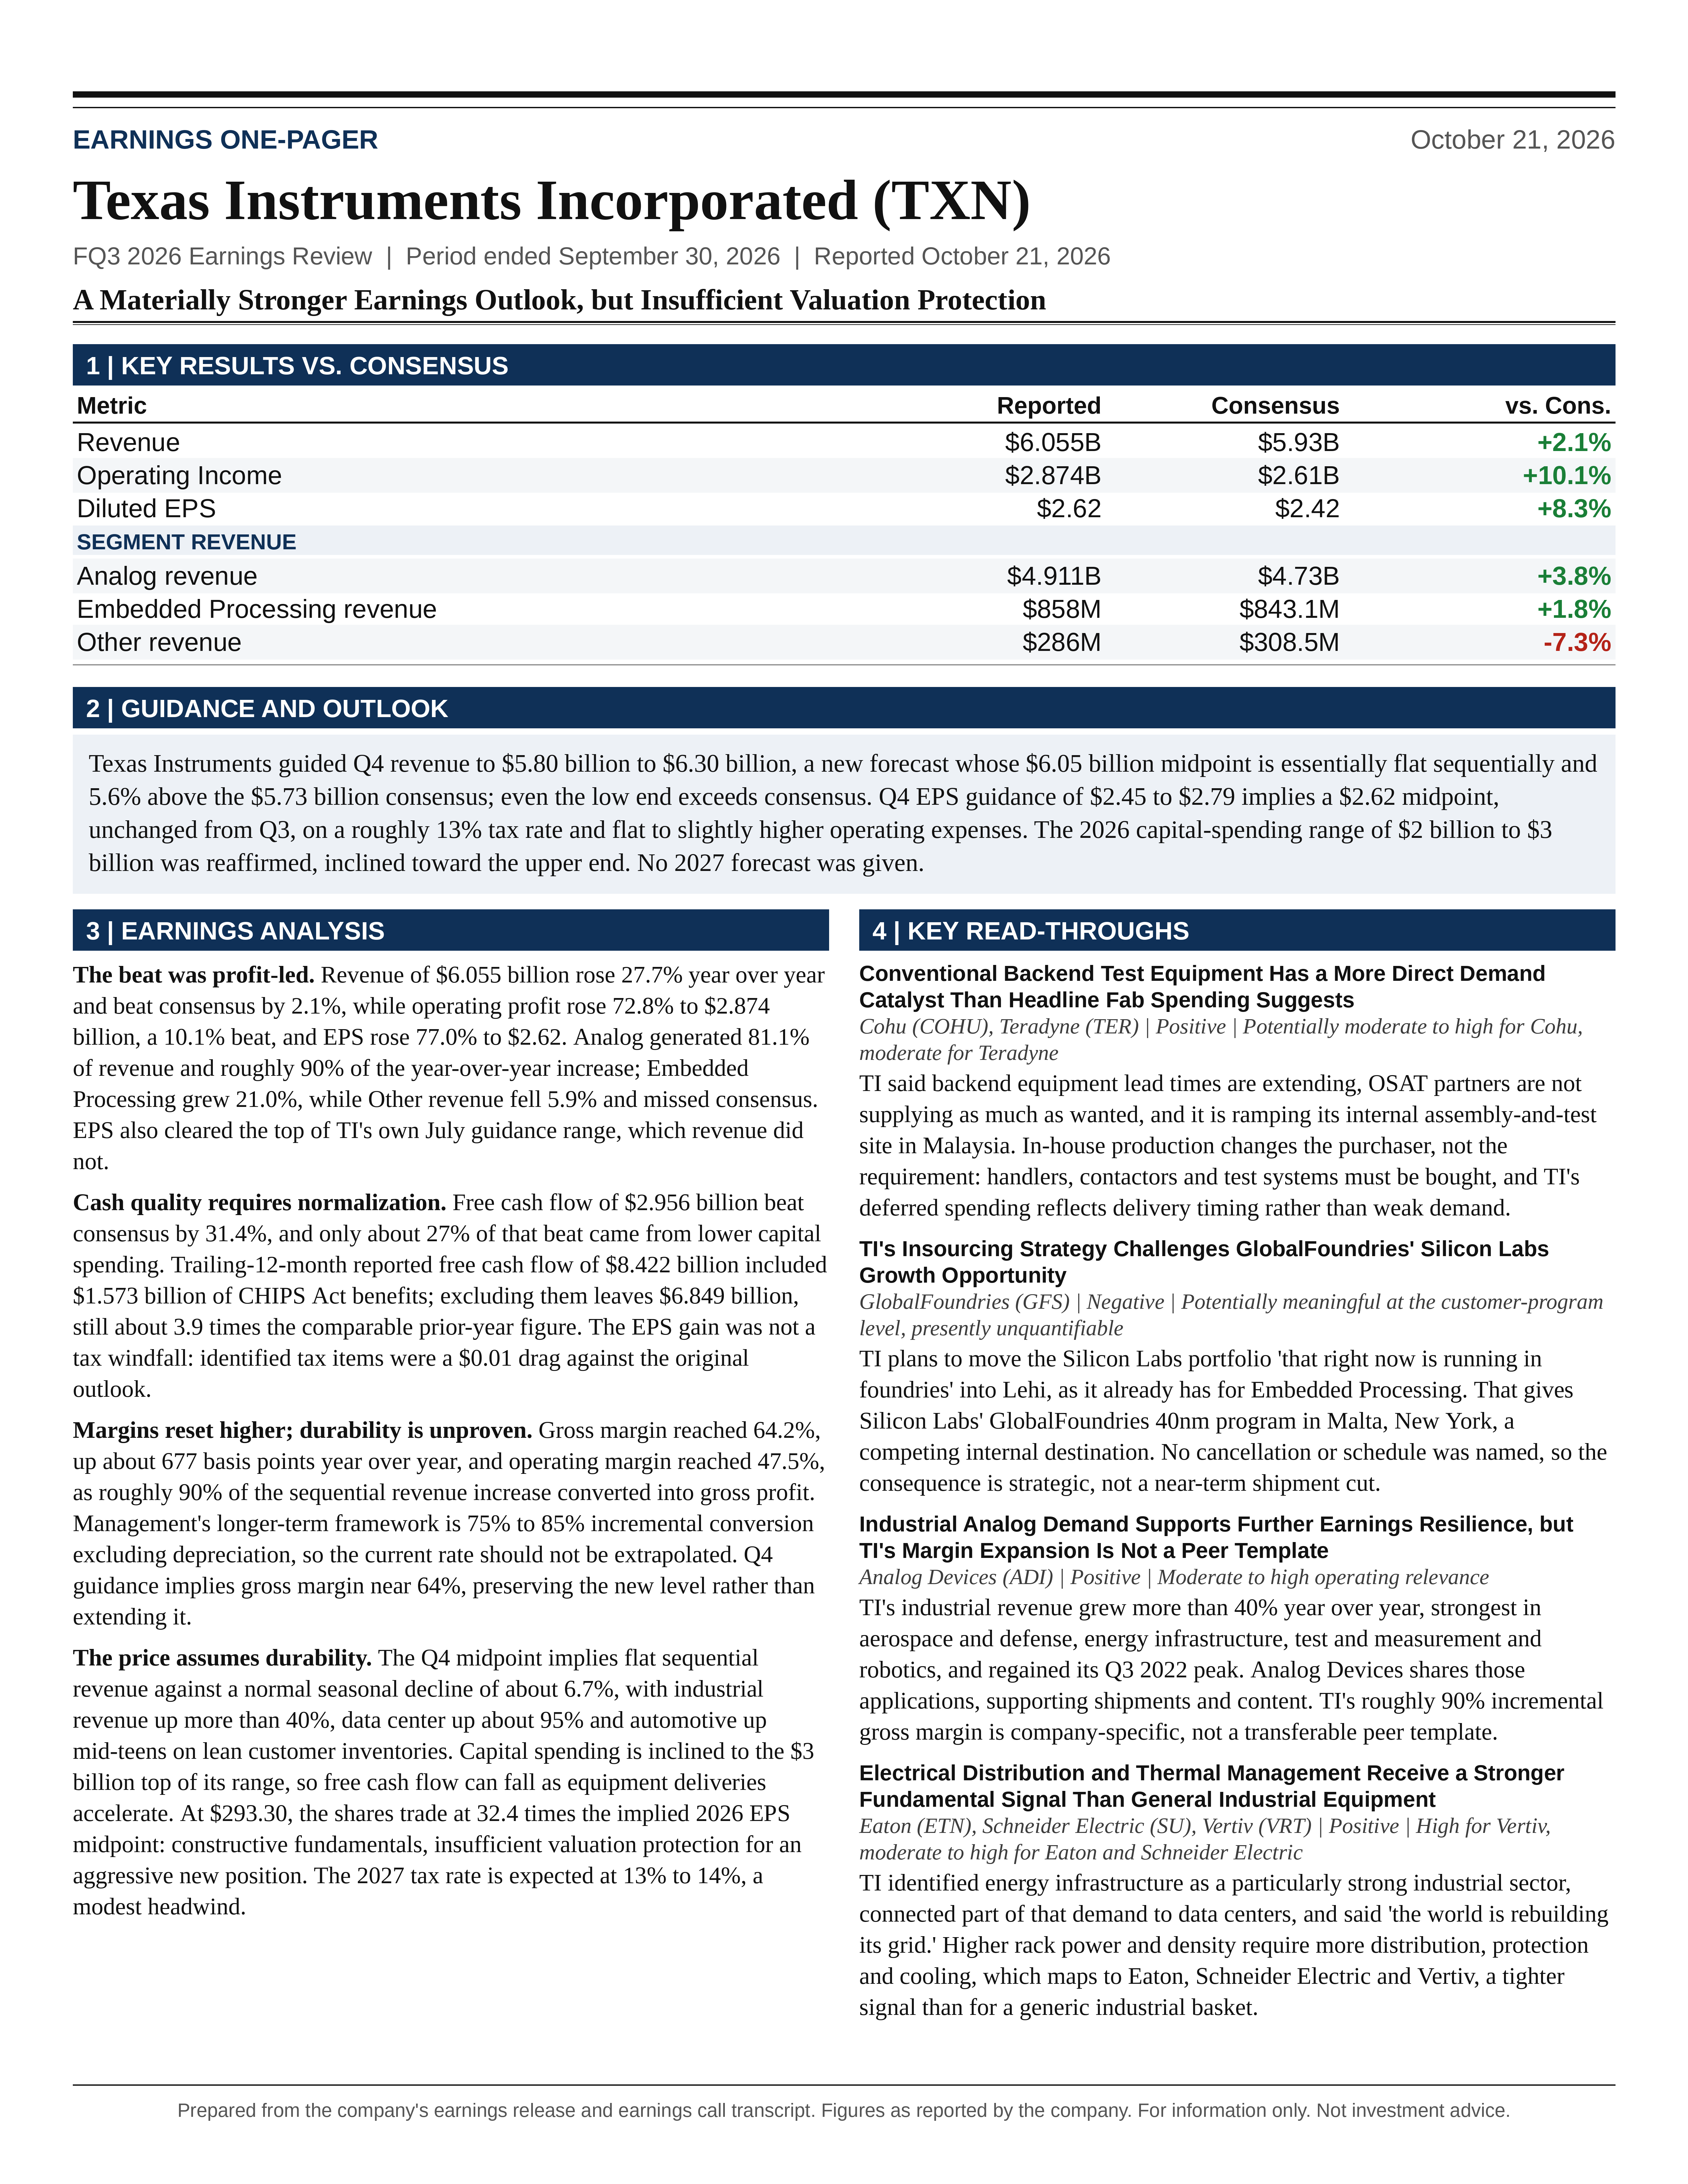
Texas Instruments Incorporated (TXN) FQ3 2026 earnings: A Materially Stronger Earnings Outlook, but Insufficient Valuation Protection. Full earnings analysis, key read-throughs, and the one-page exhibit from Atlas Peak Research.
Texas Instruments Incorporated (TXN)
Sector: Information Technology · FQ3 2026 · Period end September 30, 2026 · Reported October 21, 2026
Texas Instruments’ Q3 2026 earnings call supports a materially stronger earnings outlook, but a more qualified conclusion on prospective equity returns.
Download the one-page report (PDF)
View one-page exhibit
Download analysis (.md)
Download read-throughs (.md)
Post to X
One-Page Exhibit
Earnings Analysis
EXECUTIVE CALL SUMMARY: Texas Instruments Inc. (10/21/26)
Texas Instruments’ Q3 2026 earnings call supports a materially stronger earnings outlook, but a more qualified conclusion on prospective equity returns. Revenue growth accelerated, profitability expanded substantially faster than sales, and Q4 guidance indicated that industrial, automotive and data center demand should offset normal seasonal weakness. The manufacturing investments that depressed cash generation during the downturn are now supporting higher shipments, better factory utilization and selective pricing gains. The appropriate investment stance is HOLD at the $293.30 post-market price reported in the accompanying Bloomberg notice, with a constructive fundamental outlook but insufficient valuation protection for an aggressive new position.
The central development was the conversion of recovering demand into exceptional incremental profitability. Revenue of $6.055 billion increased 27.7% year over year and 10.8% sequentially. Operating profit increased 72.8% to $2.874 billion, and EPS increased 77.0% to $2.62. Gross margin reached 64.2%, while operating margin reached 47.5%. Approximately 90% of the sequential revenue increase converted into additional gross profit. These results demonstrate substantial operating leverage, although the unusually high conversion rate should not be extrapolated indefinitely.
The forward outlook was more consequential than the relatively modest revenue beat. Q4 revenue guidance of $5.80 billion to $6.30 billion implies a $6.05 billion midpoint, essentially unchanged sequentially and 5.6% above the $5.73 billion Bloomberg consensus. The entire guidance range exceeds that consensus estimate. Industrial demand strengthened, automotive customers increased production requirements without an evident inventory buildup, and data center revenue nearly doubled year over year. Nevertheless, management did not disclose a numerical book-to-bill ratio, quantify backlog duration, establish realized market-share gains, or provide a 2027 revenue forecast.
Cash generation improved substantially, but its composition matters. Trailing 12-month free cash flow of $8.422 billion included $1.573 billion of CHIPS Act cash benefits. Excluding those benefits produces $6.849 billion, still a substantial improvement but approximately 19% below the reported measure. Lower capital expenditures contributed materially to the improvement, and management remains inclined to increase equipment spending as demand develops. Consequently, the investment case should rest on sustainable operating earnings and cash generation across the cycle, rather than on annualizing the latest quarter’s unusually favorable combination of profitability and low capital spending.
Confidence is high that operating conditions improved materially during Q3. Confidence is more moderate that current pricing, incremental margins and demand growth can persist through 2027. The principal valuation question is whether TI can convert the current recovery into a durably higher earnings base before additional capital spending, acquisition financing and eventual cyclical normalization absorb part of the benefit.
QUARTERLY PERFORMANCE AND THE QUALITY OF THE BEAT
The company’s written financial schedules provide a more precise numerical baseline than the rounded figures used during the call. Revenue was $6.055 billion rather than the spoken $6.1 billion. Against the Bloomberg consensus of $5.93 billion, the revenue beat was $125 million, or 2.1%. EPS exceeded the $2.42 estimate by $0.20, or 8.3%, while operating profit exceeded the $2.61 billion estimate by approximately $264 million, or 10.1%. The disproportionate profit surprise indicates that the quarter was not simply a stronger shipment outcome. Profitability exceeded the level implied by the consensus revenue and operating-profit forecasts.
The comparison with TI’s own prior guidance reinforces that conclusion. On 07/22/26, management guided Q3 revenue to $5.65 billion to $6.15 billion and EPS to $2.23 to $2.57. Actual revenue exceeded the $5.90 billion midpoint by 2.6%, but remained $95 million below the upper bound. Actual EPS exceeded the $2.40 midpoint by 9.2% and the upper bound by $0.05. Earnings therefore exceeded the company’s forecast range even though revenue did not. This is stronger evidence of improved economic conversion than a revenue beat alone.
The earnings improvement was not created by an unexpectedly favorable tax item. Management identified a $0.01 EPS reduction relative to the original outlook. Moreover, Q2 EPS of $2.14 included a $0.05 benefit that had not been incorporated in the original guidance. Reported sequential EPS growth of 22.4% therefore occurred despite a less favorable comparison of the specifically identified tax-related departures from guidance. These disclosed items are not a complete normalization of the tax provision, but they establish that the headline sequential improvement was not dependent on a new tax windfall.
The recovery also accelerated across the year. Revenue increased 19% year over year in Q1, 23% in Q2 and 28% in Q3. Operating-profit growth accelerated from 37% to 48% to 73% over the same sequence. This progression is consistent with a manufacturing model in which incremental revenue increasingly absorbs a relatively fixed cost base as demand recovers.
Analog was the dominant earnings engine. Revenue of $4.911 billion increased 31.7% year over year and exceeded the $4.73 billion consensus by 3.8%. Analog represented 81.1% of consolidated revenue and generated approximately 90% of the company’s year-over-year revenue increase. Embedded Processing revenue of $858 million increased 21.0% and exceeded consensus by 1.8%. Other revenue of $286 million declined 5.9% and missed consensus by 7.3%. The company’s broader recovery is genuine, but its financial magnitude remains heavily dependent on Analog.
The distinction between business segments and end markets is important. Analog and Embedded Processing are reporting segments; industrial, automotive and data center describe customer applications. Growth in data center does not represent an additional revenue stream to be added to Analog and Embedded Processing. It is an end-market exposure within those businesses.
GUIDANCE, PRIOR EXPECTATIONS AND THE IMPLIED 2026 EXIT RATE
Q4 revenue guidance of $5.80 billion to $6.30 billion implies sequential performance ranging from a 4.2% decline to a 4.0% increase. The midpoint is only 0.1% below precise Q3 revenue. Using the rounded $6.1 billion call figure would incorrectly make the midpoint appear more negative. Relative to Q4 2025 revenue of $4.423 billion, the new range implies growth of 31.1% to 42.4%, with 36.8% growth at the midpoint.
That midpoint represents a meaningful further acceleration in year-over-year growth even though sequential revenue is approximately flat. The comparison partly benefits from the prior-year base, but the seasonal signal remains positive. Revenue declined approximately 6.7% sequentially in Q4 2025. Management is now forecasting a substantially stronger transition into year-end.
The $6.05 billion midpoint exceeds Bloomberg consensus by $320 million. Even the $5.80 billion lower bound is approximately 1.2% above consensus. This is a substantive revenue-guidance beat. The accompanying notice does not provide a Q4 EPS consensus, so an EPS-guidance beat against the market cannot be established from that source.
EPS guidance of $2.45 to $2.79 has a $2.62 midpoint, unchanged from Q3 and approximately 106% above Q4 2025 EPS of $1.27. Management expects operating expenses to be flat to slightly higher sequentially, acquisition charges to remain similar, and net other income and expense to be broadly unchanged. The Q4 tax assumption is approximately 13%, compared with an actual Q3 effective rate of approximately 13.5%.
Under approximately unchanged diluted shares, the disclosed expense assumptions and a 13% tax rate, the midpoint implies gross margin near 64%, broadly consistent with Q3. That is an analytical inference, not explicit gross-margin guidance. The important message is preservation of the higher profitability level rather than a forecast for another exceptional sequential margin expansion.
The Q4 outlook is a new forecast for that period, not an increase to a previously disclosed Q4 revenue range. The relevant comparisons are the current market consensus, normal seasonal behavior and the prior-year quarter. By contrast, the Q3 results can be compared directly with the Q3 guidance issued in July.
Combining reported results for Q1 through Q3 with the new Q4 range produces implied full-year 2026 revenue of $22.143 billion to $22.643 billion and EPS of $8.89 to $9.23. The midpoints are $22.393 billion and $9.06, representing approximately 26.6% revenue growth and 66.2% EPS growth over 2025. These figures are arithmetic implications of quarterly disclosures, not separately issued annual guidance.
The call did not provide a 2027 revenue or EPS forecast. References to capital requirements for 10% growth versus mid-teens growth describe planning scenarios, not a commitment to either outcome. Likewise, management’s expectation of strong robotics activity in 2027 and continued data center demand should not be interpreted as quantified consolidated guidance.
For 2027, the disclosed tax-rate expectation is 13% to 14%. Relative to the 13% Q4 assumption, the upper end would reduce after-tax earnings by approximately 1.1%, holding pretax income constant. This is a modest headwind, but it should be included rather than assuming the Q4 tax rate persists without change.
MARGINS, OPERATING LEVERAGE AND EARNINGS SUSTAINABILITY
Gross profit increased to $3.887 billion from $3.352 billion in Q2 and $2.723 billion in Q3 2025. Gross margin expanded to 64.2% from 61.4% sequentially and 57.4% a year earlier. The sequential increase of approximately 284 basis points is consistent with management’s rounded 280-basis-point commentary. The year-over-year improvement was approximately 677 basis points.
Julie Knecht attributed the improvement primarily to revenue: “our margin in third quarter were really driven by higher revenue.” She also identified pricing, factory loadings and product and end-market mix as contributors. This hierarchy matters. Pricing was favorable, but management did not characterize it as the principal driver of the quarter’s margin expansion.
The arithmetic illustrates the operating leverage. An additional $592 million of sequential revenue generated $535 million of additional gross profit, a 90.4% incremental gross margin. Operating profit increased by $564 million, implying 95.3% incremental operating-profit conversion. That latter figure also benefited from lower operating expenses and acquisition charges, and is particularly unsuitable as a sustainable long-term assumption.
Management’s intended longer-term framework is approximately 75% to 85% incremental gross-profit conversion excluding depreciation. The supplied transcript contains an apparent transcription error in the description of that measure. The economically relevant interpretation is ex-depreciation fall-through, not a 75% to 85% consolidated gross-margin target. Applying it requires explicit assumptions for depreciation, product mix, pricing and utilization.
The reported year-over-year operating-profit increase also benefits from an easier expense comparison. Q3 2025 included $85 million of restructuring charges and other items, while Q3 2026 included $7 million of acquisition charges. Removing those identified charges from both periods produces operating-profit growth of approximately 64.8%, compared with reported growth of 72.8%. Adjusted on this limited basis, operating margin increased from approximately 36.9% to 47.6%. The underlying improvement remains substantial, but not all of the reported acceleration represents recurring operating leverage.
The segment results provide a clearer view of where profitability improved. Analog operating profit reached $2.505 billion, with operating margin of 51.0%, versus 45.6% in Q2 and 39.8% a year earlier. Embedded Processing operating profit reached $227 million, with margin of 26.5%, versus 21.3% sequentially and 15.2% a year earlier. Embedded is therefore experiencing substantial margin recovery even though its absolute profitability remains materially below Analog.
Management also described roughly 10 percentage points of Embedded gross-margin improvement over approximately a year. That statement refers to gross margin and should not be confused with the separately calculated operating-margin improvement. Both support the conclusion that internal manufacturing transitions, volume recovery and portfolio development are improving Embedded economics, but their individual contributions were not quantified.
Other-segment operating profit increased from $69 million to $142 million despite declining revenue. That result is heavily affected by the prior-year restructuring charges. Adding back the identified charges in both periods produces approximately $149 million of current operating profit versus $154 million previously. The reported doubling in Other operating profit therefore does not indicate a comparable improvement in underlying demand.
Expense discipline amplified the recovery. R&D increased only 2.3% year over year to $530 million, while revenue increased 27.7%. Combined R&D and SG&A were $1.006 billion, approximately 16.6% of revenue, versus 20.6% a year earlier. This is favorable operating leverage rather than evidence of broad expense cuts. However, sustaining product breadth, developing application-specific data center products and integrating Silicon Labs could require higher spending as growth continues.
The major sustainability risk is reversibility. Higher utilization improves fixed-cost absorption, while pricing and favorable industrial mix strengthen gross profit. A demand slowdown can reverse all of these effects simultaneously. The current quarter demonstrates the strength of the operating model in recovery, but it also highlights the earnings sensitivity that would accompany another downturn.
INDUSTRIAL: A STRONG RECOVERY WITH IMPORTANT CYCLE QUALIFICATIONS
Industrial revenue increased more than 40% year over year and approximately 10% sequentially. This compares with approximately 30% year-over-year growth and approximately 10% sequential growth in Q2. The acceleration is therefore visible in the annual comparison, while the sequential growth rate remained consistently strong.
The most important historical reference was management’s statement that industrial revenue had only just returned to its Q3 2022 peak. Haviv Ilan said, “only now in Q3 2026, it reached the same level of revenue we had in Q3 2022.” This supports the argument that the recovery has not yet produced an obviously excessive aggregate revenue level relative to the prior cycle.
That comparison is supportive, but not conclusive evidence of an early-cycle position. Approximately flat nominal revenue across that interval could coexist with higher semiconductor content per system, weaker end-equipment units, changes in customer inventories, price changes and shifts in product mix. It is plausible that underlying unit activity remains below the prior peak. It is equally possible that selected submarkets have already reached elevated conditions while others remain depressed. Aggregate industrial revenue does not resolve that distribution.
Management identified aerospace and defense, energy infrastructure, test and measurement, and robotics as particularly strong areas. These markets offer different demand characteristics. Aerospace and defense can be supported by long-duration programs. Energy infrastructure benefits from grid investment and rising electricity requirements. Test and measurement can benefit from semiconductor manufacturing and data center investment. Industrial automation remains more directly exposed to factory capital spending and cyclical equipment demand.
Industrial also provides an important margin advantage. Ilan described it as “our best market in terms of diversity and longevity, but also in terms of margin.” A larger industrial contribution can therefore improve consolidated profitability independently of factory utilization. The interaction between stronger industrial demand and higher loadings is more important than either factor in isolation.
The claim of increasing semiconductor content is economically credible but remains unquantified in the call. Higher precision, additional sensing, greater power efficiency and more sophisticated control architectures can increase analog and embedded content. However, no consolidated measure of content growth, unit shipments or realized share gains was supplied. The durability of the industrial recovery therefore remains dependent on subsequent evidence rather than on the secular-content narrative alone.
DATA CENTER: MATERIAL SCALE, BROAD PRODUCT EXPOSURE AND HIDDEN CORRELATION
Data center revenue increased approximately 95% year over year and 20% sequentially. Management indicated that the market represented approximately 13% of Q3 revenue. Applied to precise consolidated revenue, that implies approximately $787 million of quarterly revenue and a $3.15 billion annualized run rate.
That calculation is materially above the approximately $2.5 billion run-rate figure mentioned in an analyst’s question. The difference may reflect an earlier period or a different averaging convention, but management’s current-quarter mix disclosure supports approximately $3.15 billion when annualized. This is a quarterly run rate, not a forecast for calendar-year data center revenue.
Using the rounded growth and mix disclosures, data center contributed approximately $383 million of the company’s $1.313 billion year-over-year revenue increase, or approximately 29%. Revenue outside the directly classified data center market still increased approximately 21%. TI’s recovery is therefore not solely dependent on direct data center shipments, even though that market is disproportionately important to incremental growth.
Management emphasized product breadth rather than dependence on a small set of specialized sockets. Ilan stated that TI sells approximately 10,000 generic part numbers into data center applications. That breadth spans foundational functions needed for power delivery, monitoring, telemetry, cooling, control and signal management. It provides numerous opportunities for incremental content as racks become more power-intensive and system architectures become more complex.
Mike Beckman summarized the exposure directly: “when there’s more power, there’s more opportunity for TI.” Higher power density and higher voltages can increase the need for control, sensing, protection and power-conversion components. Nevertheless, higher rack power does not translate mechanically into an equivalent percentage increase in TI revenue. Architecture changes can alter component counts, integration levels, supplier selection and pricing.
The distinction between existing foundational products and newer application-specific products is important. Management indicated that newer technologies are in early ramps at Sherman, but did not quantify their contribution. The current growth rate therefore does not require a large, already-realized contribution from those newer sockets. They represent an additional opportunity, subject to qualification, competitive performance and production execution.
The 13% directly reported exposure understates potential sensitivity to the broader data center investment cycle. Industrial energy infrastructure and test-and-measurement demand are also partly connected to data center construction and the production of GPUs and memory. These revenues should not be double-counted as direct data center sales, but their demand drivers can be correlated. A portfolio already concentrated in AI infrastructure may receive less diversification from TXN than its traditional industrial classification suggests.
The call did not support extrapolating another year of approximately 100% data center growth. When asked about continued doubling, management emphasized continued demand, portfolio expansion and additional sockets without committing to a growth rate. The relevant investment question is whether TI can outgrow the underlying infrastructure market through content and share gains, not whether the latest annual growth rate can persist unchanged.
Robotics remains a longer-duration opportunity rather than a sufficiently quantified near-term earnings driver. Management cited potential TI content of approximately $500 to $1,000 per humanoid system. At 100,000 systems, that would imply $50 million to $100 million of revenue before accounting for realized content, supplier share and production timing. The content opportunity is potentially attractive, but no shipment-volume forecast was supplied. High content per unit does not establish a material 2027 revenue contribution without commercial scale.
AUTOMOTIVE: BETTER DEMAND, LOW CUSTOMER INVENTORY AND MIX BENEFITS
Automotive revenue increased in the mid-teens year over year and approximately 10% sequentially. The annual growth rate was broadly consistent with Q2, while sequential growth improved from the upper-single-digit range. China and the U.S. remained the principal contributors to above-average regional growth.
Management explicitly rejected the interpretation that customers were broadly rebuilding inventories: “I don’t see any inventory build-up. On the contrary, I wish they had a little bit more.” The immediate operating picture is therefore one of customers responding to production requirements from relatively lean inventory positions, rather than a clearly identified stocking cycle.
That distinction is favorable for demand quality, but it is based on management’s customer visibility rather than a quantified industry inventory survey. Low starting inventories can also generate rapid replenishment orders when lead times lengthen. Sell-in growth can temporarily exceed end-market consumption even without excessive inventory accumulation. Production schedules, end-vehicle demand and subsequent order normalization remain important validation points.
The hybrid-electric and powertrain systems sector grew approximately twice as fast as automotive overall, supporting a favorable content-mix explanation. More electrified vehicles can increase semiconductor demand even without equivalent growth in total vehicle units. However, management’s suggestion that higher fuel prices supported EV demand was not accompanied by a quantified causal analysis and should not be treated as a demonstrated driver.
Chinese vehicle exports provide an additional opportunity because management described exported systems as having higher content and greater TI share. That exposure also introduces risks from trade policy, local-content requirements and changes in export-market access. Manufacturing outside China does not eliminate demand exposure to Chinese automakers or the commercial consequences of automotive trade restrictions.
PRICING, LEAD TIMES AND THE LIMITS OF THE MARKET-SHARE CLAIM
Pricing improved, but the change was more evolutionary than transformative. On the Q2 call, management had already indicated that price increases were being implemented, with benefits beginning in Q3 and continuing into Q4. It also indicated that Embedded pricing discussions would be more relevant to 2027. The Q3 call therefore confirms execution of a previously disclosed initiative rather than introducing a new pricing strategy.
The latest characterization remained restrained. Ilan described second-half pricing improvement as “not very significant for this year” and indicated that it was concentrated mainly in Analog. This is inconsistent with a thesis that most of the current revenue acceleration is price-driven. Volume recovery, end-market mix and content growth remain more important explanations.
The 2027 opportunity is potentially more meaningful because annual customer negotiations are underway. Customers seeking dependable supply may accept more favorable commercial terms in exchange for capacity support. Management expects to provide more information during the January earnings call. Until then, the magnitude, breadth, duration and net realization of prospective price increases remain unknown.
TI’s direct customer relationships can support more granular pricing than a uniform distributor-led increase. However, the economic value of higher quoted prices depends on customer mix, contractual protections, rebates, competitive responses and shipment realization. The call did not quantify contracted price increases or distinguish binding supply commitments from customer demand discussions.
Management’s supply argument is that little relevant analog capacity has been added outside China and Taiwan since the previous peak, while some foundry capacity is being redirected away from Analog. This supports the possibility of tighter supply for geographically diversified manufacturing. It remains management’s industry assessment rather than a fully documented capacity census.
Lead times increased modestly, but the company did not provide numerical levels. Questions about positive book-to-bill, longer-duration orders and backlog extension were answered qualitatively. No numerical book-to-bill ratio was confirmed. Rising demand is well supported by shipments and guidance, but the degree to which backlog offers additional visibility cannot be independently measured from the disclosures.
The same restraint applies to market share. Management stated that superior supply availability should create share opportunities, but acknowledged that realized gains could not yet be measured through the cycle. Ilan said, “that we cannot measure it yet.” Capacity readiness is an enabling condition for share gains, not proof that those gains have already occurred or will remain after supply normalizes.
CAPACITY, CAPITAL EXPENDITURES AND EXECUTION RISK
The principal strategic benefit of TI’s prior investment is that it has available cleanroom infrastructure into which additional equipment can be installed. This removes a major source of multi-year construction risk and provides more flexibility than starting new fabrication sites after demand has already strengthened.
However, available cleanroom space is not equivalent to immediately available output. Equipment must be delivered, installed, qualified and ramped. The call identified longer tool lead times, particularly in assembly and test, and less external capacity from outsourced partners than TI wanted. These constraints can affect shipment timing even if the company has no multi-year building shortage.
Management resisted describing equipment availability as a gating factor, reserving that terminology for missing cleanrooms and infrastructure. Economically, the distinction should not obscure the risk. A delayed test tool can defer revenue or constrain mix over a relevant investment horizon even if the underlying building is ready. The favorable conclusion is lower structural capacity risk, not the absence of operational bottlenecks.
The new Malaysia assembly-and-test site is particularly important because it provides an internal path to expand backend output. Management described it as TI’s largest assembly-and-test site and indicated that products are being qualified and ramped. Internal capacity can improve supply dependability and reduce reliance on constrained external providers, but its benefit remains linked to equipment availability and execution.
The 2026 capital-expenditure range remains $2 billion to $3 billion, with management still inclined toward the upper end. This is consistent with the July commentary. The new qualification is that actual spending depends partly on equipment deliveries. A lower realized number could therefore reflect timing constraints rather than a strategic decision to reduce investment.
Spending through Q3 totaled $1.653 billion, comprising $676 million in Q1, $514 million in Q2 and $463 million in Q3. Reaching $2 billion would require $347 million in Q4. Reaching $2.5 billion would require $847 million, while reaching $3 billion would require $1.347 billion. The upper-end inclination therefore implies a potentially substantial sequential increase in cash investment.
That creates an important earnings-versus-cash-flow distinction. Flat sequential revenue and EPS can coexist with lower free cash flow if equipment deliveries accelerate. Conversely, another quarter of unusually low capital spending would not automatically improve the long-term investment case if it reflected delayed capacity required to support demand.
For 2027, management did not provide a spending range. It reiterated that investment will depend on revenue levels and the growth capacity TI intends to support, with further detail expected during the February capital-management update. The absence of a number is material. The strongest demand scenario could require more spending and therefore produce less immediate free-cash-flow expansion than an earnings-only model would suggest.
FREE CASH FLOW: STRONG IMPROVEMENT, BUT NORMALIZATION IS ESSENTIAL
Quarterly cash flow from operations was $3.419 billion, and capital expenditures were $463 million, producing $2.956 billion of reported free cash flow. Operating cash flow was approximately 141% of net income. This is strong conversion, although it includes noncash depreciation addbacks and working-capital timing rather than representing cash collections from current-quarter earnings alone.
Free cash flow exceeded Bloomberg consensus by approximately $706 million, or 31.4%. Capital expenditures were approximately $188 million below consensus. On an arithmetic basis, lower spending explains roughly 27% of the free-cash-flow beat, assuming comparable consensus definitions. The majority of the surprise therefore cannot be attributed solely to underspending on equipment.
The trailing 12-month reconciliation is essential. Operating cash flow of $9.896 billion less capital expenditures of $2.578 billion equals $7.318 billion. TI then adds $1.104 billion of separately classified CHIPS Act proceeds to arrive at reported free cash flow of $8.422 billion. Operating cash flow itself already includes $469 million of investment-tax-credit benefits used to reduce income taxes payable.
Total trailing CHIPS Act cash benefits were therefore $1.573 billion, consistent with management’s rounded $1.6 billion statement. Excluding both the separately classified proceeds and the tax credits embedded in operating cash flow produces $6.849 billion of free cash flow. The corresponding margin is approximately 33.0% of revenue, compared with the reported 40.6%.
These incentives are real economic benefits, not fictitious earnings. They reduce the effective cost of qualified investment and improve shareholder value. Nevertheless, they are linked to investment timing, qualification and payment schedules. They should be separated from recurring operating cash generation when assessing sustainable cash yield.
The improvement also remains substantial after removing incentives. Comparable prior-year free cash flow excluding the disclosed CHIPS benefits was approximately $1.778 billion. The current $6.849 billion figure is approximately 3.9 times that level. The recovery is therefore not primarily a subsidy story.
The $6.007 billion increase in reported trailing free cash flow can be decomposed into approximately $2.832 billion of additional operating cash flow excluding the embedded tax-credit change, $2.239 billion of lower capital expenditures and $936 million of additional total CHIPS benefits. Approximately 47% of the improvement came from operating cash generation excluding those tax-credit changes, 37% from lower capital spending and 16% from increased incentives.
Quarterly comparisons also require care. Q2 free cash flow of $2.738 billion included $850 million of total CHIPS cash benefits. Q3 free cash flow of $2.956 billion included only $79 million. Excluding those benefits, quarterly free cash flow increased from approximately $1.888 billion to $2.877 billion, or approximately 52%. The modest reported sequential increase therefore understates the improvement in cash generation excluding incentives.
This distinction strengthens the assessment of the quarter while limiting extrapolation of the trailing headline. Current operating cash generation improved sharply, but the trailing free-cash-flow level still benefits from a large reduction in investment relative to the prior period. Sustaining free cash flow as spending normalizes is the next important test.
INVENTORY, CAPITAL RETURNS AND BALANCE-SHEET CAPACITY
Inventory increased $67 million sequentially to $4.672 billion, while inventory days declined from 196 to 194. The small reduction in days should not be interpreted in isolation as weak inventory progress. Inventory days are measured against cost of revenue, which increased only approximately 2.7% sequentially because gross margin expanded. Revenue increased much faster than the cost denominator.
The composition is also informative. Finished goods declined from $1.731 billion to $1.693 billion, while work in process and raw materials increased. This is consistent with some finished inventory supporting shipments while manufacturing activity increases. It does not prove that every product family is balanced or that all inventory is readily deployable.
High aggregate inventory can coexist with specific customer shortages. Automotive qualifications, package requirements, specialized devices and production mix prevent a broad inventory balance from being interchangeable across applications. The investment benefit of TI’s inventory strategy is faster response across a large catalog, not immunity from product-level constraints.
Cash and short-term investments totaled $8.142 billion. Against management’s disclosed $13.65 billion of debt principal, net debt was approximately $5.5 billion. The weighted-average coupon of 4.11% indicates a manageable existing interest burden, and the company repaid $500 million during the quarter.
The dividend increased 7% to $1.52 per quarter, or $6.08 annualized. At the supplied $293.30 price, the indicated yield is approximately 2.1%. The increase represents the company’s 23rd consecutive annual dividend increase and signals confidence in cash generation. It also establishes a recurring cash commitment that must be funded alongside manufacturing investment and acquisition requirements.
Trailing dividends were $5.174 billion, while repurchases were $636 million. Total cash returned was $5.810 billion, approximately 69% of reported free cash flow and approximately 85% of free cash flow excluding all disclosed CHIPS benefits. Management’s commitment to return all free cash flow over time does not mean that distributions must equal each individual quarter’s cash generation.
Repurchases remain relatively modest. Q3 buybacks were $48 million, and diluted weighted-average shares increased from 914 million to 921 million year over year. The earnings recovery is therefore operational rather than buyback-driven. This also matters for the stated objective of free-cash-flow-per-share growth: strong aggregate cash generation does not automatically translate into equivalent per-share growth if dilution persists.
SILICON LABS AND THE NEXT STAGE OF EMBEDDED PROCESSING
The Silicon Labs acquisition is relevant to the quarter because it links TI’s unused internal manufacturing capacity with a potential future portfolio expansion. Management expects the acquired products, currently manufactured externally, to transition into Lehi over time. This could improve utilization, reduce manufacturing costs and deepen the embedded wireless portfolio.
The original transaction announcement valued Silicon Labs at approximately $7.5 billion of enterprise value, with an all-cash offer of $231 per share. Closing was expected in the 1st half of 2027, subject to approvals and customary conditions. The July call reaffirmed that timing and the intention to use cash on hand and debt. The current call discussed the manufacturing plan but did not provide a new closing timetable or a revised financial contribution.
The original announcement targeted approximately $450 million of annual manufacturing and operating synergies within 3 years after closing. That amount would equate to roughly $0.42 of annual after-tax EPS at a 13.5% tax rate and approximately 930 million diluted shares, before financing costs, integration expenses and other offsets. It should not be inserted into 2027 earnings as though fully realized immediately after closing.
The transaction was described as EPS-accretive, excluding transaction-related costs, in the 1st full year after closing. That does not establish GAAP accretion in the closing year. Purchase accounting, amortization, financing costs and implementation timing can create substantial differences between the strategic economics and reported EPS.
The balance sheet appears capable of supporting the transaction, but current liquidity is not entirely surplus capital. Acquisition funding may compete with repurchases, debt reduction and capacity investment. The enterprise-value headline is also not identical to the final closing cash requirement. A complete post-acquisition model requires the financing mix, acquired cash and debt, closing date and integration schedule.
VALUATION AND PROBABILITY-WEIGHTED INVESTMENT IMPLICATIONS
The Bloomberg notice reported a 3% post-market rise to $293.30 on 91,136 shares. That is an event-price reference, not evidence of a durable repricing under normal trading liquidity. Nevertheless, it provides a consistent valuation anchor for assessing the quarter’s implications.
At $293.30, TXN trades at approximately 32.4 times the implied 2026 EPS midpoint of $9.06. Annualizing the Q4 EPS midpoint produces $10.48, implying approximately 28.0 times that exit-rate earnings level. The second measure is not a 2027 forecast, but it demonstrates that continued earnings growth is already required to produce a more moderate forward multiple.
Using approximately 914 million basic shares as an equity-value approximation produces a market capitalization near $268 billion. The reported trailing free-cash-flow yield is approximately 3.1%, falling to approximately 2.6% after removing the disclosed CHIPS cash benefits. These are equity cash-flow yields and do not incorporate incremental acquisition funding or a new capital-spending cycle.
The valuation therefore requires more than a successful recovery quarter. At 25 times earnings, the current price requires approximately $11.73 of EPS, about 12% above the annualized Q4 midpoint. At 27 times earnings, it requires approximately $10.86. The operating trajectory can support those outcomes, but they are not yet secured by management guidance.
An illustrative 12-month scenario framework produces a positive but modest expected return from the supplied price. These scenarios are analytical assumptions, not management forecasts or consensus estimates. They exclude Silicon Labs’ acquired earnings, transaction-specific charges, synergies and incremental acquisition financing. They use a 13.5% tax rate, approximately 930 million diluted shares and a small allowance for earnings allocated to participating securities.
The base case, assigned a 50% probability, assumes 2027 revenue of $26.5 billion, gross margin of 65.5%, operating expenses of $4.2 billion and net nonoperating expense of $300 million. Revenue would increase approximately 18% over the implied 2026 midpoint. These assumptions produce approximately $11.9 of EPS. Applying an analyst-selected 27 times multiple yields a value near $321, or approximately 12% total return including the current annualized dividend. This case requires sustained industrial recovery, slower but still strong data center growth, and some further margin improvement.
The bull case, assigned a 25% probability, assumes revenue of $29 billion, gross margin of 67%, operating expenses of $4.35 billion and the same net nonoperating expense. EPS would approach $13.7. At 29 times earnings, the resulting value is approximately $396, implying approximately 37% total return including the dividend. This requires substantial demand continuation, successful equipment ramps, favorable pricing and content gains, and no meaningful deterioration in industry ordering behavior.
The bear case, assigned a 25% probability, assumes revenue of $22.5 billion, gross margin of 60% and operating expenses of $4.1 billion. EPS would be approximately $8.4. At 22 times earnings, value would be approximately $185, implying a total-return decline of approximately 35% including the dividend. Annual revenue would be roughly flat against 2026, but materially below the Q4 annualized exit rate. The downside therefore does not require an extreme collapse in annual sales; lower utilization and multiple compression are sufficient.
The probability-weighted value is approximately $306 before dividends, producing an expected total return of approximately 6% over 12 months. The assumptions and probabilities are judgmental and carry limited forecasting confidence. Their principal implication is that the observed operating improvement does not automatically create attractive risk-adjusted upside at the current price. The downside from a cyclical disappointment remains substantial relative to the base-case return.
Earnings sensitivity is high. At an illustrative $24.2 billion annual revenue base, a 1% revenue change converting at an 80% incremental margin would change annual EPS by approximately $0.18 after tax, before additional depreciation or expense responses. A 100-basis-point gross-margin change would alter EPS by approximately $0.23. A broadly realized 1% price increase with little incremental cost could have a similar effect, but no such quantified price increase has been guided.
CATALYSTS, POSITIONING AND THESIS INVALIDATION
The principal near-term catalyst is the January 2027 earnings call. It should clarify whether Q4 revenue and approximately 64% gross margin were sustained, provide Q1 demand expectations and offer the first meaningful assessment of annual pricing negotiations. The February capital-management update is equally important for valuation because it should define the spending needed to support the next growth phase.
Additional catalysts include continued Malaysia assembly-and-test ramps, progress at Lehi, commercial adoption of newer data center products and Silicon Labs approval and closing developments. These events affect different parts of the model. Strong shipment demand supports earnings, while faster equipment installation can initially reduce cash flow. Favorable acquisition progress may improve long-term strategic value while increasing near-term funding requirements.
The most important adverse signal would be weakening underlying demand accompanied by rising lead times or backlog, because that combination could indicate precautionary ordering rather than sustainable consumption. Other material warning signs would include shipment reductions after customers secure supply, persistent finished-goods accumulation, margin compression despite stable revenue, or broad pricing reversals.
A Q4 revenue outcome below $5.80 billion, absent an identifiable timing explanation, would directly contradict the current guidance. Gross margin falling below approximately 62% while revenue remains near $6 billion would undermine the assumption that much of the Q3 profitability improvement is sustainable. These are analytical review thresholds, not company guidance.
The portfolio exposure should be treated as a combination of analog-cycle recovery, industrial capital spending, automotive semiconductor content and AI-infrastructure demand. It is not a defensive dividend position merely because the company has a long dividend history. Its operating leverage creates cyclical earnings risk, while the valuation adds sensitivity to discount rates and investor willingness to capitalize peak earnings.
For portfolios already concentrated in AI semiconductors, data center equipment or electrical infrastructure, TXN adds more correlated demand exposure than the 13% directly reported data center share suggests. For portfolios concentrated in fabless suppliers, TI offers a different manufacturing model and supply-position advantage, but not necessarily lower sensitivity to the capital-spending cycle. Actual portfolio concentration cannot be quantified without holdings and factor exposures.
No new full-sized position is justified at the supplied event price under the illustrative return framework. A more attractive entry would be approximately $255 to $265, provided subsequent disclosures preserve the earnings thesis. At approximately $260, the same probability-weighted framework would imply about 20% total return. That entry range is a valuation condition, not a technical-support claim.
A new position at that lower valuation could begin at 0.5% to 1.0% of portfolio NAV, with a maximum size of 1.5% only after pricing, spending and demand durability are better established. A 10% loss threshold from entry would correspond to approximately 5 to 10 basis points of portfolio loss at the initial sizing, before gaps or slippage. A fundamental breach should trigger exit independently of whether that price threshold has been reached. For existing holdings retained near the event price, a 10% decline to approximately $264 should trigger mandatory reassessment rather than automatic averaging down.
The overall conclusion is that TI delivered a high-quality operating quarter and a meaningful upward signal for near-term earnings. The investment case has shifted from whether prior manufacturing investment would produce benefits to how much of the current benefit can persist through the cycle. The unresolved issues are 2027 pricing realization, equipment-driven cash requirements, acquisition economics and the durability of demand beyond recovery. Those questions favor retaining controlled exposure rather than paying aggressively for an unqualified continuation of Q3 conditions.
SOURCE BASIS
The analysis uses the 10/21/26 earnings-call transcript and accompanying Bloomberg earnings notice, supplemented by Texas Instruments’ Q3 2026 financial release, Q2 2026 financial release and call commentary, Q1 2026 financial release, Q4 2025 financial release, 02/04/26 Silicon Labs acquisition announcement and 06/02/26 CFO-transition announcement. Precise written financial figures take precedence over rounded spoken figures. Scenario estimates, valuation multiples, probabilities and portfolio-risk thresholds are analytical assumptions rather than company guidance.
COMPANY EMPLOYEES ON THE CALL
- Haviv Ilan, Chairman, President and Chief Executive Officer. - Julie Knecht, Senior Vice President and Chief Financial Officer. The transcript’s participant header describes her as incoming, but her appointment became effective on 08/01/26. - Mike Beckman, Vice President and Head of Investor Relations.
RESEARCH ANALYSTS ON THE CALL
- Joe Moore, Morgan Stanley. - Harlan Sur, JPMorgan Chase & Co. - Stacy Rasgon, Bernstein. - Chris Caso, Wolfe Research. - Joe Quatrochi, Wells Fargo. - Tore Svanberg, Stifel. - William Stein, Truist Securities. - Nabeel Aziz, Rothschild & Co. Redburn. - Vijay Rakesh, Mizuho Securities.
Key Read-Throughs
KEY READ-THROUGHS FROM TEXAS INSTRUMENTS’ Q3 2026 EARNINGS CALL
Texas Instruments’ results indicate that the semiconductor recovery is broadening beyond AI infrastructure, while supply constraints are shifting toward equipment availability, assembly and test, and specific automotive components. The most actionable positive implications concern conventional semiconductor test equipment, industrial analog devices, automotive and embedded semiconductors, and the electrical infrastructure supporting higher computing power density. The clearest company-specific negative implication is the potential displacement of external foundry manufacturing as TI internalizes Embedded Processing and, eventually, Silicon Labs production. An important portfolio-level qualification is that industrial, electrical and test-equipment exposures are increasingly correlated with the same data center investment cycle. The conclusions below distinguish confirmed operating signals from inferred company effects. Magnitude refers to business and earnings relevance, not a forecast stock-price reaction.
SEMICONDUCTOR MANUFACTURING AND EQUIPMENT
CONVENTIONAL BACKEND TEST EQUIPMENT HAS A MORE DIRECT DEMAND CATALYST THAN HEADLINE FAB SPENDING SUGGESTS (READ-THROUGH 1)
Affected companies: Cohu (COHU: United States) and Teradyne (TER: United States). Direction: positive. Magnitude: potentially moderate to high for Cohu’s cyclical equipment demand and moderate for Teradyne’s more diversified business. Confidence is high in the industry demand signal; specific supplier awards and revenue contributions remain undisclosed.
The supporting evidence is unusually direct. TI said equipment lead times are extending “especially on the backend side,” acknowledged that “we are not getting as much as we wanted from our OSAT partners,” and described rapidly ramping its largest internal assembly-and-test facility in Malaysia. Management also stated that the rate of capacity expansion depends on how quickly tools arrive. This identifies a concrete manufacturing constraint and a corresponding equipment requirement, rather than merely expressing a general intention to increase semiconductor capacity.
Cohu’s handlers, contactors and test systems address production requirements across analog, power, microcontrollers and automotive devices. Teradyne’s analog and mixed-signal test platforms address overlapping requirements. Higher device output increases installed-equipment utilization; sustained utilization and product-mix requirements subsequently support additional systems, upgrades and consumables. Bringing assembly and test in-house does not eliminate equipment demand. It changes the purchaser from an outsourced service provider to the integrated manufacturer. This makes equipment suppliers a cleaner expression of TI’s capacity expansion than assuming outsourced assembly-and-test companies capture an unchanged share of the incremental production.
The less obvious implication is that low current capital expenditure is not necessarily a negative demand signal for these vendors. TI spent $463 million in Q3 but retained its $2 billion to $3 billion annual range and its inclination toward the upper end, subject to delivery timing. Equipment constraints can defer recognized spending while leaving underlying demand intact. Furthermore, expanding existing cleanrooms directs incremental investment toward productive equipment rather than requiring another large construction phase.
The near-term trading catalyst is evidence of stronger analog and automotive test bookings, utilization and delivery schedules in the equipment companies’ next earnings updates. The fundamental transmission should develop over the next 2 to 6 quarters as equipment is installed and production expands. TI’s February capital-management update is an additional catalyst. Neither the call nor the supporting product disclosures establish which supplier wins particular orders, so TI’s spending should not be converted into precise company revenue forecasts.
TI’S INSOURCING STRATEGY CHALLENGES GLOBALFOUNDRIES’ SILICON LABS GROWTH OPPORTUNITY, INCLUDING ITS U.S. MANUFACTURING PROPOSITION (READ-THROUGH 2)
Affected company: GlobalFoundries (GFS: United States). Relevant customer and prospective acquirer: Silicon Laboratories (SLAB: United States) and Texas Instruments (TXN: United States). Direction: negative for the probability-weighted durability of external Silicon Labs wafer demand. Magnitude: potentially meaningful at the customer-program level, but presently unquantifiable and not sufficient to establish a material near-term consolidated earnings reduction.
TI explicitly connected its manufacturing capacity to the acquisition: Lehi would support “the transitioning of the portfolio that right now is running in foundries” into internal production. Management separately confirmed that substantial existing Embedded Processing manufacturing had already been transferred from foundries into Lehi. The strategic direction is therefore supported by both an existing operational precedent and an identified future portfolio.
The company-specific connection is established by Silicon Labs’ 10/30/25 announcement expanding its GlobalFoundries partnership. That agreement contemplated manufacturing wireless system-on-chips on GlobalFoundries’ 40nm ultra-low-power platform in Malta, New York, with production ramping over subsequent years. TI’s plan introduces a competing internal destination for manufacturing investment that otherwise could have supported that external foundry relationship.
The transmission mechanism is lower external wafer purchases or a smaller future program ramp relative to the standalone Silicon Labs trajectory. Lost incremental wafer demand would reduce utilization opportunities and fixed-cost absorption at the relevant foundry capacity. Importantly, this is not simply an offshore-to-U.S. reshoring story. GlobalFoundries’ announced program is already U.S.-based. TI’s advantage in this instance is vertical integration and ownership of manufacturing economics, not merely geographic location.
The near-term consequence is strategic rather than a verified shipment reduction. Acquisition closing, product redesign, process portability, qualification requirements and contractual obligations govern the eventual transition. The call did not identify GlobalFoundries by name, announce cancellation of its agreement, or provide a migration schedule for individual products. Those limitations preclude an immediate revenue-cut assumption.
The longer-duration implication is a less secure growth opportunity over the post-acquisition integration period. The actionable distinction is that geographically dependable foundry capacity remains valuable, but does not protect an external manufacturer from a customer becoming vertically integrated. This is a targeted negative read-through for the disclosed Silicon Labs opportunity, not a blanket bearish conclusion on GlobalFoundries’ entire portfolio.
INDUSTRIAL AND AUTOMOTIVE SEMICONDUCTORS
INDUSTRIAL ANALOG DEMAND SUPPORTS FURTHER EARNINGS RESILIENCE, BUT TI’S MARGIN EXPANSION IS NOT A PEER TEMPLATE (READ-THROUGH 3)
Affected company: Analog Devices (ADI: United States). Direction: positive. Magnitude: moderate to high operating relevance because industrial applications are central to the business. The incremental information is strongest for demand breadth and persistence, rather than for establishing a previously unrecognized recovery.
TI reported industrial revenue growth above 40% year over year and approximately 10% sequentially, alongside 32% Analog growth. Management highlighted aerospace and defense, energy infrastructure, test and measurement, and robotics, while also describing recovery in industrial automation. This combination argues against interpreting TI’s results solely as an AI-specific surge or an isolated benefit from company-specific manufacturing capacity.
Analog Devices participates in many of the same high-performance signal-chain, sensing, conversion, control and power-management applications. Stronger customer production requirements support semiconductor shipments, while increasing precision, connectivity and power efficiency can increase content per system. The mechanism therefore combines cyclical unit recovery with structural content growth. Industrial customers’ long product lifetimes and qualification requirements can help successful designs retain revenue through multiple production years.
The most useful historical observation is that TI’s industrial revenue had only just regained its Q3 2022 peak. That makes the current growth rate less indicative of an obviously stretched aggregate revenue level than the headline increase might suggest. However, this timing cannot be mapped directly onto Analog Devices. Product mix, customer inventories and exposure to faster-growing submarkets differ, and Analog Devices had already reported strong industrial performance before this call. The signal is confirmation of continued breadth, not proof that every supplier is at the same point in the cycle.
The near-term catalyst is Analog Devices’ next order and guidance update, particularly whether demand remains broad across industrial applications and whether customer inventory normalization continues. Over the next 6 to 18 months, higher volumes and favorable industrial mix should support operating leverage.
The principal qualification is competitive. TI’s supply availability could allow it to capture incremental sockets or emergency orders. Moreover, TI’s approximately 90% sequential incremental gross margin includes company-specific utilization, manufacturing and mix effects. The high-conviction positive inference concerns the addressable demand environment; applying TI’s exact margin progression or growth rate to Analog Devices would overstate the evidence.
THE EMBEDDED RECOVERY CAN EXTEND THE SEMICONDUCTOR EARNINGS CYCLE AFTER ANALOG’S INITIAL REBOUND (READ-THROUGH 4)
Affected company: Microchip Technology (MCHP: United States). Direction: positive. Magnitude: potentially moderate to high for earnings sensitivity, conditional on Microchip’s own inventory and utilization trajectory.
TI reported Embedded Processing revenue growth of 21% and said the embedded recovery was “maybe a year later than Analog.” Management noted that its Embedded business peaked in 2023, compared with 2022 for Analog, and described substantial recent improvement in Embedded gross margins. This is evidence that the recovery is progressing through different semiconductor categories at different speeds.
Microchip’s microcontrollers and related embedded products participate in industrial, automotive and connected-device applications. Improving equipment production increases demand for control and interface functionality, while customer inventory normalization can allow semiconductor purchases to recover faster than end-equipment units for a period. Higher shipments can also improve factory utilization and reduce the drag from underabsorbed manufacturing costs.
The actionable implication is that industrial semiconductor exposure need not be treated as a single synchronized trade. A later embedded recovery can support additional earnings improvement even if analog growth rates begin to normalize against stronger comparisons. Microchip’s operating leverage makes confirmation of improving unit demand more consequential for profit estimates than an equivalent percentage change would be for a less fixed-cost-intensive business.
The near-term trading catalyst is Microchip’s next disclosure on bookings, channel inventory, factory loading and revenue progression. The fundamental effect should emerge over the next 2 to 6 quarters if recovery translates into sustained production rather than temporary inventory replenishment.
TI’s margin improvement is not directly transferable. Its foundry-to-Lehi migration provides a company-specific cost benefit, and the call does not establish Microchip’s customer inventory position. The high-conviction inference is a more favorable embedded demand backdrop and an extended recovery opportunity, not a predetermined magnitude of Microchip margin expansion.
AUTOMOTIVE SEMICONDUCTOR DEMAND IS BENEFITING FROM CONTENT MIX AND LEAN INVENTORIES, NOT JUST VEHICLE VOLUME (READ-THROUGH 5)
Affected companies: NXP Semiconductors (NXPI: Netherlands) and Infineon Technologies (IFX: Germany). Direction: positive. Magnitude: moderate to high for NXP’s automotive exposure and moderate for Infineon’s automotive business, with important differences across product categories.
TI’s automotive revenue increased in the mid-teens year over year and approximately 10% sequentially. Management said, “I don’t see any inventory build-up. On the contrary, I wish they had a little bit more.” The hybrid-electric and powertrain systems sector grew approximately twice as fast as automotive overall. China and the U.S. contributed disproportionately to growth.
For NXP, higher production requirements and more complex vehicle architectures support demand for automotive control, networking, processing and related semiconductor functions. For Infineon, electrification supports requirements across power management, control, sensing and selected power devices. The precise transmission is higher semiconductor content and improved purchasing requirements per vehicle, combined with customers entering the production increase from relatively lean component inventories.
The geographic signal is important. TI described Chinese export vehicles as having higher content and greater TI share than some domestic applications. That supports a broader observation that Chinese automotive export growth can create opportunities for international semiconductor vendors; it does not automatically accrue only to local chip suppliers. However, TI’s own export-related share advantage cannot be assigned to NXP or Infineon without separate design-win evidence.
The near-term catalyst is confirmation in automotive semiconductor orders and guidance over the next earnings cycle. Lean customer inventory can make modest production changes translate into a disproportionate increase in immediate component orders. Longer term, content growth can support semiconductor revenue even when aggregate vehicle-unit growth is modest.
The limitation is product specificity. Strength in analog, control and powertrain-related components does not establish a recovery in silicon-carbide pricing, traction-inverter economics or every EV semiconductor category. It also does not justify a broad positive call on automaker margins. Vehicle manufacturers may face higher component costs and greater difficulty completing production kits even as semiconductor suppliers benefit.
AI HARDWARE, ELECTRICAL INFRASTRUCTURE AND INSTRUMENTATION
AI POWER SEMICONDUCTORS HAVE A CONTENT-GROWTH DRIVER THAT EXTENDS BEYOND ACCELERATOR UNIT SHIPMENTS (READ-THROUGH 6)
Affected companies: Monolithic Power Systems (MPWR: United States) and Infineon Technologies (IFX: Germany). Direction: positive for addressable demand. Magnitude: high operating relevance for Monolithic Power Systems’ data center power opportunity and moderate consolidated relevance for the more diversified Infineon.
TI reported approximately 95% year-over-year and 20% sequential data center growth. Management emphasized telemetry, cooling, efficiency and power density, and disclosed approximately 10,000 generic part numbers sold into the market. Mike Beckman stated, “when there’s more power, there’s more opportunity for TI,” extending the same observation to power density and higher voltages.
The mechanism for Monolithic Power Systems is increasing demand for high-efficiency conversion, regulation and power management around compute and networking systems. Infineon participates across power conversion and distribution through its broader power-semiconductor portfolio. As electrical requirements increase, designers must manage conversion losses, transient response, protection and thermal constraints. Revenue opportunity can consequently rise with system complexity and power delivery requirements, rather than depending exclusively on accelerator shipments.
This is a stronger read-through for power-semiconductor demand than for any particular GPU supplier’s unit growth. TI’s broad component participation provides evidence that infrastructure investment is translating into actual requirements across multiple rack subsystems. It does not disclose how much growth comes from new capacity, rising content, pricing or market share, so the 95% figure should not be used as a peer growth forecast.
The near-term catalyst is continued strength in enterprise-data and data center power results, together with evidence that new platform ramps are translating into shipments. The longer-duration shift is rising power-management complexity across successive infrastructure generations.
The competitive qualification is material. TI is developing more application-specific products and beginning early ramps at Sherman. This supports growth in the market but also expands the competitive field. The high-conviction conclusion is a larger and more demanding power-semiconductor opportunity, not guaranteed share gains or margin expansion for every incumbent.
ELECTRICAL DISTRIBUTION AND THERMAL MANAGEMENT RECEIVE A STRONGER FUNDAMENTAL SIGNAL THAN GENERAL INDUSTRIAL EQUIPMENT (READ-THROUGH 7)
Affected companies: Eaton (ETN: Ireland), Schneider Electric (SU: France) and Vertiv (VRT: United States). Direction: positive. Magnitude: high relevance for Vertiv’s operating environment and moderate to high relevance for the electrical businesses of Eaton and Schneider Electric. The marginal trading surprise may be smaller because data center strength is already an established theme.
TI identified energy infrastructure as a particularly strong industrial sector and explicitly connected part of that demand to data centers. Management also described increasing rack requirements for cooling, efficiency and power density, and said that “the world is rebuilding its grid.” These observations provide corroborating evidence from semiconductor demand inside the equipment supply chain, rather than relying solely on electrical-equipment order announcements.
Eaton and Schneider Electric benefit through power distribution, protection, switching, power quality and associated infrastructure required to connect and operate additional electrical load. Vertiv benefits through critical power and thermal-management systems required to make higher-density computing facilities operable. The transmission is physical: higher power consumption and density require changes in the equipment that delivers electricity and removes heat.
The non-consensus distinction is relative to a generic industrial recovery basket. TI’s industrial growth includes sectors supported directly by data center construction and rising electrical requirements. That evidence maps more tightly to electrical distribution and cooling than to general factory automation, process equipment or unrelated machinery demand. Treating the entire industrial universe as an equivalent beneficiary would lose the most important information in the call.
Near-term catalysts are equipment bookings, backlog conversion, project schedules and capacity-ramp execution over the next several quarters. Longer term, rising electrical intensity can support demand even if the growth rate of data center construction moderates. Equipment content per facility and the need to reinforce upstream infrastructure can remain elevated.
The negative qualification is that strong demand does not guarantee uninterrupted revenue recognition. Component shortages, installation schedules, grid connections and customer project sequencing can defer shipments. TI’s remarks support sustained equipment requirements; they do not establish realized pricing, margins or delivery schedules at these companies. Additionally, TI’s U.S.-led but worldwide data center commentary favors geographically diversified electrical suppliers rather than a purely domestic interpretation.
TEST AND MEASUREMENT IS AN ADDITIONAL AI-INFRASTRUCTURE EXPOSURE, NOT MERELY A LAGGING INDUSTRIAL CYCLICAL (READ-THROUGH 8)
Affected company: Keysight Technologies (KEYS: United States). Direction: positive. Magnitude: moderate at the consolidated level, with potentially higher relevance for AI infrastructure and high-speed digital test applications.
TI identified test and measurement among the industrial sectors most closely associated with data center investment. Ilan explained that customers are building memories and GPUs and “need to test them,” describing the sector as very fast-growing for TI. The call therefore connects semiconductor demand in instrumentation to actual investment in increasingly complex computing systems.
Keysight’s relevant exposure is design, characterization, validation and interoperability testing across high-speed electrical, optical and system-level infrastructure. Its announced PCIe 7.0 and AI-infrastructure test offerings establish a direct product connection to the complexity being described. The transmission mechanism is not simply higher chip production. Faster interfaces, tighter signal-integrity requirements and more complex systems increase validation requirements, which can support instrumentation, software and related services.
This should be distinguished from high-volume semiconductor production testing. Keysight is not interchangeable with Teradyne or Cohu. The production-test read-through concerns manufacturing capacity and throughput; the Keysight read-through concerns development, characterization and system validation. Both benefit from infrastructure complexity, but their budget owners, order timing and revenue conversion differ.
The near-term catalyst is evidence that stronger AI-infrastructure demand is broadening orders and guidance rather than remaining concentrated in a small set of projects. The longer-duration driver is the need to validate each new interface and system generation as performance requirements increase.
TI’s component sales into instrumentation are not a direct measure of Keysight bookings. The read-through therefore supports the demand environment and product opportunity, but not a mechanical revenue-growth estimate. It also does not establish a simultaneous recovery in unrelated communications or general-purpose instrumentation markets.
CROSS-PORTFOLIO RISK
INDUSTRIAL, ELECTRICAL AND SEMICONDUCTOR HOLDINGS PROVIDE LESS AI-CYCLE DIVERSIFICATION THAN THEIR SECTOR LABELS IMPLY (READ-THROUGH 9)
Affected companies: Analog Devices (ADI: United States), Monolithic Power Systems (MPWR: United States), Eaton (ETN: Ireland), Schneider Electric (SU: France), Vertiv (VRT: United States) and Keysight Technologies (KEYS: United States). Direction: negative for assumed portfolio diversification, not a negative current earnings forecast. Magnitude: potentially high for portfolios holding several of these businesses alongside AI accelerator and networking exposures.
The supporting evidence is explicit. TI disclosed direct data center exposure of approximately 13% of revenue and identified energy infrastructure and test and measurement as industrial sectors closely connected to the same spending cycle. The same economic investment can therefore appear in semiconductor, industrial, electrical-equipment and instrumentation revenue classifications.
The transmission mechanism is a shared ultimate spending driver. A major data center project generates demand for power semiconductors, electrical distribution equipment, cooling systems and testing infrastructure. A project acceleration can lift all of them, while a funding, power-availability or construction delay can affect several simultaneously. Different sector labels do not eliminate this common dependence.
The near-term implication is increased sensitivity to hyperscaler capital-spending updates, project delays and infrastructure deployment schedules across apparently diversified holdings. The longer-duration implication is that historical sector correlations may understate future shared exposure as AI-related demand becomes a larger part of each company’s business.
This does not imply identical earnings sensitivity. Electrical suppliers may have longer backlogs, instrumentation demand can precede production, and semiconductor shipments can respond more quickly to inventory adjustments. Those differences can stagger the timing of revenue effects. They do not remove the underlying connection.
The actionable conclusion is to distinguish independent demand diversification from different stages of the same project. TI’s call supports strong current fundamentals across several industries, but simultaneously weakens the assumption that owning those industries together provides substantial protection against an AI-infrastructure spending slowdown.
SOURCE LIMITATION
The read-throughs are anchored in the completed TI transcript and the supporting company disclosures identified above. Some supplemental company pages returned access errors, and an interrupted source-verification run expired before completion. Unretrieved pages were not treated as verified evidence. No undisclosed supplier awards, customer purchase volumes, contract cancellations or company-specific earnings revisions are assumed.
Report record
- Sector
- Information Technology
- Fiscal period end
- September 30, 2026
- Report date
- October 21, 2026
- Analysis
- 6613 words
- Read-throughs
- 3260 words
- Content fingerprint (PDF)
548fbd290223- Content fingerprint (analysis)
c835b6e0f306- Content fingerprint (read-throughs)
c8b2f9281cca
Prepared from the company's earnings release and earnings call transcript. Figures as reported by the company. For information only. Not investment advice.
More from Texas Instruments Incorporated
No other reports yet.
All Texas Instruments Incorporated reports
More in Information Technology
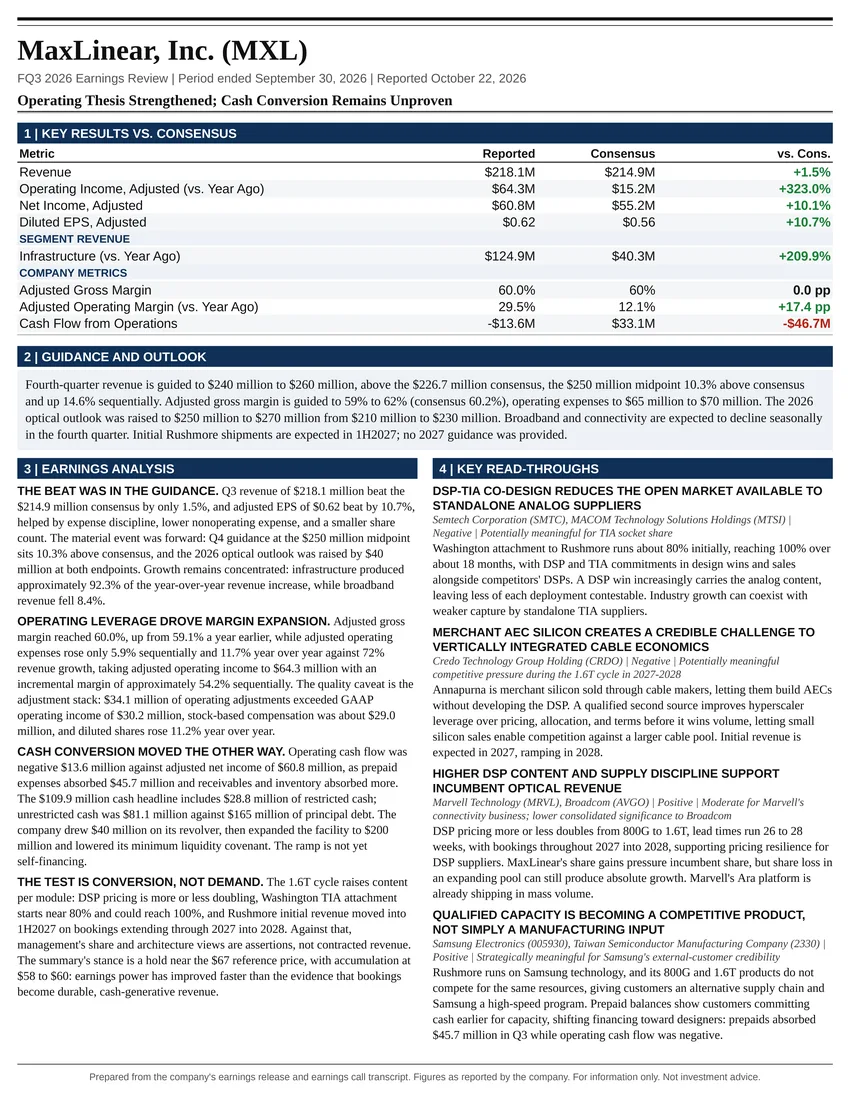
Operating Thesis Strengthened; Cash Conversion Remains Unproven
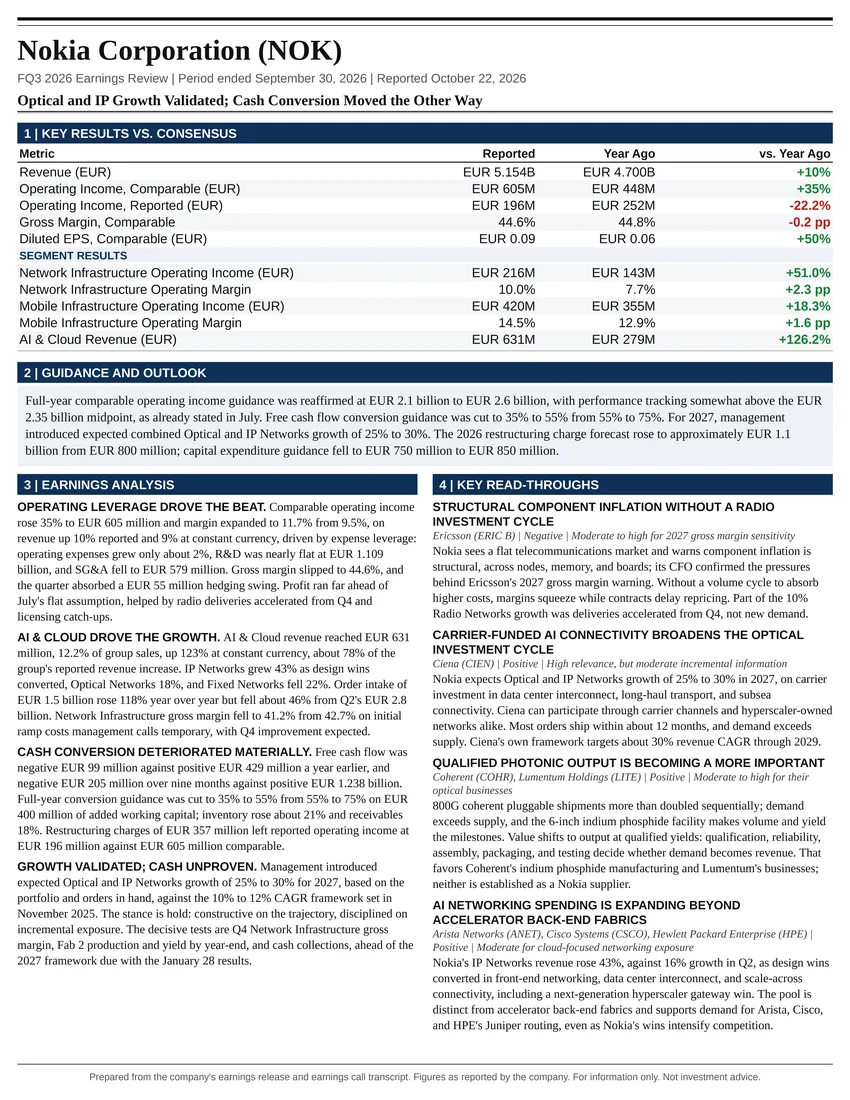
Optical and IP Growth Validated; Cash Conversion Moved the Other Way
All Information Technology reports
Follow @AtlasPeakRes on X for new earnings reports as they publish.