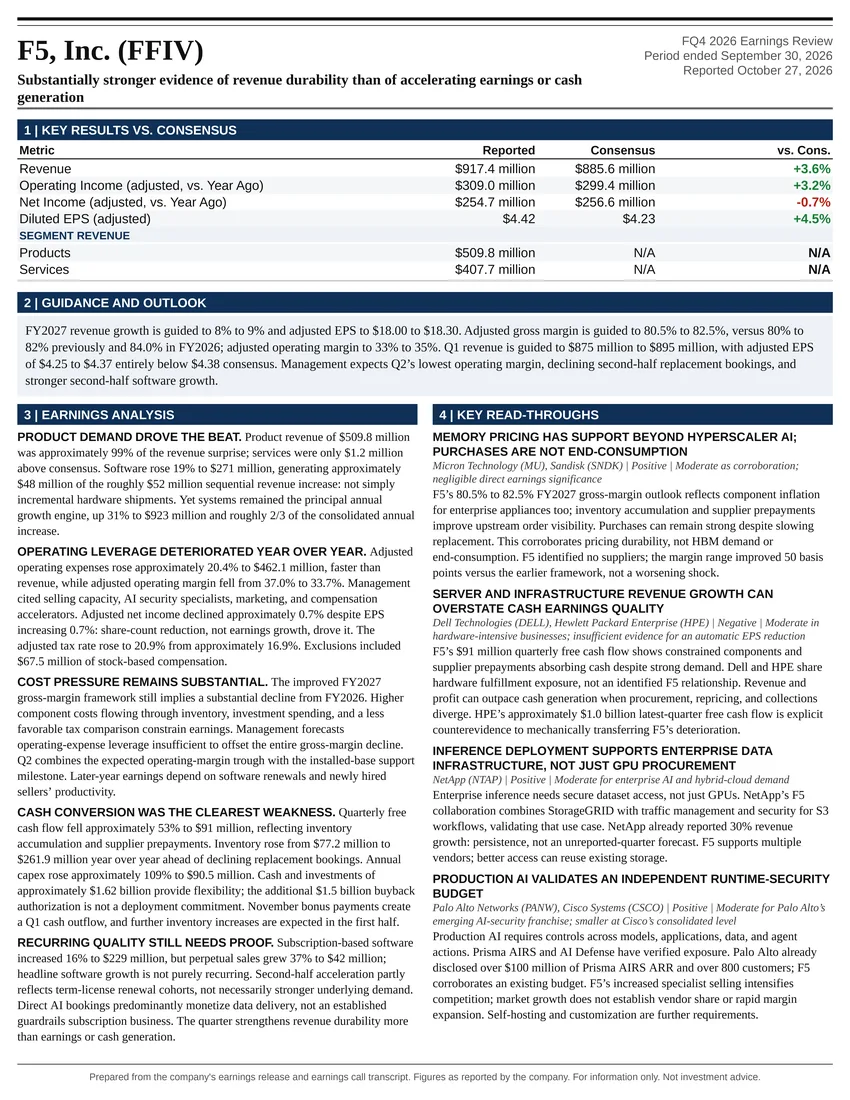
Substantially stronger evidence of revenue durability than of accelerating earnings or cash generation
Earnings Reports
Ultra Clean Holdings, Inc. FQ3 2026 Earnings Report
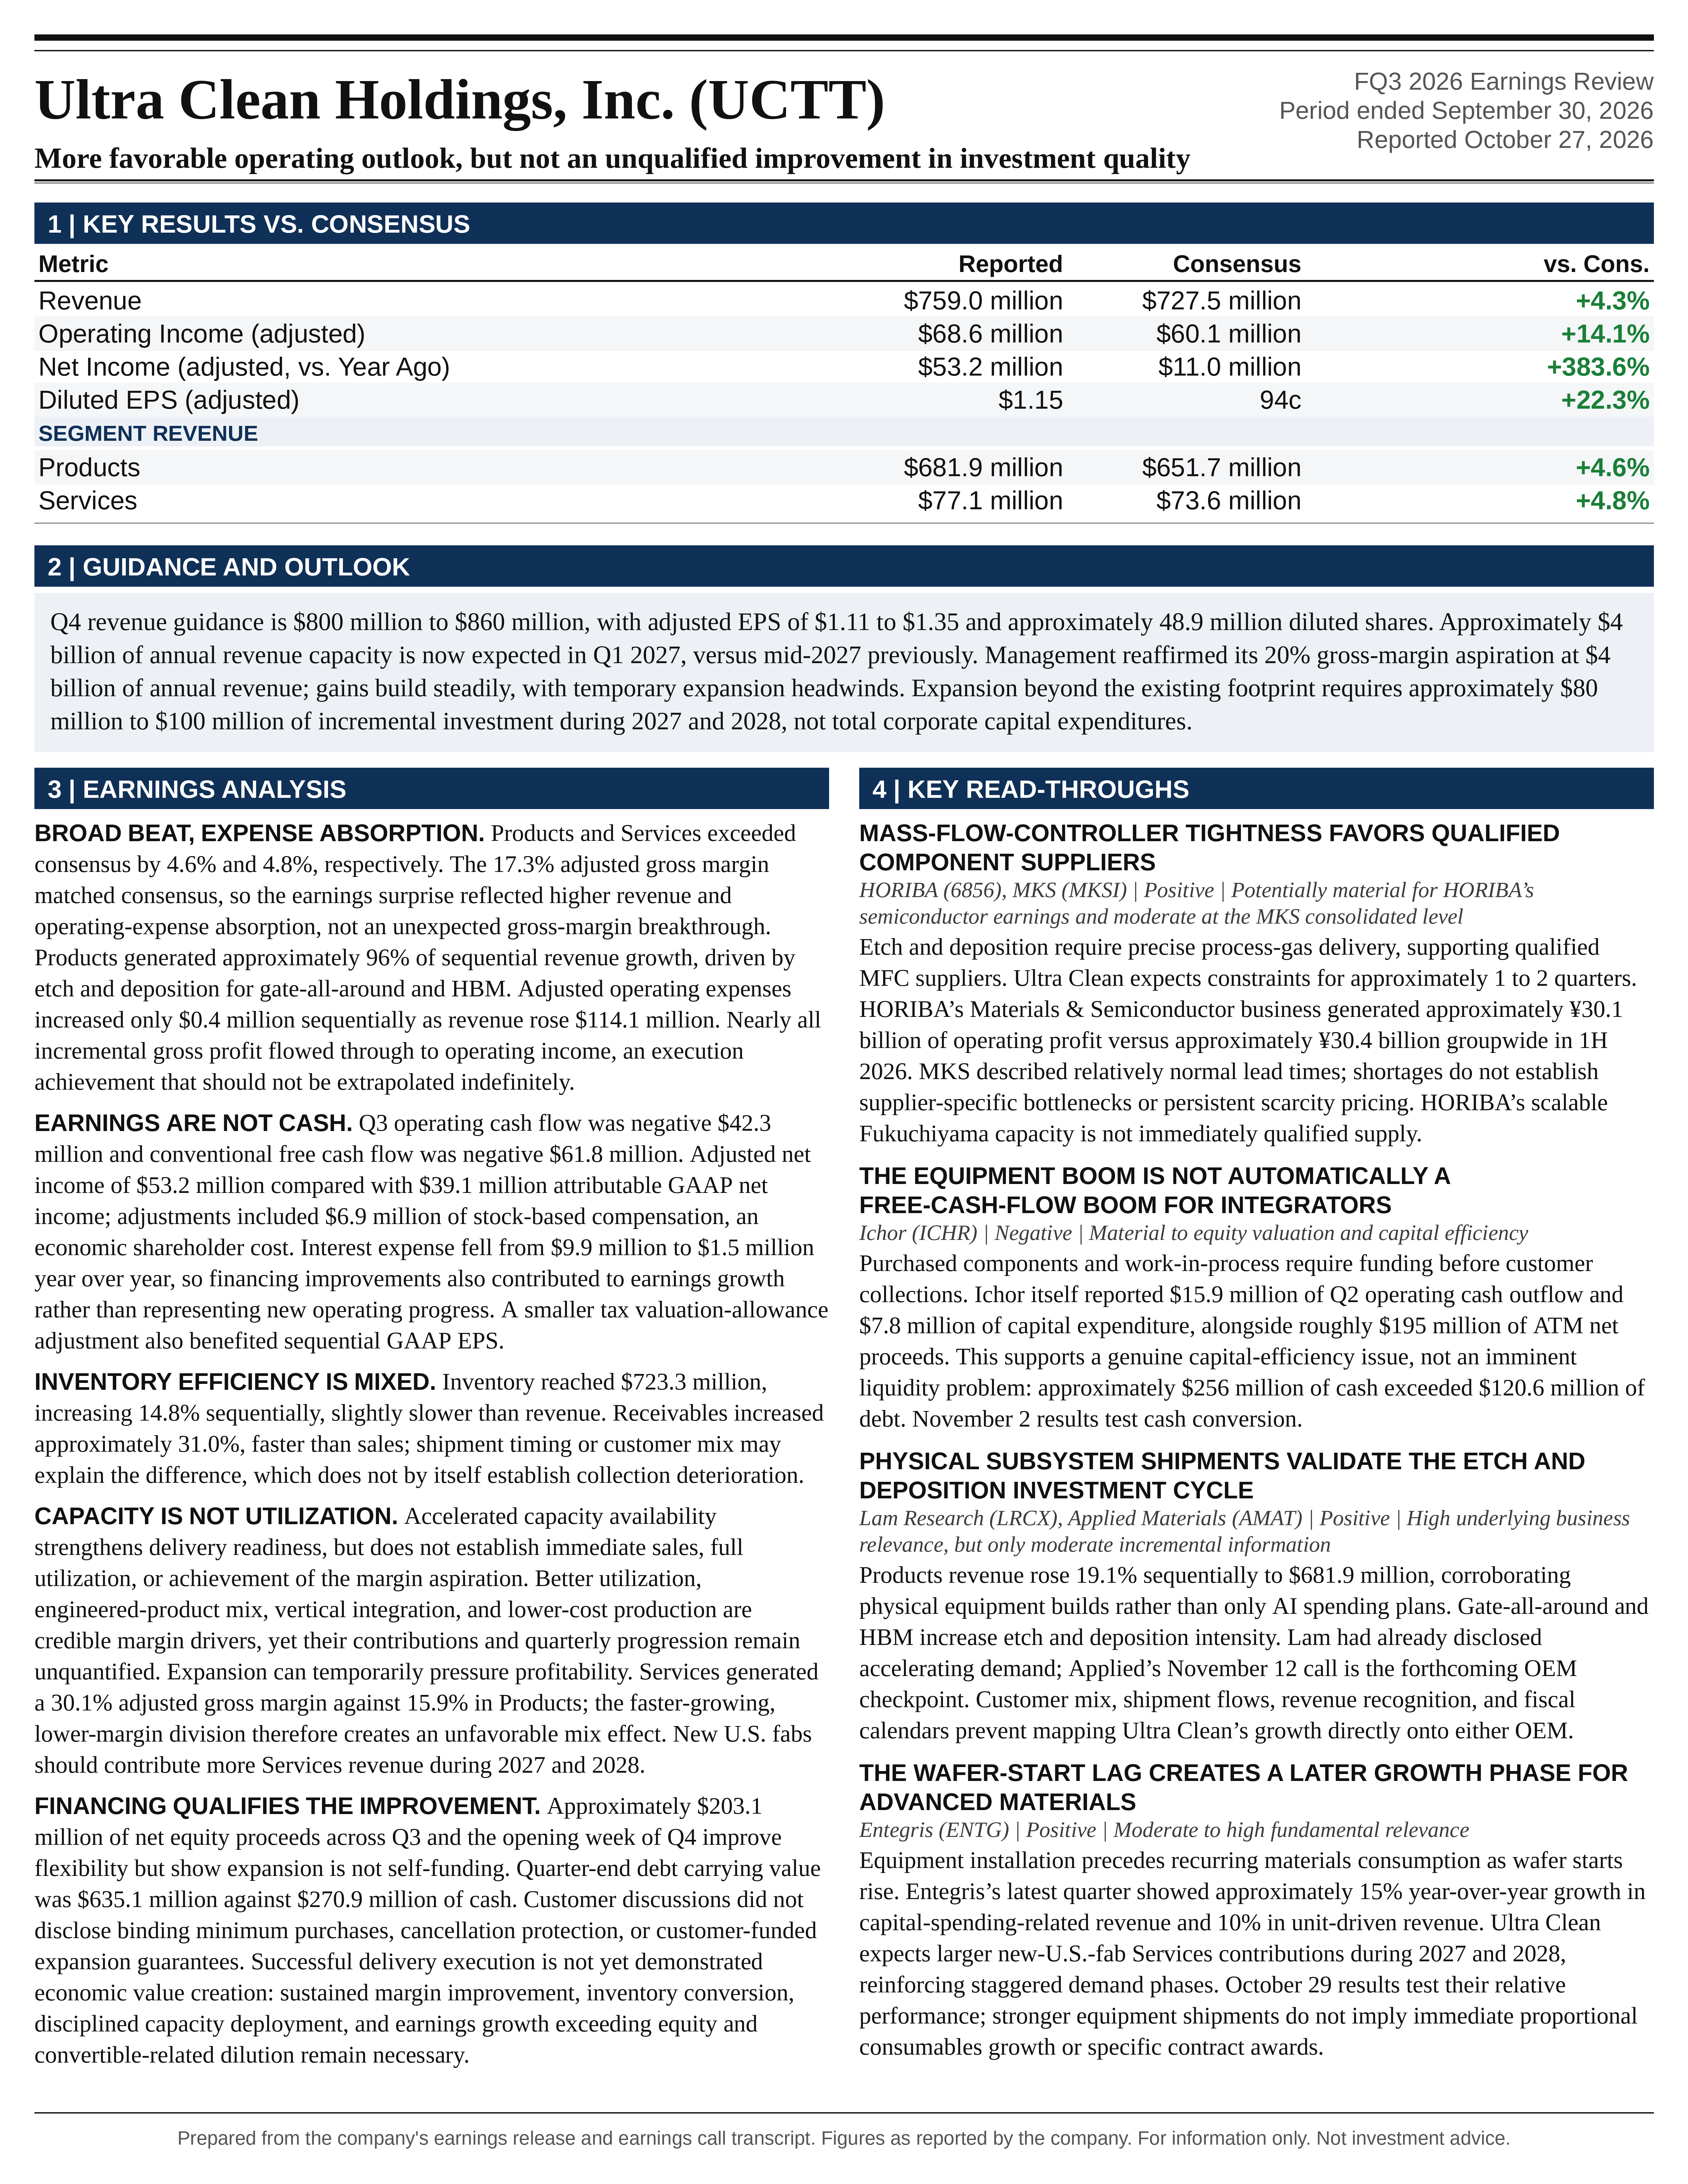
Ultra Clean Holdings, Inc. (UCTT) FQ3 2026 earnings: More favorable operating outlook, but not an unqualified improvement in investment quality. Full earnings analysis, key read-throughs, and the one-page exhibit from Atlas Peak Research.
Ultra Clean Holdings, Inc. (UCTT)
Sector: Information Technology · FQ3 2026 · Period end September 30, 2026 · Reported October 27, 2026
Ultra Clean’s Q3 2026 earnings call supports a more favorable operating outlook, but not an unqualified improvement in investment quality. Record revenue, substantial operating leverage, and accelerated capacity readiness strengthen the case for higher earnings through 2027.
Download the one-page report (PDF)
View one-page exhibit
Download analysis (.md)
Download read-throughs (.md)
Post to X
One-Page Exhibit
Earnings Analysis
EXECUTIVE CALL SUMMARY: Ultra Clean Holdings Inc. (10/27/26)
Ultra Clean’s Q3 2026 earnings call supports a more favorable operating outlook, but not an unqualified improvement in investment quality. Record revenue, substantial operating leverage, and accelerated capacity readiness strengthen the case for higher earnings through 2027. However, persistent cash consumption, rising inventory exposure, equity dilution, and limited disclosure of binding customer commitments materially qualify that conclusion. The appropriate investment stance is selectively constructive, with valuation and cash conversion determining position size rather than the magnitude of reported EPS growth alone.
Revenue of $759.0 million increased 17.7% sequentially and 48.8% year over year, exceeding Bloomberg consensus by 4.3%. Adjusted EPS of $1.15 exceeded consensus by 22.3% and the previous guidance ceiling by 11.7%. Adjusted operating income increased 52.1% sequentially to $68.6 million. Importantly, the 17.3% adjusted gross margin matched consensus. The earnings surprise therefore reflected higher revenue and better operating-expense absorption rather than an unexpected gross-margin breakthrough.
The forward outlook remains strong. Q4 revenue guidance of $800 million to $860 million implies 9.4% sequential growth at the midpoint. Adjusted EPS guidance of $1.11 to $1.35 implies 7.0% midpoint growth despite a 5.8% increase in the guided diluted share count. On a constant-share basis, midpoint EPS would be approximately $1.30, indicating a stronger underlying earnings progression than the reported $1.23 midpoint suggests.
The most consequential strategic update was the acceleration of approximately $4 billion in annual revenue capacity to Q1 2027, versus the previous mid-2027 timetable. Management also expressed greater confidence that 2027 wafer fabrication equipment spending will exceed $200 billion. That outlook is materially more aggressive than SEMI’s 2026 mid-year OEM forecast, which mechanically implies approximately $175.3 billion of 2027 WFE sales. Different publication dates and potentially different market definitions prevent a definitive contradiction, but the comparison demonstrates that management’s industry assumption should not be treated as a universally established baseline.
The principal investment concern is that the operating model remains dependent on external financing during a period of exceptional reported growth. Q3 operating cash flow was negative $42.3 million, and conventional free cash flow, defined as operating cash flow less capital expenditures, was negative $61.8 million. Inventory reached $723.3 million. Approximately $203.1 million of net equity proceeds were raised during Q3 and the opening week of Q4. These proceeds substantially improve financial flexibility, but also establish that the expansion has not yet become self-funding.
The central investment distinction is between successful delivery execution and demonstrated economic value creation. Q3 provides compelling evidence of the former. The latter requires sustained margin improvement, conversion of inventory into cash, disciplined capacity deployment, and earnings growth that exceeds the combined effects of equity issuance and convertible-related dilution.
QUARTERLY PERFORMANCE AND THE COMPOSITION OF THE BEAT
Q3 revenue exceeded the supplied Bloomberg consensus of $727.5 million by $31.5 million. Products revenue of $681.9 million exceeded its $651.7 million estimate by 4.6%, while Services revenue of $77.1 million exceeded its $73.6 million estimate by 4.8%. Outperformance was therefore broad across the reported divisions rather than concentrated entirely in equipment-related Products.
The segment consensus figures sum to $725.3 million, below the $727.5 million consolidated estimate. This indicates that the consensus components do not constitute a perfectly reconciled forecast. Segment surprises are valid individually, but their dollar contributions should not be forced into an exact consolidated beat bridge.
Adjusted gross profit of $131.5 million exceeded the $125.4 million consensus by $6.1 million, or 4.9%. Adjusted operating income of $68.6 million exceeded the $60.1 million estimate by $8.5 million, or 14.1%. The difference implies approximately $2.4 million of operating-expense outperformance, since the consensus gross-profit and operating-income figures imply $65.3 million of operating expenses against actual expenses of $62.9 million.
Approximately 72% of the operating-income beat therefore came from gross-profit dollars, primarily supported by higher revenue, and approximately 28% came from operating-expense discipline. Applying the reported 20% adjusted tax rate and actual diluted share count to the operating-income surprise produces approximately $0.15 of EPS, versus the total $0.21 EPS beat. The remaining difference cannot be allocated precisely without matched consensus assumptions for taxes, noncontrolling interests, financing items, and diluted shares.
Performance also exceeded the previous management forecast. The August 3 earnings release guided Q3 revenue to $700 million to $750 million and adjusted EPS to $0.83 to $1.03. Actual revenue exceeded the $725 million midpoint by 4.7% and the ceiling by 1.2%. Adjusted EPS exceeded the $0.93 midpoint by 23.7% and the ceiling by 11.7%.
The above-range earnings characterization applies specifically to adjusted results. GAAP EPS of $0.85 remained within the previous $0.67 to $0.87 range. This does not invalidate the operating beat, but it is relevant to the interpretation of management’s statement that “top and bottom line results” exceeded the high end of guidance.
Historical comparisons confirm a substantial recovery in operating scale. Revenue increased from $533.7 million in Q1 to $644.9 million in Q2 and $759.0 million in Q3. Q3 revenue was 42.2% above Q1. Adjusted EPS progressed from $0.31 to $0.70 to $1.15, while adjusted operating margin increased from 5.1% to 7.0% to 9.0%.
Year-over-year comparisons are similarly strong but reveal an important nuance. Adjusted operating income increased 134.9% from $29.2 million, and adjusted net income increased 383.6% from $11.0 million. Yet adjusted gross margin increased only from 17.0% to 17.3%. Much of the extraordinary earnings growth therefore reflects operating leverage and financing improvements from a depressed earnings base, rather than a dramatic change in gross profitability.
PRODUCTS, SERVICES, AND END-MARKET EXPOSURE
Products revenue increased 19.1% sequentially and 53.2% year over year. The $109.2 million sequential increase represented approximately 96% of consolidated sequential revenue growth. Products remain the dominant source of near-term earnings acceleration.
Management attributed Products strength primarily to etch and deposition applications supporting gate-all-around transistors and high-bandwidth memory. This exposure is economically attractive because increasingly complex device architectures can increase process intensity as well as equipment volumes. Greater deposition, etch, gas-delivery, and thermal-control requirements can expand subsystem demand even when wafer capacity grows more slowly than equipment spending.
However, process intensity does not automatically translate into equivalent revenue or margin gains for Ultra Clean. The economic outcome depends on customer platform share, outsourced manufacturing penetration, subsystem content, sourcing decisions, and the extent to which engineering responsibility shifts toward Ultra Clean. The call did not quantify these factors sufficiently to separate industry growth from structural content gains.
The reported revenue mix was 52% foundry and logic, 34% memory, approximately 10% Services, and 4% non-semiconductor markets. Semiconductor Products therefore represented 86% of consolidated revenue, while the broader Products division represented approximately 90%. These are different classifications and should not be treated interchangeably.
The memory exposure should not be interpreted as entirely HBM-related. Management identified HBM as an important growth driver, but did not disclose the split between HBM-associated DRAM, other DRAM applications, and NAND. Similarly, the foundry and logic category does not establish that all associated revenue is tied to leading-edge AI manufacturing.
Services revenue increased 6.7% sequentially and 18.6% year over year. This is healthy growth, but substantially below Products growth. Services consequently declined from approximately 11.2% of consolidated revenue in Q2 to 10.2% in Q3.
That mix shift matters because Services generated a 30.1% adjusted gross margin, compared with 15.9% in Products. Using prior-quarter segment margins, the lower Services weighting created approximately 14 basis points of consolidated gross-margin pressure. Consolidated gross margin improved despite this unfavorable segment mix.
Services gross margin increased from 28.9% to 30.1%, while operating margin increased from 11.2% to 13.6%. The gross-margin improvement largely restored the 30.0% level achieved in Q1 rather than establishing an entirely new profitability range. The more notable development was the stronger operating margin, consistent with improved absorption of the Services cost base.
The timing distinction between Products and Services remains central. Equipment-related revenue benefits during the buildout and installation phase. Cleaning, coating, and analytical services benefit more fully after wafer starts and utilization increase. Management stated that new U.S. fabs should make a larger Services contribution during 2027 and 2028.
The prior call already anticipated double-digit Services growth in 2026 and 2027, with acceleration tied to fab ramps and utilization. The current call extends and clarifies that timing rather than introducing a wholly new growth thesis. Services can provide a later-cycle earnings contribution, but at approximately 10% of revenue it is not yet large enough to neutralize a material downturn in Products.
MARGIN PROGRESSION AND THE QUALITY OF OPERATING LEVERAGE
The strongest demonstrated financial capability in Q3 was expense leverage. Revenue increased $114.1 million sequentially, while adjusted operating expenses increased only $0.4 million. Adjusted gross profit increased $23.9 million, and operating income increased $23.5 million.
The resulting sequential incremental gross margin was approximately 20.9%, and incremental operating margin was approximately 20.6%. Nearly all incremental gross profit flowed through to operating income. Operating expenses declined from 9.7% of revenue to 8.3%.
This is a meaningful execution achievement, but not necessarily a sustainable quarterly relationship. Capacity expansion, engineering investment, digital systems, hiring, and a larger global footprint should eventually require additional expenses. Extrapolating an essentially flat operating-expense base indefinitely would overstate future earnings.
The year-over-year bridge is particularly informative. Adjusted operating expenses increased approximately 9.0%, versus revenue growth of 48.8%. Operating margin expanded approximately 330 basis points, while gross margin improved only approximately 30 basis points. The predominant demonstrated driver of higher profitability is therefore expense absorption.
Management reiterated the objective of 20% gross margin at $4 billion of annual revenue. The target remains unchanged from the prior call. The important new development is faster capacity availability, not an explicit increase in the margin objective.
At $4 billion of annual sales, a 20% gross margin would generate $800 million of gross profit. Applying the current 17.3% margin to the same revenue produces $692 million. The remaining 270-basis-point improvement therefore represents approximately $108 million of annual gross profit beyond the contribution from revenue growth alone.
Assuming a 20% tax rate and 50 million diluted shares, that margin difference represents approximately $1.73 of annual EPS before additional operating expenses and other changes. Each 100 basis points of gross margin at $4 billion of revenue is worth approximately $0.64 per share under those assumptions. Margin realization is consequently a major component of potential equity value, not a secondary consideration.
The identified drivers are credible: better utilization, a richer mix of engineered products, greater vertical integration, and increased production in lower-cost regions. Nevertheless, the call did not quantify the contribution from each driver or provide a dated quarterly progression.
The CFO appropriately cautioned that “These gains will build steadily rather than in large steps” and that capacity expansions may create temporary headwinds. This qualification is important. Having $4 billion of available capacity in Q1 2027 does not mean the company immediately achieves a $4 billion revenue rate, full utilization, or 20% gross margin.
The target should therefore be modeled as a conditional operating outcome rather than an automatic consequence of completing facilities. Underutilized capacity, qualification delays, unfavorable customer mix, expedited freight, or higher component costs could defer the anticipated improvement.
Q4 GUIDANCE AND CHANGES FROM THE PRIOR OUTLOOK
Q4 revenue guidance of $800 million to $860 million implies sequential growth of 5.4% to 13.3%, with 9.4% growth at the $830 million midpoint. The outlook indicates another substantial expansion, although the midpoint growth rate moderates from 20.8% in Q2 and 17.7% in Q3.
This moderation does not establish a demand slowdown. Growth rates naturally decline as the revenue base increases, and management continues to describe strong customer demand. It does, however, argue against mechanically extrapolating the recent pace of sequential acceleration.
Adjusted EPS guidance of $1.11 to $1.35 implies a range from a 3.5% sequential decline to a 17.4% increase. The $1.23 midpoint represents 7.0% growth. The guided diluted share count increases from 46.2 million to approximately 48.9 million.
At the midpoint, implied adjusted net income is approximately $60.1 million, up 13.1% from Q3. Holding shares constant at the Q3 level would produce approximately $1.30 of EPS. The increase in diluted shares therefore reduces midpoint quarterly EPS by approximately $0.07.
Even at the low end, $1.11 of EPS on 48.9 million shares implies approximately $54.3 million of adjusted net income, modestly above Q3’s $53.2 million. Thus, the low-end EPS decline does not necessarily imply a decline in aggregate adjusted earnings.
The midpoint implies an adjusted net margin of approximately 7.25%, versus 7.01% in Q3. This suggests continued earnings leverage, but considerably less dramatic margin expansion than the Q3 operating-margin increase. Operating margin itself cannot be reconstructed precisely because management did not disclose a complete Q4 bridge for gross margin, operating expenses, taxes, noncontrolling interests, and financing items.
The previous call anticipated gross margin moving toward approximately 17% during the remainder of 2026. Q3’s 17.3% result has already reached that general level. The current call did not provide a formal numerical Q4 gross-margin range, so the absence of a higher stated range should not be characterized as a guidance reduction.
Q4 GAAP EPS guidance is $1.02 to $1.26, implying a $1.14 midpoint. The gap between GAAP and adjusted EPS narrows to $0.09 across the guided range, compared with $0.30 in Q3. The release does not provide a complete forward reconciliation, citing uncertainty associated with geographic earnings mix and taxes. Consequently, the stronger projected GAAP EPS increase should not be attributed entirely to underlying operating improvement.
Adding Q4 revenue guidance to reported 9-month revenue produces an implied full-year revenue range of $2.738 billion to $2.798 billion, with a midpoint of $2.768 billion. This is an arithmetic implication, not separately issued annual guidance.
The Q4 midpoint annualizes to $3.32 billion. Maintaining that quarterly revenue level throughout 2027 would produce approximately 20.0% growth over the implied 2026 midpoint without further sequential growth. Conversely, reaching $4 billion of recognized 2027 revenue would require approximately 44.5% annual growth. These distinctions separate growth carried into the year from incremental acceleration and distinguish capacity from actual sales.
The supplied Bloomberg notice provides Q3 consensus but not a verified Q4 consensus comparison. The new quarterly outlook should therefore be described as strong sequential guidance rather than assigned an unsupported forward-consensus beat.
INDUSTRY OUTLOOK AND THE ASSUMPTIONS EMBEDDED IN CAPACITY PLANNING
Management stated, “we now expect 2027 Wafer Fab equipment spending to be above $200 billion.” Compared with the prior call, the meaningful change is increased confidence and a narrower directional view.
On the August call, management discussed an industry range of approximately $190 billion to $220 billion and characterized its preparation as oriented toward the bullish case. The current call presents spending above $200 billion as more firmly supported by customer visibility. However, no precise midpoint or upper bound was supplied. The change cannot be translated into an exact percentage forecast increase.
The evidence cited consists of longer customer forecasts, healthy fab utilization, and visibility into critical-component availability. These are relevant leading indicators. They are not equivalent to a disclosed, noncancelable order backlog.
External industry forecasts provide an important counterweight. SEMI’s 2026 mid-year OEM outlook projected $143.9 billion of WFE sales in 2026, followed by 21.8% growth in 2027. That implies approximately $175.3 billion in 2027. Management’s above-$200 billion view is therefore at least approximately 14% higher than that earlier published forecast.
SEMI’s framework reaches approximately $200 billion in 2028, versus the approximately $250 billion 2028 figure discussed on Ultra Clean’s call. The different forecast dates, market scopes, and potentially changing customer plans mean these figures are not necessarily inconsistent. They nevertheless demonstrate meaningful uncertainty around the magnitude and timing of the investment cycle.
Management explicitly acknowledged that the approximately $250 billion 2028 figure came from the analyst community rather than a clear numerical forecast from customers. That disclosure limits the evidentiary strength of the 2028 planning assumption. Customer booking visibility can support confidence in future activity without validating a particular industry spending total.
The correction to the UBS analyst’s capacity calculation was useful. Management linked $5 billion of Ultra Clean revenue to approximately $250 billion of WFE, rather than $330 billion. This implies a rough relationship of $20 million of Ultra Clean revenue per $1 billion of WFE spending.
That relationship is a planning heuristic, not a contractual participation rate or a literal 2% market share. Ultra Clean revenue includes Services and non-semiconductor activities, and its exposure depends on customer mix, outsourcing penetration, subsystem content, and revenue timing.
The CFO’s statement was appropriately restrained: “Historically, averaged as a group, we track in line with our customers and expect to perform in line with WFE growth.” This should carry more weight in a base case than unquantified suggestions of substantial share gains. Structural outgrowth remains a potential upside driver, not a demonstrated company-wide forecast.
CAPACITY EXPANSION, CUSTOMER COMMITMENTS, AND CAPITAL AT RISK
Approximately $4 billion of annual revenue capacity is now expected in Q1 2027, compared with the previous mid-2027 expectation. This is a meaningful acceleration within the previously discussed 1H 2027 window.
The 26,000-square-foot Malaysian cleanroom expansion was already disclosed on the prior call. The new information is that it became operational earlier than anticipated and contributed to Q3 outperformance. Earlier capacity availability directly improved the company’s ability to convert customer demand into recognized revenue.
Additional plans include doubling cleanroom capacity in Cebu over the next several quarters, adding cleanroom capacity in Singapore and the Czech Republic, and doubling vertically integrated manufacturing capacity in Malaysia and Thailand during 2027. These statements refer to specific facilities or capabilities, not a doubling of consolidated company capacity.
Management also described 15% to 20% burst capacity. This is valuable operational flexibility, but should not be treated as permanent capacity available at unchanged cost, quality, or utilization economics. Burst production may involve additional shifts, overtime, expedited materials, or other execution requirements.
The Q4 revenue midpoint of $830 million is approximately 20.5% below the quarterly revenue pace associated with a $4 billion annual run rate. Significant additional sales growth is therefore required before the newly available capacity is fully reflected in revenue.
Expansion to $5 billion and beyond will require capacity outside the existing footprint. Management expects approximately $80 million to $100 million of incremental investment during 2027 and 2028. This is not a complete corporate capital-expenditure budget and should not be treated as the entire financing requirement for the expansion.
The call’s most important unanswered capital-allocation question concerned customer risk sharing. UBS asked whether substantial investment would produce preferred-supplier status, additional share, or other assurances. Management described early engagement, shared forecasts, and “very open and constructive discussion with our key customers.”
The response did not disclose binding minimum purchases, take-or-pay obligations, customer-funded capital expenditures, capacity reservation payments, cancellation protection, or guaranteed share allocations. Such protections may exist privately, but they were not established on the call. Commercial confidence should not be confused with contractual transfer of utilization risk.
This distinction matters because capacity and inventory are being committed ahead of realized customer demand. If the industry forecast proves too aggressive, Ultra Clean could face underabsorbed facilities and excess components simultaneously. Customer alignment reduces that risk only to the extent that it translates into durable purchasing commitments or economically valuable program positions.
WORKING CAPITAL, CASH CONVERSION, AND INVENTORY RISK
Operating cash flow was negative $42.3 million in Q3, compared with negative $41.1 million in Q2 and negative $33.3 million in Q1. The business has therefore consumed operating cash throughout the year despite rapidly improving reported profitability.
Quarterly capital expenditures were $19.5 million, derived from $45.3 million of 9-month spending less $25.8 million in 1H. Conventional Q3 free cash flow was consequently negative $61.8 million.
For the first 9 months, operating cash flow was negative $116.7 million, compared with positive $57.5 million in the prior-year period. After capital expenditures, conventional free cash flow deteriorated from positive $17.3 million to negative $162.0 million. This is the clearest counterweight to the earnings acceleration.
The quarterly cash-flow statements show approximately $93.5 million of inventory-related cash absorption and $64.4 million of receivables-related absorption, partly offset by $26.7 million from accounts payable. Other operating items also affected cash flow, but these figures establish that working-capital investment materially exceeded the company’s earnings generation.
Inventory increased $93.4 million sequentially to $723.3 million and was 85.0% above the $390.9 million balance at year-end 2025. Management attributed the buildup to pre-ordering critical components and maintaining safety stock to protect deliveries.
There is an important mitigating factor. Inventory increased 14.8% sequentially, slightly slower than revenue growth. Using ending inventory and quarterly GAAP cost of revenue over a 91-day quarter, inventory represented approximately 104 days of cost of revenue, versus approximately 106 days in Q2. This is an ending-balance intensity measure rather than formal average-inventory days, but it indicates that inventory did not become less efficient on every sequential measure.
Receivables increased approximately 31.0% sequentially, faster than sales. This may reflect shipment timing or customer mix, and does not by itself establish collection deterioration. Nevertheless, it demonstrates that the cash requirement is broader than precautionary component purchases.
The $15.0 million increase in quarter-end cash should not be interpreted as operating cash generation. It reconciles to negative $42.3 million of operating cash flow, negative $19.5 million of investing cash flow, positive $68.1 million of financing cash flow, and positive $8.7 million from exchange-rate effects.
The scale of prospective working-capital needs also deserves attention. At Q3’s ratio of inventory to annualized revenue, an additional $1 billion of annual sales would require approximately $238 million of incremental inventory before supplier financing. Maintaining the current ratio of receivables plus inventory less payables would imply approximately $218 million of additional net trade working capital per $1 billion of annual sales. These are illustrative sensitivities, not forecasts, but they show why the $80 million to $100 million expansion budget understates the potential funding requirement.
Inventory also creates earnings risk if customer schedules weaken. An illustrative 5% write-down of the Q3 inventory balance would equal approximately $36 million pretax, or approximately $0.59 per share using a 20% tax rate and the Q4 guided share count. No such write-down was forecast or identified by management. The sensitivity demonstrates why inventory aging, customer-specific ownership, cancellation rights, and recoverability matter disproportionately at this stage of the cycle.
The appropriate cash-conversion test is not whether absolute inventory immediately declines during rapid growth. It is whether inventory intensity stabilizes, receivables remain collectible, customer deliveries convert into cash, and operating cash flow improves without repeated equity financing.
EQUITY ISSUANCE, DEBT, AND PER-SHARE ECONOMICS
Ultra Clean sold approximately 432,000 shares during Q3 at an average price of $80.13, generating approximately $34 million of net proceeds. During the opening week of Q4, approximately 2.2 million additional shares were sold at an average price of $78.45, generating $169.1 million of net proceeds.
The draft transcript’s reference to “$2.2 million shares” is a unit error. The proceeds and average sale price are consistent with approximately 2.2 million shares, not $2.2 million of equity proceeds.
Combined issuance totaled approximately 2.632 million shares and $203.1 million of net proceeds. The share issuance is economically significant relative to the Q3 diluted share base and broadly explains the increase to approximately 48.9 million guided diluted shares in Q4.
Approximately $193 million remains available under the $400 million ATM program. At an illustrative $80 sale price, full use would create approximately 2.41 million additional shares, equivalent to roughly 4.9% of the Q4 guided diluted share count. This is financing flexibility, not a commitment to issue the remaining amount.
The proceeds reduce liquidity risk and allow the company to fund inventory, capacity, and debt repayment without depending entirely on operating cash generation. However, the economic hurdle is higher than achieving greater aggregate revenue or income. Incremental returns must compensate for dilution and the capital committed ahead of customer demand.
Quarter-end debt carrying value was $635.1 million against $270.9 million of cash, implying approximately $364.2 million of net debt excluding leases. Adding the disclosed $169.1 million of subsequent equity proceeds would reduce pro forma net debt to approximately $195.1 million before intervening operating, investing, or other financing cash flows. Repaying the revolver changes gross debt and cash together, rather than providing an additional independent reduction in net debt.
The broader capital structure includes $600 million of 0% convertible notes due in 2031. The initial conversion price is approximately $84.75, and the capped-call protection initially extends to approximately $104.07.
The notes improve current cash-interest economics, but do not eliminate financing costs or future capital obligations. Capped-call protection is limited, and appreciation above the cap can produce additional dilution or cash-settlement exposure.
The Q3 release also states that adjusted diluted shares reflect convertible dilution using the capped-call cap price rather than the initial conversion price. Adjusted and GAAP share-count methodologies therefore require separate attention in valuation models. A fixed share count becomes less reliable as the stock appreciates.
Historical financing changes also contributed to year-over-year earnings growth. Quarterly interest expense declined from $9.9 million in Q3 2025 to $1.5 million in Q3 2026. At a 20% tax rate, the $8.4 million difference is approximately $0.15 per current diluted share. This is a genuine benefit, but largely reflects financing actions already completed rather than a new operating improvement introduced this quarter.
SUPPLY CONSTRAINTS AND THE LIMITS OF DELIVERY OUTPERFORMANCE
Management’s most concrete supply-chain assertion was straightforward: “We didn’t miss a shipment.” The company also reported accommodating incremental customer demand during the last 2 quarters.
These statements support the claim that advance capacity planning and safety stock have produced tangible commercial benefits. The earlier Malaysian expansion provides a specific operational explanation for part of the revenue outperformance.
Mass-flow-controller availability remains a constraint, with management expecting pressure to persist for approximately 1 to 2 quarters. This creates a near-term execution window spanning Q4 2026 and potentially Q1 2027. However, the call did not quantify supplier lead times, inventory coverage, alternate-source qualifications, premium procurement costs, or contractual delivery assurances.
The disclosed vertical-integration expansion should not be interpreted as eliminating MFC dependence. The company did not announce entry into MFC manufacturing. Producing more components internally can reduce selected bottlenecks while leaving critical externally sourced components as potential constraints.
Oppenheimer raised a particularly important system-level question: Ultra Clean can deliver its subsystems on time while shortages elsewhere prevent an OEM from completing equipment. Management stated that this was not currently affecting shipments, but the economic risk remains.
Incomplete OEM systems can eventually alter shipment schedules, consume OEM working capital, and reduce near-term demand for additional subsystems. Ultra Clean’s execution is therefore necessary but not sufficient to guarantee uninterrupted end-system output.
The advantage from safety stock also has a potential reversal. When shortages ease, customers and suppliers may reduce precautionary inventories or eliminate overlapping orders. End-market demand can remain healthy while replenishment demand normalizes. This is why inventory-backed delivery outperformance should be evaluated separately from structural market-share gains.
UCT 3.0, ENGINEERING CONTENT, AND THE TIMING OF STRUCTURAL UPSIDE
The 8 new program wins across etch, ALD, PVD, lithography, and related subsystem applications provide evidence of progress beyond capacity expansion. A similar number of programs are in development or qualification.
These categories should remain distinct. Awarded programs are not equivalent to current high-volume revenue, and qualification-stage opportunities are not equivalent to awarded business. The call disclosed neither expected program revenue nor probability-weighted conversion.
Management indicated that the new programs would most likely enter meaningful production with customer technology transitions over the next 2 to 3 years. On the current timeline, this places much of the potential contribution in 2028 and 2029 rather than in the immediate Q4 or early-2027 earnings ramp.
The strategic direction was described as moving “from build-to-print to build-to-spec.” Greater design responsibility can deepen qualification dependencies, increase customer switching costs, and improve the opportunity to capture higher-value content.
However, that transition also requires engineering investment, technical accountability, development resources, and potentially greater warranty or performance exposure. Economic returns depend on contract terms and intellectual-property ownership, not simply participation earlier in the design process.
The timing creates a useful analytical separation. Near-term progress toward the 20% gross-margin objective must rely substantially on utilization, existing engineered-product mix, vertical integration, and footprint efficiency. The newly discussed programs offer longer-duration upside, but should not be credited with explaining current-quarter earnings.
The integrated planning platform can improve coordination among demand, inventory, capacity, and suppliers. Its financial contribution remains unquantified. A successful digital transformation should ultimately be visible in better inventory turns, lower expedite costs, improved delivery performance, and less incremental working capital per dollar of growth.
Management also identified potential opportunities in optical inspection and metrology. The call did not establish a named platform award, commercial value, or production date. These opportunities are appropriately treated as optionality rather than included as material near-term revenue.
CUSTOMER CONCENTRATION AND INDUSTRY READ-THROUGHS
The 2 largest customers represented 61% of Q3 revenue. Earlier company filings identified Lam Research and Applied Materials as the leading customers. The current transcript did not disclose their individual Q3 contributions.
The 61% concentration compares with management’s prior-call description of the combined exposure as being in the high-50% range. The current quarter therefore does not demonstrate uninterrupted diversification, even though the longer-term mix may be broader than historical levels.
Customer concentration creates both advantages and risks. Large strategic relationships can support scale, technical collaboration, and forecast visibility. They also concentrate purchasing power and expose Ultra Clean to correlated customer shipment changes, sourcing decisions, and platform transitions.
The principal positive read-through is to the etch and deposition ecosystem. Strong subsystem shipments support the view that leading-edge logic and advanced-memory equipment demand is translating into physical production activity. However, Ultra Clean’s 17.7% sequential growth should not be directly mapped onto any individual OEM’s quarterly revenue.
Management itself identified differences in mix, shipping flows, recognition, and fiscal calendars. Supplier shipments can lead or lag OEM revenue. The call is therefore more informative about aggregate supply-chain activity than about a precise quarterly earnings revision for Lam Research or Applied Materials.
The evidence also supports strong demand for critical component suppliers, including MFC vendors. But shortages do not establish which suppliers will capture incremental share or margins, and no specific supplier economics were disclosed.
Services commentary provides a later-cycle read-through to wafer utilization rather than an immediate confirmation of higher current wafer starts. The distinction matters because equipment orders, fab completion, tool qualification, and volume production occur at different points in the investment cycle.
Portfolio exposure would remain concentrated in AI-related semiconductor capital spending, advanced-node investment, and memory capacity. Adding Ultra Clean alongside equipment OEMs and memory-related holdings would increase exposure to the same underlying capital cycle rather than provide meaningful diversification. Actual marginal concentration cannot be quantified without a portfolio inventory.
GAAP EARNINGS QUALITY AND DISCLOSURE LIMITATIONS
GAAP net income attributable to Ultra Clean was $39.1 million, compared with adjusted net income of $53.2 million. The $14.1 million difference represented approximately 26.5% of adjusted earnings.
Adjusted operating income exceeded GAAP operating income by $14.9 million. The largest adjustments were $6.8 million of acquired-intangible amortization and $6.9 million of stock-based compensation, supplemented by restructuring and legal-related items.
Acquired-intangible amortization is noncash in the current period, but stock-based compensation remains an economic cost to shareholders. Adjusted EPS should therefore not be treated as equivalent to cash earnings available for distribution.
The sequential GAAP EPS increase also benefited from a smaller tax valuation-allowance adjustment. The release identifies a $12.1 million adjustment in Q2 versus approximately $0.1 million in Q3. Consequently, the increase from $0.19 to $0.85 in GAAP EPS overstates the improvement in recurring operating performance relative to the adjusted increase from $0.70 to $1.15.
Several material disclosures remain absent: quantified backlog, customer commitment duration, inventory cancellation protection, facility-level utilization, expansion return thresholds, total future capital expenditures, and a dated cash-conversion target. These omissions do not establish weakness, but constrain confidence in a precise long-term valuation.
The source transcript is explicitly an initial draft and contains transcription and speaker-attribution inconsistencies. The numerical analysis relies on company release tables where available. Unresolved references to specific new fab announcements and garbled technical labels are not treated as independently verified investment evidence.
ILLUSTRATIVE EARNINGS SCENARIOS AND VALUATION
The operating outlook warrants scenario analysis because relatively modest changes in revenue, gross margin, and diluted shares produce substantial differences in earnings. The following 2027 cases are analytical assumptions, not management guidance or verified consensus estimates.
A base case with a 50% probability assumes $3.8 billion of revenue, 18.5% adjusted gross margin, and $300 million of adjusted operating expenses. This produces approximately $403 million of operating income, or a 10.6% margin. Assuming a 20% tax rate, approximately neutral net nonoperating income, $8 million of annual noncontrolling interests, and 50 million diluted shares produces approximately $6.29 of adjusted EPS. This case assumes strong growth and continued leverage without immediate achievement of the 20% gross-margin target.
A bull case with a 25% probability assumes $4.3 billion of revenue, 20.0% gross margin, and $320 million of operating expenses. Operating income reaches approximately $540 million, or a 12.6% margin. With the same tax and noncontrolling-interest assumptions and 52 million diluted shares to allow for greater dilution, adjusted EPS is approximately $8.15. This requires successful capacity optimization, favorable mix, sustained customer demand, and realization of the margin target.
A bear case with a 25% probability assumes $3.2 billion of revenue, 16.0% gross margin, and $290 million of operating expenses. Operating income declines to approximately $222 million, or a 6.9% margin. With a 20% tax rate, neutral net nonoperating income, $8 million of noncontrolling interests, and 50 million diluted shares, adjusted EPS is approximately $3.39. This reflects weaker customer conversion and underutilization rather than a complete collapse in semiconductor investment.
Illustrative valuation multiples of 18 times base-case EPS, 20 times bull-case EPS, and 14 times bear-case EPS produce equity values of approximately $113, $163, and $47 per share, respectively. The multiples are assumptions rather than verified peer benchmarks. The probability-weighted value is approximately $109.
At an illustrative $80 entry price, close to the disclosed historical ATM transaction prices, those values imply approximately 41% base-case upside, 104% bull-case upside, and 41% bear-case downside. The probability-weighted return is approximately 37%. The $80 reference is not a verified current market quotation.
The scenario framework highlights both the opportunity and the risk. Attractive potential upside depends on a credible margin trajectory and continued revenue conversion. The downside is substantial even without an extreme industry contraction. The framework also excludes full deployment of the remaining ATM authorization; additional issuance without a proportional earnings contribution would reduce per-share value.
INVESTMENT ACTION, CATALYSTS, AND RISK PARAMETERS
The earnings call supports a conditional accumulate stance at valuations around $80 or below, rather than an unconditional purchase recommendation at an unverified current price. At that reference level, the stock would trade at approximately 16.3 times annualized Q4 midpoint adjusted EPS and approximately 12.7 times the illustrative 2027 base-case EPS.
Given the cash-conversion risk, an initial position of approximately 0.5% of portfolio net asset value is more appropriate than a full-sized cyclical exposure. Expansion toward 1.0% would require evidence that operating cash flow is improving, inventory intensity is controlled, and margin progression survives the capacity ramp.
A 15% price-based stop would imply approximately 7.5 basis points of portfolio loss at a 0.5% position and 15 basis points at a 1.0% position, excluding gaps and execution effects. The illustrative bear-case decline would instead cost approximately 20 basis points and 41 basis points, respectively. Position sizing should therefore be governed by stressed downside as well as the stop level.
The principal near-term catalyst is delivery of the Q4 revenue and earnings outlook. The next operational milestone is the availability and qualification of approximately $4 billion of annual capacity in Q1 2027. Supply-chain normalization over the next 1 to 2 quarters would reduce execution risk, although it could also reveal the extent of precautionary inventory demand.
During 2027, the decisive catalysts are progress toward higher gross margins, evidence of operating cash generation, and confirmation that customer spending supports the expanded footprint. Services acceleration during 2027 and 2028 provides a secondary earnings driver. The newly awarded engineering programs are longer-duration catalysts, with more meaningful potential contributions during 2028 and 2029.
Mandatory review triggers include a revenue miss against the $800 million Q4 floor, worsening inventory intensity over successive quarters, continued operating cash outflows without a credible improvement path, material program delays, or evidence that expansion is proceeding without adequate customer demand.
An exit would be warranted if the investment thesis shifts from financing profitable growth to financing excess capacity and inventory, if customer demand revisions undermine the $4 billion capacity economics, or if dilution persistently absorbs the operating gains. A valuation approaching the approximately $113 base-case value without corresponding earnings upgrades would justify reassessment or profit-taking rather than automatic extrapolation toward the bull case.
Overall, Q3 materially improves confidence in Ultra Clean’s ability to execute a rapid manufacturing ramp. It does not yet establish that the company can deliver the same degree of improvement in free cash flow or returns on incremental capital. The most important investment question has shifted from whether the company can meet demand to whether that demand can be converted into durable, cash-generative, per-share earnings growth.
SOURCE BASIS
The analysis uses the October 27, 2026 initial-draft earnings-call transcript and supplied Bloomberg consensus notice, Ultra Clean’s Q3 and Q2 2026 earnings releases, the August 3, 2026 earnings-call transcript, relevant financing disclosures and Q1 filing passages, and SEMI’s published 2026 mid-year equipment forecast. Calculated measures, scenario probabilities, valuation multiples, and portfolio parameters are analytical assumptions rather than company guidance.
COMPANY EMPLOYEES ON THE CALL
• James Xiao, Chief Executive Officer. • Michael Keogh, Chief Financial Officer. • Rhonda Bennetto, Senior Vice President, Investor Relations.
RESEARCH ANALYSTS ON THE CALL
• Timothy Arcuri, UBS. • Charles Shi, Needham. • Robert Mertens, TD Cowen, speaking on behalf of Krish Sankar. • Edward Yang, Oppenheimer. • Ben Taxdahl, Craig-Hallum Capital Group, speaking on behalf of Christian Schwab.
Key Read-Throughs
KEY READ-THROUGHS FROM ULTRA CLEAN HOLDINGS’ Q3 2026 EARNINGS CALL
Ultra Clean’s results provide strong evidence that AI-related semiconductor investment is translating into physical equipment production, rather than remaining a backlog or capital-budget narrative. The most actionable implications are positive for critical process-control components, etch and deposition equipment, and advanced-node materials. The principal negative implications concern shipment timing and the financing burden imposed on subsystem manufacturers: strong demand does not guarantee complete equipment deliveries, positive free cash flow, or proportionate per-share earnings growth. The call also reinforces an important sequencing distinction. Equipment shipments are accelerating now, while the larger wafer-production and consumables benefits develop through 2027 and 2028. Several conclusions corroborate disclosures already made by equipment companies and should not be treated as entirely new information. Magnitude assessments below refer to fundamental exposure and potential estimate sensitivity, not predicted share-price movements. Countries identify the primary listing markets of the specified securities.
CRITICAL COMPONENTS AND PROCESS CONTROL
MASS-FLOW-CONTROLLER TIGHTNESS FAVORS QUALIFIED COMPONENT SUPPLIERS, NOT NECESSARILY SUBSYSTEM ASSEMBLERS (READ-THROUGH 1)
Affected companies: HORIBA (6856: Japan) and MKS (MKSI: United States). Direction: positive for demand, capacity utilization, and revenue visibility. Magnitude: potentially material for HORIBA’s semiconductor earnings and moderate at the MKS consolidated level; insufficient evidence for a quantified pricing or market-share benefit.
Call evidence: Management expects mass-flow-controller constraints to persist for approximately 1 to 2 quarters. Ultra Clean increased inventory by $93.4 million sequentially to $723.3 million, explicitly describing advance purchases of critical components and elevated safety stock. Products revenue increased 19.1% sequentially, driven primarily by etch and deposition for gate-all-around and HBM applications.
The transmission mechanism is direct. These processes require precise, repeatable delivery of process gases, creating demand for qualified MFCs as equipment production expands. HORIBA STEC and MKS manufacture these products. The economically relevant distinction is between owning critical component technology and integrating purchased components into a larger subsystem. Component suppliers can benefit from higher factory throughput and stronger order visibility, while integrators may need to finance larger inventories simply to maintain delivery performance.
HORIBA is particularly relevant because its Materials & Semiconductor business generated approximately ¥30.1 billion of operating profit against approximately ¥30.4 billion for the group in 1H 2026. MFCs represent only part of that business, but semiconductor conditions are clearly important to consolidated earnings. HORIBA’s newly operational Kyoto Fukuchiyama factory also provides a concrete supply-response mechanism: the company states that domestic MFC capacity can eventually expand to approximately 3 times the previous level. That is future scalable capacity, not an immediate increase in qualified shipments.
MKS offers broader exposure across flow control, vacuum, plasma, and power delivery. Its semiconductor revenue reached $554 million in Q2, and its existing Q3 outlook called for approximately $630 million. Ultra Clean’s results corroborate that demand trajectory. However, MKS previously described its own lead times as relatively normal. Ultra Clean’s industry-level shortage commentary therefore does not establish that MKS is supply constrained or that either supplier is responsible for the bottleneck.
The near-term catalyst is MKS’s November 4 results release and November 5 conference call, particularly shipment conversion, component availability, and subsequent-quarter guidance. For HORIBA, the next quarterly disclosure and progress in qualifying and utilizing Fukuchiyama capacity are the relevant checkpoints. The longer-duration positive is increasing process-control content and qualified production capacity. The key restraint is that a shortage expected to normalize within 1 to 2 quarters does not justify assuming persistent scarcity pricing.
SEMICONDUCTOR CAPITAL EQUIPMENT
PHYSICAL SUBSYSTEM SHIPMENTS VALIDATE THE ETCH AND DEPOSITION INVESTMENT CYCLE (READ-THROUGH 2)
Affected companies: Lam Research (LRCX: United States) and Applied Materials (AMAT: United States). Direction: positive for equipment demand and production visibility. Magnitude: high underlying business relevance, but only moderate incremental information because the broader demand acceleration is already partly disclosed.
Call evidence: Ultra Clean’s Products revenue increased 19.1% sequentially to $681.9 million, with management specifically attributing the increase to “strength in etch and deposition supporting gate-all-around and high-bandwidth memory.” Its 2 largest customers represented 61% of revenue. Earlier company filings identify Lam Research and Applied Materials as its largest customers. Q4 consolidated revenue guidance implies another 9.4% sequential increase at the midpoint.
This is stronger evidence than a generic statement about AI spending. Ultra Clean is manufacturing and shipping subsystems that enter equipment production. Higher shipments therefore corroborate actual OEM manufacturing activity and the conversion of customer investment plans into equipment builds.
The product mix is important. Gate-all-around and advanced-memory transitions increase the importance of materials engineering, deposition, and selective removal. Lam and Applied can benefit from both additional manufacturing capacity and greater process intensity. The call supports the direction of those demand drivers, although it does not quantify either company’s incremental tool content or market share.
The trading relevance differs between the companies. Lam had already reported its September quarter on October 21 and guided December-quarter revenue to $8.6 billion, plus or minus $400 million. Ultra Clean’s call is principally confirmation of Lam’s previously disclosed demand environment, not a prediction of an unreported September result. Applied’s November 12 earnings call is the more immediate forthcoming OEM catalyst, with particular relevance to semiconductor systems demand and manufacturing readiness.
The longer-duration benefit is improved confidence in 2027 equipment production. Ultra Clean accelerated approximately $4 billion of annual revenue capacity to Q1 2027, reducing a potential subsystem-level constraint on customer growth. Its expansions in Malaysia, the Philippines, Singapore, and the Czech Republic indicate investment in the equipment supply chain’s manufacturing footprint. They do not identify the locations of incremental chip-fabrication spending.
The principal limitation is attribution. Ultra Clean explicitly stated that customer revenue can diverge quarter to quarter because of product mix, shipping flows, recognition, and fiscal calendars. Its 19.1% Products growth should not be applied mechanically to either OEM’s reported revenue.
STRONG DEMAND CAN COEXIST WITH EQUIPMENT SHIPMENT DISAPPOINTMENTS (READ-THROUGH 3)
Affected companies: Lam Research (LRCX: United States), Applied Materials (AMAT: United States), and ASM International (ASM: Netherlands). Direction: negative for near-term delivery certainty and cash-conversion timing, without evidence of deteriorating end demand. Magnitude: moderate quarterly execution risk, potentially significant where a missing component prevents shipment of a high-value system.
Call evidence: Ultra Clean acknowledged ongoing MFC constraints and increasing supply-chain pressure. Oppenheimer specifically asked whether shortages elsewhere could prevent customers from completing equipment even when Ultra Clean delivers on time. Management responded that this was not currently affecting its shipments. The CFO also stated, “We didn’t miss a shipment.”
That statement establishes Ultra Clean’s delivery performance, not complete-system readiness at its customers. Equipment shipments depend on a complete set of qualified components and subsystems. A relatively low-value missing component can delay recognition of a much higher-value finished tool, increase work-in-process inventory, and defer cash collection.
This creates an important distinction between demand risk and timing risk. Supplier revenue can be strong while an OEM accumulates incomplete systems. Conversely, a later recovery in equipment shipments can reflect completion of previously constrained tools rather than a fresh increase in end demand. Quarter-to-quarter revenue surprises therefore require examination of component availability and deferred shipments, not just order commentary.
The risk is corroborated by ASM’s October 27 release, which described increasingly tight supply-chain conditions while guiding to substantial growth. Ultra Clean’s successful execution does not eliminate ASM’s stated constraint, and it should not be used to dismiss similar risks at other OEMs.
The near-term window is Q4 2026 through Q1 2027, consistent with Ultra Clean’s expected duration of MFC tightness. Applied’s November 12 results and ASM’s October 28 call are immediate checkpoints for the size of any shipment constraints. For Lam, the next quarterly report should distinguish actual delivery performance from the demand assumptions already embedded in its December guidance.
The longer-duration implication is that supply normalization could release delayed revenue and improve working-capital conversion. There is no basis in this call to characterize potential delays as canceled demand or to impose a specific revenue reduction on any OEM.
ATOMIC-LAYER DEPOSITION HAS A STRUCTURAL CONTENT OPPORTUNITY BEYOND THE GENERAL EQUIPMENT UPSWING (READ-THROUGH 4)
Affected company: ASM International (ASM: Netherlands). Direction: positive. Magnitude: high fundamental relevance to 2027 growth, but low incremental surprise from Ultra Clean alone because ASM released stronger company-specific evidence earlier on October 27.
Call evidence: Ultra Clean identified gate-all-around as a primary driver of Products growth and disclosed 8 new programs spanning etch, ALD, PVD, lithography, and associated subsystems. Management also described moving “from build-to-print to build-to-spec,” reflecting greater engineering involvement in customer technology transitions.
The transmission mechanism is increased process complexity rather than equipment volume alone. Gate-all-around manufacturing requires tightly controlled deposition across complex structures, supporting the importance of ALD and related materials-engineering steps. ASM’s exposure is therefore to both expanding leading-edge capacity and increasing served content as customers transition between nodes.
ASM’s own same-day release provides the necessary company-specific verification. It projected 2027 revenue above €5.7 billion and confirmed a solid double-digit increase in its served available market at 1.4nm versus 2nm, together with higher market share. Ultra Clean’s shipment growth and engineering engagements corroborate the physical supply-chain preparation underlying that outlook.
The distinction between present revenue and future programs is critical. Ultra Clean indicated that recently won programs would generally reach meaningful production with customer transitions over the next 2 to 3 years. Those wins are not evidence that ASM has received an additional near-term order, nor can they all be assigned to ASM. The stronger near-term evidence is current gate-all-around-related shipment growth.
The immediate catalyst is ASM’s October 28 earnings call, particularly discussion of the 2027 revenue outlook, supply constraints, and node-transition timing. The longer-duration benefit is higher process content through successive gate-all-around generations. The principal risk is a shift in customer ramp timing, not a demonstrated weakening in the relevance of ALD.
SUBSYSTEM MANUFACTURING AND OUTSOURCED PRODUCTION
THE EQUIPMENT BOOM IS NOT AUTOMATICALLY A FREE-CASH-FLOW BOOM FOR INTEGRATORS (READ-THROUGH 5)
Affected company: Ichor Holdings (ICHR: United States). Direction: negative for cash-conversion assumptions and valuation based solely on adjusted EPS growth; positive demand conditions remain intact. Magnitude: material to equity valuation and capital efficiency, but not evidence of an imminent liquidity problem.
Call evidence: Ultra Clean reported negative $42.3 million of operating cash flow despite record revenue and $53.2 million of adjusted net income. Inventory reached $723.3 million, and approximately $203.1 million of net equity proceeds were raised during Q3 and the opening week of Q4. Management described capacity and inventory commitments ahead of customer demand, but did not disclose binding minimum-purchase commitments or customer-funded expansion guarantees.
The transmission mechanism applies directly to Ichor’s fluid-delivery subsystem model. Purchased components and work-in-process must be funded before completed subsystems are delivered and customer payments are collected. Rapid revenue growth can therefore improve reported margins while increasing the cash tied up in operations. Advance purchases that protect shipments also increase exposure to customer schedule changes.
This is not an unsupported transfer of Ultra Clean’s cash performance to a peer. Ichor’s own Q2 disclosure reported $15.9 million of operating cash outflow and $7.8 million of capital expenditure. It also completed an approximately $200 million ATM program, generating roughly $195 million of net proceeds. The common evidence supports a genuine business-model issue: parts of the subsystem supply chain are financing the equipment ramp through shareholder capital.
There is important counterevidence against a liquidity-bearish interpretation. Ichor ended Q2 with approximately $256 million of cash and $120.6 million of debt. Its completed financing provides substantial capacity to support growth. Ultra Clean’s subsequent equity issuance does not establish that Ichor needs another offering.
Ichor’s November 2 earnings release is the immediate catalyst. The critical variables are operating cash flow, inventory turns, component availability, and whether gross-margin improvement translates into per-share value after the completed dilution. Ichor had also disclosed a Q2 revenue delay caused by isolated part shortages that were subsequently resolved. That history increases the relevance of supply-chain execution, but does not establish a new delay.
Over a longer horizon, successful growth requires returns on inventory, capacity, and engineering investment to exceed the cost of the capital deployed. The call favors distinguishing proprietary component and process-technology economics from assembly economics, rather than valuing every participant in the equipment cycle on comparable revenue-growth or EPS-growth multiples. Ultra Clean’s program wins do not, by themselves, prove that Ichor is losing share.
SEMICONDUCTOR MATERIALS, FILTRATION, AND FAB CONSUMABLES
THE WAFER-START LAG CREATES A LATER GROWTH PHASE FOR ADVANCED MATERIALS (READ-THROUGH 6)
Affected company: Entegris (ENTG: United States). Direction: positive for the duration and breadth of growth into 2027 and 2028; only modest evidence for an immediate quarterly upside surprise. Magnitude: moderate to high fundamental relevance because both capital-spending-related and wafer-production-related businesses participate.
Call evidence: Ultra Clean’s Services revenue increased 6.7% sequentially, compared with 19.1% Products growth. Management explained that Services growth generally lags Products because it is tied to wafer starts, with larger contributions from new U.S. fabs expected during 2027 and 2028.
The transmission mechanism separates equipment installation from recurring consumption. Fab construction and equipment deployment initially support products such as wafer-handling containers, gas filtration, and purification systems. Subsequent increases in wafer starts support recurring demand for liquid filtration, CMP materials, deposition materials, and selective-etch chemistries.
Entegris has exposure to both phases. Its latest reported quarter showed approximately 15% year-over-year growth in capital-spending-related revenue and 10% growth in unit-driven revenue. Management also described a record liquid-filtration quarter and increasing materials intensity at advanced nodes. Ultra Clean’s call therefore reinforces the possibility of sequential growth drivers rather than a single equipment-order peak.
The non-obvious implication is that a slower growth rate in wafer-utilization-linked businesses today is not necessarily evidence that the broader investment cycle is failing. The equipment is being built before the associated fabs reach meaningful production. Conversely, strong equipment shipments should not be translated into an immediate proportional increase in Entegris’s consumables revenue.
The near-term catalyst is Entegris’s October 29 earnings release, with particular emphasis on the relative performance of capital-spending-related and unit-driven businesses. The longer-duration catalysts are customer qualification, higher fab utilization, and advanced-node production ramps during 2027 and 2028.
The U.S. fab commentary is a timing signal, not an awarded-contract disclosure. No particular Entegris contract can be inferred from Ultra Clean’s geographic observations. Moreover, Entegris’s own recent cash-generation performance was stronger than Ultra Clean’s. The subsystem financing burden should not be generalized to all materials suppliers.
MEMORY AND HBM
ACCELERATING EQUIPMENT SPENDING DOES NOT ESTABLISH AN IMMINENT DRAM SUPPLY GLUT (READ-THROUGH 7)
Affected company: Micron Technology (MU: United States). Direction: positive for the durability of near-term supply discipline and pricing conditions, with longer-term capacity additions creating a separate risk. Magnitude: potentially high for earnings sensitivity, but modest incremental information because Micron has already discussed the supply timeline.
Call evidence: Ultra Clean stated that memory manufacturers are adding cleanroom space and fab capacity for DRAM and next-generation HBM. Memory represented 34% of Ultra Clean’s revenue. At the same time, management placed the larger wafer-start-related Services contribution in 2027 and 2028 rather than in the current equipment ramp.
The transmission mechanism is the delay between capital commitment and saleable memory output. Equipment orders must be followed by delivery, installation, qualification, process ramp, and yield improvement. HBM production also depends on advanced packaging capacity. Equipment revenue is therefore not a reliable direct proxy for near-term commodity DRAM bit supply.
Micron’s latest call provides the company-specific timing evidence. ID1 and Tongluo contributions are expected during 2027, while ID2 and the Japanese DRAM expansion are associated with late-2028 initial output. Micron also stated that production from new facilities becomes more meaningful only several quarters after initial output. Ultra Clean’s strong subsystem shipments are consistent with that investment sequence, not evidence that all associated capacity is immediately available.
The high-conviction implication is that strong WFE spending alone is insufficient grounds for a near-term memory-pricing downgrade. The physical supply response remains staged, and new capacity can be absorbed by HBM requirements, node transitions, and demand growth. The call does not provide the wafer, yield, product-mix, or bit-output denominators necessary to calculate incremental DRAM supply.
The next Micron quarterly update is the near-term checkpoint for pricing, customer commitments, and the distinction between construction expenditure and productive equipment deployment. Through 2027, the relevant fundamental catalyst is the conversion of existing projects into qualified output. During 2028 and beyond, broader capacity additions become a more substantive risk to supply discipline if demand disappoints.
This is not a claim that memory pricing must keep rising or that future oversupply is impossible. It is a rejection of the immediate causal shortcut from stronger equipment shipments to weaker memory earnings. The call supports a long construction and qualification cycle, while leaving the eventual supply-demand balance unresolved.
Report record
- Sector
- Information Technology
- Industry
- Semiconductors & Semiconductor Equipment
- Fiscal period end
- September 30, 2026
- Report date
- October 27, 2026
- Analysis
- 6277 words
- Read-throughs
- 2748 words
- Content fingerprint (PDF)
500ad182c8f1- Content fingerprint (analysis)
7c11f3b56e85- Content fingerprint (read-throughs)
b453f6762dc4
Prepared from the company's earnings release and earnings call transcript. Figures as reported by the company. For information only. Not investment advice.
More from Ultra Clean Holdings, Inc.
No other reports yet.
All Ultra Clean Holdings, Inc. reports
More in Information Technology
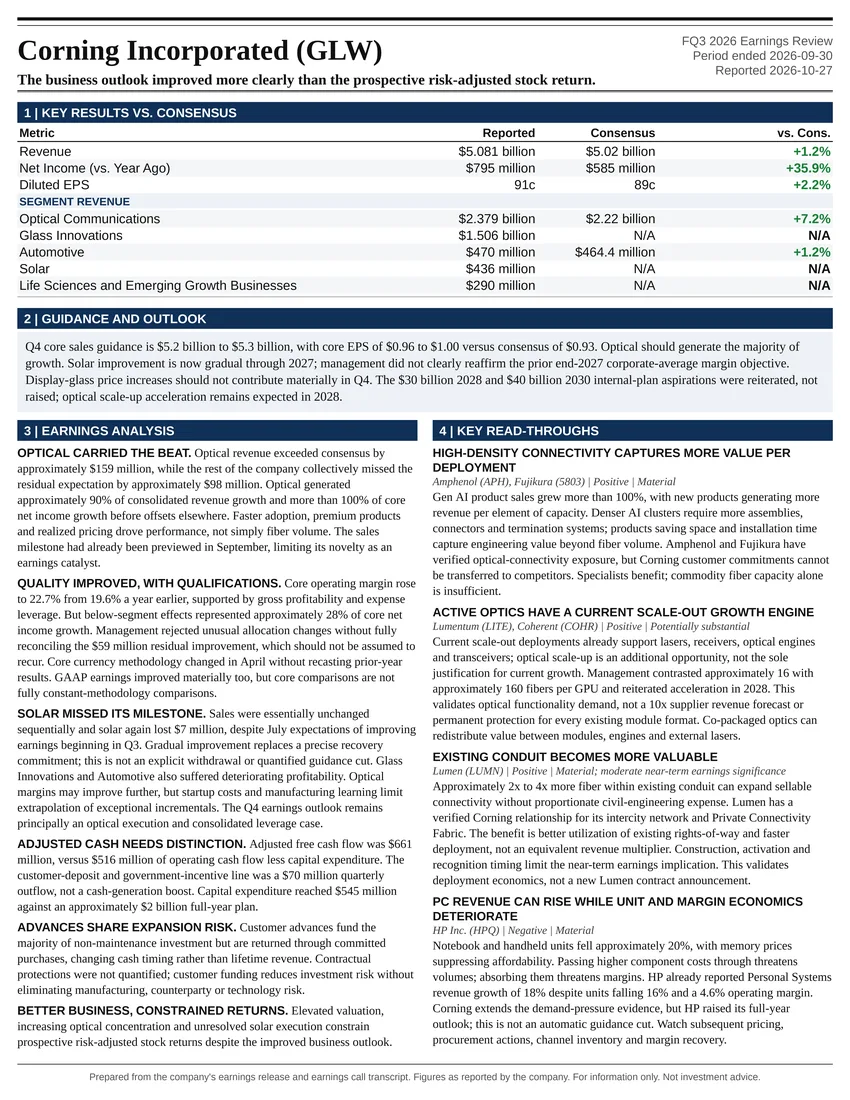
The business outlook improved more clearly than the prospective risk-adjusted stock return.
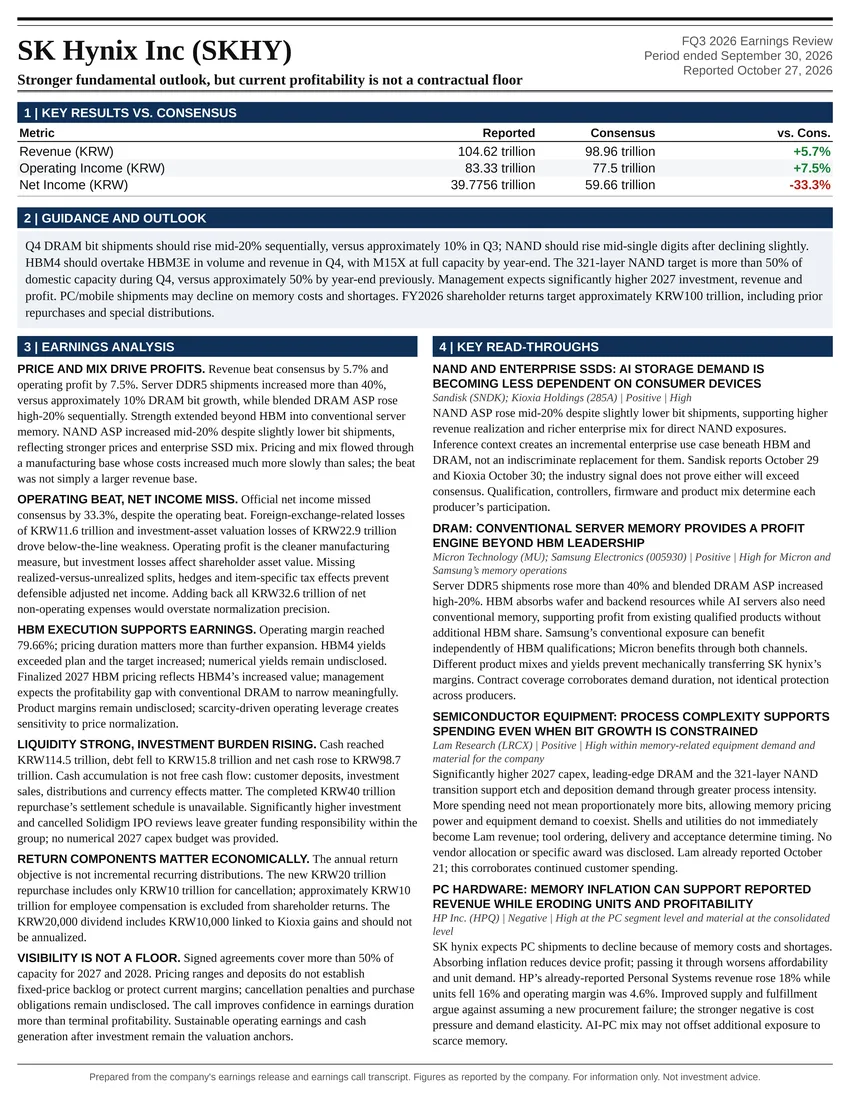
Stronger fundamental outlook, but current profitability is not a contractual floor
All Information Technology reports
Follow @AtlasPeakRes on X for new earnings reports as they publish.