A Larger and More Profitable Equipment Franchise, Not Yet a Cash-Generative Platform
Earnings Reports
Union Pacific Corp FQ3 2026 Earnings Report
Union Pacific Corp (UNP) FQ3 2026 earnings: Standalone Execution Improved; the Merger Case Remains Unresolved. Full earnings analysis, key read-throughs, and the one-page exhibit from Atlas Peak Research.
Union Pacific Corp (UNP)
Sector: Industrials · FQ3 2026 · Period end September 30, 2026 · Reported October 22, 2026
Union Pacific’s Q3 2026 results strengthen the standalone operating thesis but do not establish a comparably strong case for an immediate valuation re-rating.
Download the one-page report (PDF)
View one-page exhibit
Download analysis (.md)
Download read-throughs (.md)
Post to X
One-Page Exhibit
Earnings Analysis
EXECUTIVE CALL SUMMARY: Union Pacific Corporation (10/22/26)
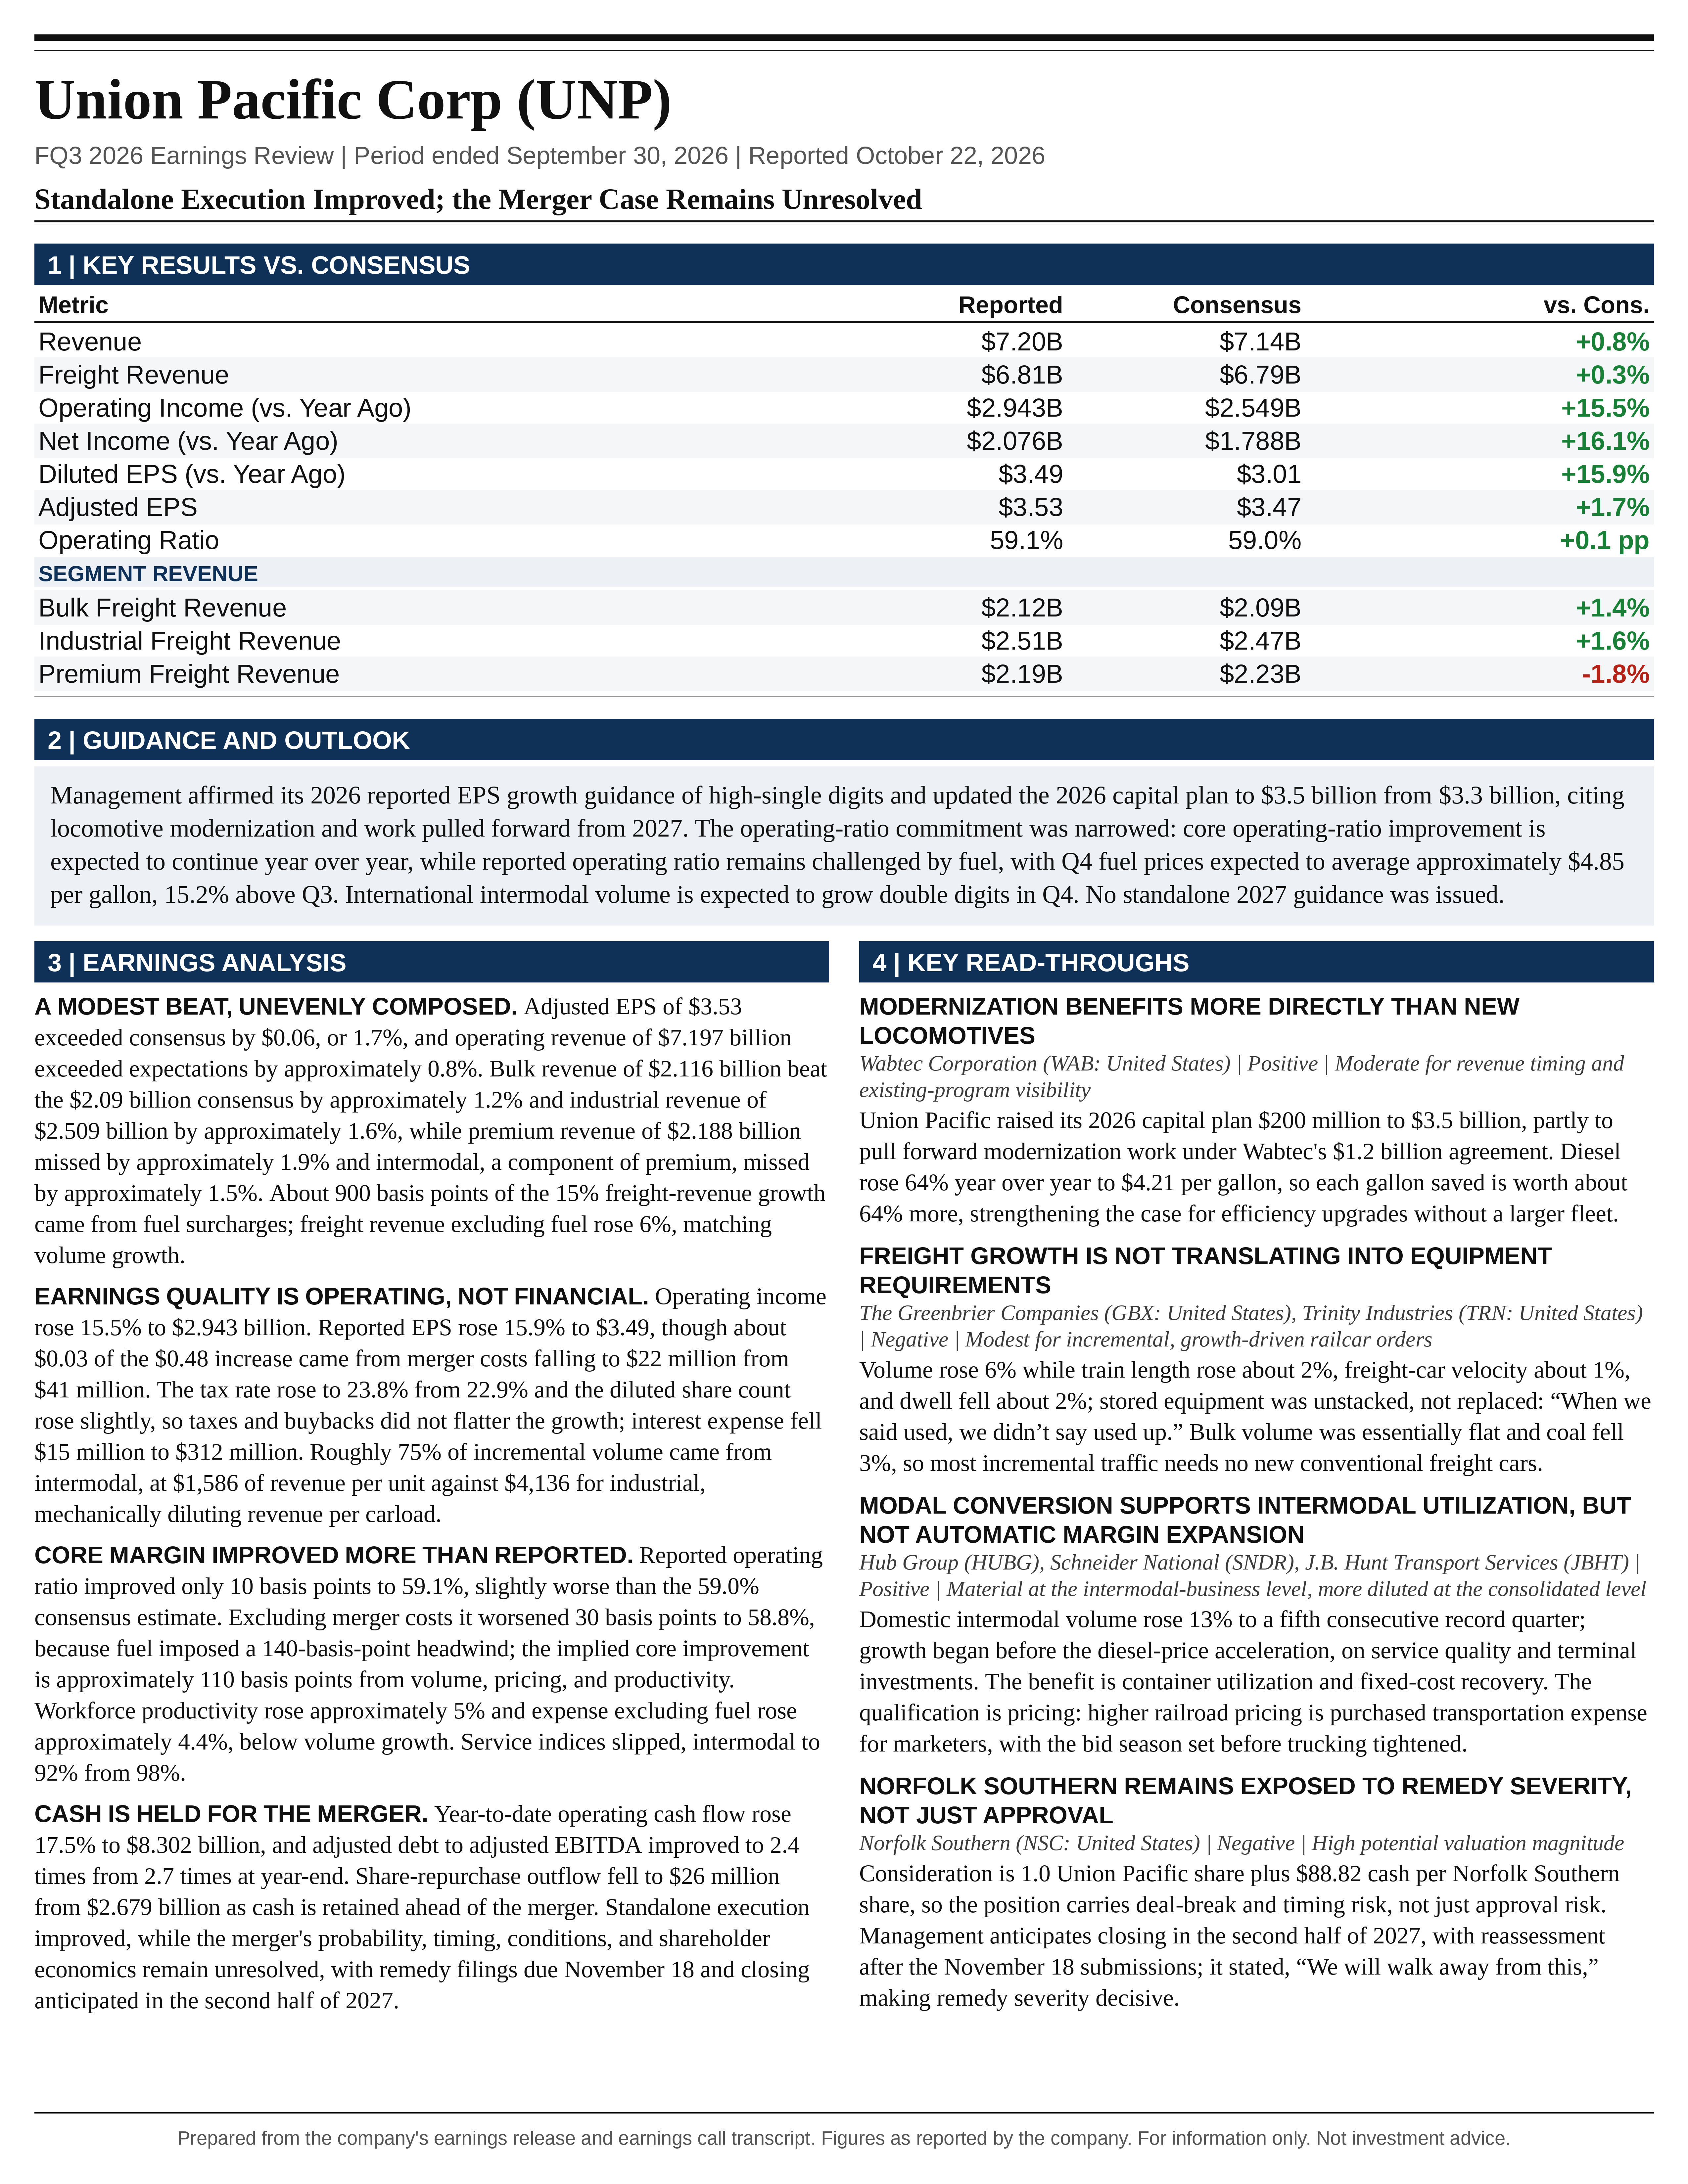
Union Pacific’s Q3 2026 results strengthen the standalone operating thesis but do not establish a comparably strong case for an immediate valuation re-rating. The appropriate investment stance is HOLD, with selective accumulation contingent on a valuation that remains attractive without Norfolk Southern merger benefits. Adjusted EPS of $3.53 exceeded Bloomberg consensus by $0.06, or 1.7%, while operating revenue of $7.197 billion exceeded expectations by approximately 0.8%. The more consequential development was the combination of 6% volume growth, approximately 110 basis points of fuel-neutral core operating-ratio improvement, and continued workforce productivity gains. These results demonstrate that the railroad can accommodate meaningful incremental demand without proportionate increases in its principal operating resources.
The headline results nevertheless require substantial qualification. Approximately 900 basis points of freight-revenue growth came from higher fuel surcharges, while freight revenue excluding fuel increased 6%. Reported operating ratio improved only 10 basis points to 59.1%, slightly worse than the 59.0% consensus estimate. Merger-adjusted operating ratio deteriorated 30 basis points to 58.8%, with higher fuel prices accounting for a 140-basis-point adverse effect. The underlying business improved considerably more than the reported margin suggests, but neither the 15% revenue increase nor the record earnings should be interpreted as evidence of equivalent acceleration in underlying pricing.
The outlook was constructive but not materially upgraded. Management maintained its forecast for high-single-digit reported EPS growth in 2026, despite the Q3 earnings beat and stronger volume trends. The capital plan increased from $3.3 billion to $3.5 billion, and the formal operating-ratio outlook became more qualified: improvement is now explicitly associated with the core business, while reported operating ratio remains challenged by fuel. Q4 fuel prices are expected to average approximately $4.85 per gallon, 15.2% above Q3. Continued year-over-year core margin improvement therefore remains compatible with sequential deterioration in reported operating ratio.
The principal earnings opportunity is a transition from volume-led growth in 2026 to a potentially stronger combination of volume, pricing, and productivity in 2027. Management indicated that the improvement in trucking conditions arrived after much of the current intermodal bid season had already been completed. Contract renewals in late 2026 and early 2027 provide a credible mechanism for improved pricing realization. However, neither the magnitude of those increases nor their conversion into segment profitability was quantified.
The merger remains an important source of strategic upside and a separate source of substantial risk. Management’s confidence in approval is significantly stronger than the regulatory evidence warrants. The Surface Transportation Board’s procedural schedule establishes a review process, not a favorable decision. Moreover, the Canadian Pacific-Kansas City Southern precedent cited on the call was assessed under an exemption from the more demanding 2001 merger rules applicable to Union Pacific-Norfolk Southern. The strongest investment conclusion is therefore that standalone execution has improved, while the probability, timing, conditions, and shareholder economics of the merger remain unresolved.
RESULTS RELATIVE TO EXPECTATIONS AND HISTORICAL PERFORMANCE
The earnings beat was genuine but modest. The Bloomberg notice explicitly corrected the estimate comparison to adjusted EPS, making $3.53 versus $3.47 the appropriate measure. Comparing reported EPS of $3.49 with the adjusted consensus would understate the actual surprise and mix incompatible accounting bases. Reported EPS increased 15.9% from $3.01, while adjusted EPS increased 14.6% from $3.08. Reported net income increased to $2.076 billion from $1.788 billion, and adjusted net income increased to $2.098 billion from $1.829 billion.
The distinction between reported and adjusted growth primarily reflects lower acquisition-related expense. Q3 merger costs declined to $22 million from $41 million, reducing the EPS adjustment from $0.07 to $0.04. Approximately $0.03 of the $0.48 reported EPS increase therefore came from lower merger expense rather than recurring operating improvement. This is a favorable comparison, but it is not the principal driver of the quarter.
Operating income increased 15.5% to $2.943 billion from $2.549 billion. Excluding acquisition-related expense, operating income increased 14.5% to $2.965 billion from $2.590 billion. The business generated $394 million of additional reported operating income on $953 million of additional revenue, implying an approximately 41.3% reported incremental operating margin. That calculation demonstrates substantial incremental earnings generation, but it is not a clean measure of incremental freight economics because fuel surcharges materially increased both revenue and expense.
The results were not flattered by a lower tax rate or a shrinking quarterly share count. The reported effective tax rate increased to 23.8% from 22.9%, while diluted weighted-average shares increased approximately 0.2% to 594.5 million. Interest expense declined $15 million to $312 million, providing a modest benefit, while other income was essentially unchanged at $95 million. Operating performance, rather than tax benefits or repurchases, explains most of the earnings improvement. This supports the quality of the growth even though the magnitude of the consensus beat was limited.
Revenue performance was uneven across the business groups. Bulk freight revenue of $2.116 billion exceeded the $2.09 billion consensus by approximately 1.2%, and industrial revenue of $2.509 billion exceeded the $2.47 billion estimate by approximately 1.6%. Premium revenue of $2.188 billion missed the $2.23 billion estimate by approximately 1.9%. Within premium, intermodal revenue of $1.517 billion missed the $1.54 billion estimate by approximately 1.5%. Intermodal is a component of premium, so those misses must not be added together.
This distribution matters because the fastest-growing business was not the strongest source of positive surprise. Premium and intermodal delivered substantial year-over-year growth but still fell short of revenue expectations. Meanwhile, average revenue per carload of $2,971 was approximately 0.4% below consensus, despite being 8.4% higher year over year. Revenue ton-miles exceeded expectations by approximately 0.5%, while fuel expense was approximately 3% above expectations. The quarter was therefore characterized by strong activity, some yield disappointment, and higher fuel costs rather than an across-the-board upside surprise.
The revenue and operating-ratio consensus figures imply approximately $2.927 billion of operating income, compared with the actual $2.943 billion. This is an arithmetic approximation rather than a separately supplied consensus estimate, but it suggests that operating-income upside was only approximately 0.5%. The EPS beat should consequently not be extrapolated into a large upward revision to recurring profitability without a more complete consensus bridge.
Sequential performance also improved. Revenue increased 4.9% from Q2, operating income increased 6.5%, reported EPS increased 3.9%, and adjusted EPS increased 3.5%. Reported operating ratio improved from 59.7% to 59.1%, while adjusted operating ratio improved from 59.2% to 58.8%. Freight revenue excluding fuel accelerated from 4% year-over-year growth in Q2 to 6% in Q3. Adjusted EPS growth accelerated from approximately 13% to approximately 15%. These comparisons support improving momentum, although favorable seasonal operating conditions and business mix remain relevant.
REVENUE QUALITY, PRICING, AND THE INTERMODAL MIX EFFECT
The underlying revenue story is materially less inflationary than the headline 15% increase. Freight revenue excluding fuel surcharge increased 6% to approximately $5.6 billion, broadly matching the 6% increase in revenue carloads. At the aggregate level, fuel-excluded revenue per unit was therefore approximately flat. This does not establish that contract pricing was flat. It indicates that positive pricing was offset by adverse mix and potentially other shipment characteristics.
Hamann stated that “our quarterly pricing gains continue to exceed our inflation dollars,” while explaining that nearly 75% of incremental volume came from domestic and international intermodal. The financial tables substantiate that mix explanation. Intermodal volume increased by approximately 96,000 units, compared with a total increase of approximately 130,000 revenue carloads, accounting for roughly 74% of the incremental units.
Intermodal represented approximately 41.7% of revenue units but only 22.3% of freight revenue. Its average revenue per unit was $1,586, compared with $4,136 for industrial traffic and $4,004 for bulk. A greater share of intermodal therefore mechanically depresses aggregate revenue per unit even when individual contracts are repriced favorably. Intermodal containers and trailers are each counted as a revenue carload, which also means that aggregate unit growth is not equivalent to comparable growth in physical tonnage or economic contribution.
The difference between 6% revenue-carload growth, approximately 4% gross-ton-mile growth, and 4.8% revenue-ton-mile growth reinforces this point. Traffic grew, but the shipment mix changed. Simple carload-based operating-leverage calculations can overstate or understate the underlying economic improvement when lighter intermodal shipments account for most of the incremental activity.
The absence of a quantified core-pricing percentage remains a meaningful disclosure limitation. Pricing dollars exceeding inflation dollars is a useful statement about absolute earnings protection, but it does not establish the pricing rate, the size of the net pricing contribution, or the percentage of the revenue base exposed to upcoming renewals. Nor does it prove that pricing alone improved operating ratio, because the relevant revenue and cost denominators differ.
Rocker’s statement that “we’re going to price to what the market can support” was appropriately market-based rather than an assertion of unrestricted pricing power. Management explicitly acknowledged competition from trucking, barges, and alternative sourcing. The service improvements strengthen Union Pacific’s negotiating position, but the realizable price remains bounded by customer alternatives and the value of the full logistics offering.
The most useful forward-looking pricing observation came in response to David Vernon’s question about intermodal profitability. Management indicated that trucking rates and capacity tightened during the spring-to-summer period, after much of the bid season was already established, and anticipated “a better environment for stronger pricing” in late 2026 and the early months of 2027. This provides a specific timing mechanism for better realization. It is more analytically useful than a general assertion that stronger demand should eventually lift prices.
The investment implication is that 2027 could benefit from a lagged pricing catch-up even if volume growth moderates from current rates. However, stronger contract pricing is not automatic. Trucking capacity could recover, diesel prices could decline, competitors could respond aggressively, or customers could retain some of the transportation savings. The call supports a pricing opportunity, not a quantified pricing commitment.
BULK: RESILIENT REVENUE, LIMITED AGGREGATE VOLUME GROWTH
Bulk revenue increased approximately 10% to $2.116 billion, while volume was essentially unchanged at 529,000 carloads. The revenue increase therefore primarily reflected yield, fuel surcharge, and mix rather than broad volume expansion. The apparent resilience is encouraging, but the distinction between nominal revenue growth and underlying demand is especially important in this business group.
Grain and grain-products revenue increased 11% to $1.085 billion, while carloads increased approximately 5%. Strong export grain demand and renewable-fuel-related movements supported growth, partially offset by weaker wheat shipments. This creates a more diversified opportunity than a simple domestic agricultural-volume recovery, encompassing export demand, ethanol, feedstocks, and processing infrastructure.
The associated industrial-development pipeline provides potential medium-term visibility, but different project stages imply different earnings timelines. Facilities entering operation can contribute relatively soon, whereas a groundbreaking, such as the referenced CHS crush facility in Evansville, Wisconsin, is not evidence of imminent material revenue. No quantified contribution or operating start date was provided for these projects. Their value is strategic and potentially durable, but near-term earnings estimates should not assume immediate full utilization.
Coal and renewables volume declined approximately 3%, despite revenue increasing 12%. Lower natural gas prices and elevated inventories remained the stated demand constraints. Management expects these pressures to continue. The revenue growth should not be mistaken for a recovery in coal consumption or utility demand. Higher surcharges and commercial actions can protect revenue while the underlying traffic base contracts.
Fertilizer volume declined approximately 5%, while food and refrigerated volume declined approximately 2%. Those results qualify management’s broader confidence in demand. Bulk was not uniformly strong, and agricultural, utility, and food-related markets were moving in different directions. The investment case rests on portfolio resilience and selective growth opportunities rather than a synchronized improvement across bulk commodities.
INDUSTRIAL: THE STRONGEST EVIDENCE OF FRANCHISE-SPECIFIC GROWTH
Industrial revenue increased approximately 14% to $2.509 billion on approximately 6% volume growth. All major industrial commodity categories increased volume, supporting management’s assertion that business development and service improvements are generating results beyond the underlying macroeconomic environment.
Metals and minerals volume increased approximately 8%, supported by construction projects in Louisiana and Texas and strength in domestic steel production. Energy and specialized markets volume increased approximately 7%, reflecting petroleum, nonmetallic minerals, government, and waste-related opportunities. Forest-products volume increased approximately 4%, and industrial chemicals and plastics increased approximately 2%.
Industrial revenue ton-miles grew approximately 9%, faster than industrial carloads. This indicates that shipment weight, distance, or both contributed to the economic mix, although the disclosures do not isolate those effects. The distinction is relevant because the industrial business generated more growth in transportation work than its carload increase alone suggests.
Rocker contrasted approximately 6% industrial volume growth with approximately 1% industrial-production growth. The comparison is directionally supportive of share gains and successful business development, but it is not a precise market-share calculation. Union Pacific’s geographic footprint, commodity composition, project exposure, and shipment timing differ from the national industrial-production index. The stronger conclusion is that company-specific commercial execution appears important, not that the railroad necessarily gained 5 percentage points of market share.
The Golden Triangle Polymers project provides a potentially durable source of future traffic as commissioning and startup progress toward full operations. By contrast, increased plastics exports associated with disruptions in global supply may be more temporary. These drivers should be separated: new installed production capacity can create a recurring freight base, whereas exceptional export opportunities may normalize when competing supply returns.
Petroleum traffic benefited from refinery utilization near record levels. This supports current volumes but also creates a demanding utilization comparison. Further growth cannot simply be extrapolated from a segment already operating near the upper end of its practical activity range. Incremental upside must increasingly come from new business, changed logistics patterns, or capacity additions rather than continuously rising utilization.
Overall, industrial offers a relatively attractive combination of higher revenue per unit, identifiable business wins, and infrastructure-linked growth. It also exceeded consensus, unlike premium. Sustained industrial growth would improve the quality of the revenue mix and reduce dependence on intermodal volume expansion as the main driver of incremental earnings.
PREMIUM AND INTERMODAL: STRONG GROWTH, PROFITABILITY STILL INCOMPLETELY DISCLOSED
Premium revenue increased approximately 21% to $2.188 billion on approximately 9% volume growth. Domestic intermodal volume increased 13%, international intermodal increased 8%, and automotive volume increased approximately 2%. Domestic intermodal delivered its 5th consecutive record quarter and is positioned for its 3rd consecutive record-volume year.
The domestic performance supports a structural interpretation that extends beyond the recent diesel-price increase. Rocker emphasized that growth began before the fuel-price acceleration. Investments in the Twin Cities, Phoenix, Kansas City, and Inland Empire, together with improved service and equipment availability, appear to have expanded the railroad’s ability to compete for freight.
However, management did not quantify the respective contributions from economic recovery, competitor displacement, and truck-to-rail conversion when asked directly. This is a material omission for forecasting durability. Freight gained through improved terminal coverage and customer relationships may persist through changing fuel conditions. Traffic attracted primarily by unusually high trucking fuel costs may be more sensitive to a reversal in those economics.
International intermodal is also benefiting from comparison effects. Management stated that the business has fully lapped the prior year’s tariff-related volatility and expects double-digit volume growth in Q4. That is a clear near-term growth signal, but a strong year-over-year rate against a disrupted comparison does not necessarily imply equivalent sequential acceleration.
The financial tables illustrate the change in trajectory. Total intermodal volume increased approximately 11% in Q3 but only approximately 2% year to date. First-half intermodal volume was approximately 2.7% below the prior-year period, based on the reported quarterly and year-to-date totals. Q3 therefore represents a significant recovery in the combined domestic and international business, while also benefiting from a changing comparison base.
Intermodal average revenue per unit increased approximately 14% year over year but declined from $1,626 in Q2 to $1,586 in Q3. The sequential decline is not proof of deteriorating contractual pricing because fuel timing, shipment mix, geography, and domestic-international composition can all affect the measure. Nevertheless, the decline and the revenue miss versus consensus demonstrate why record volume alone does not fully answer the profitability question.
Hamann explained that higher intermodal activity increases drayage expense at the logistics subsidiary and contractor expense at intermodal ramps. Associated subsidiary revenue and container accessorial revenue also contributed to the 21% increase in other revenue, to $384 million. Consequently, freight revenue alone understates the revenue associated with the intermodal ecosystem, while railroad operating expenses alone cannot identify its incremental profitability without the corresponding subsidiary and accessorial contributions.
No segment operating-income bridge was provided. It would therefore be inappropriate to infer that all intermodal growth is margin-dilutive simply because revenue per unit is lower, or that all other-revenue growth is high-margin. The relevant economics depend on train utilization, terminal costs, drayage, equipment ownership, repositioning, and accessorial collections. The call explained the direction of these relationships but did not quantify their net contribution.
Union Pacific’s owned container fleet is commercially important because it allows the railroad to serve both asset-based and non-asset-based intermodal marketing companies. That broadens customer access and can improve equipment availability during periods of strong demand. It also creates capital, repositioning, maintenance, and residual-value exposure. The strategic benefit is credible, but the economic return should be assessed across the full equipment cycle.
Automotive results remained dependent on commercial wins rather than a strong underlying market. Revenue increased approximately 11%, while volume increased approximately 2%, with parts traffic and truck conversions offsetting weakness in finished-vehicle demand. This is favorable execution, but automotive should not be treated as confirmation of a broad consumer or manufacturing recovery.
OPERATING RATIO: THE CORE IMPROVEMENT IS REAL, BUT THE ADJUSTMENTS MATTER
The operating-ratio bridge is central to interpreting the quarter. Reported operating ratio improved from 59.2% to 59.1%. Excluding merger costs, operating ratio worsened from 58.5% to 58.8%. Management attributed 140 basis points of adverse movement to higher fuel prices, implying approximately 110 basis points of improvement in the underlying core business.
The distinction between these measures explains why both the positive operating narrative and the modest reported margin result can be valid. Lower acquisition-related expense benefited the reported comparison. Higher fuel prices adversely affected the merger-adjusted comparison. Volume, pricing, and productivity improved the underlying economics after those effects were separated.
Subtracting the disclosed 140-basis-point fuel effect from the 58.8% adjusted ratio gives an illustrative fuel-neutral equivalent of approximately 57.4%. That is a mechanical analytical bridge, not a separately reported GAAP margin or a fully documented alternative accounting measure. It is useful for understanding the direction and scale of improvement, but it should not replace the reported figures in valuation or covenant analysis.
The improvement appears materially stronger than in Q2. The Q2 release reported approximately 110 basis points of deterioration in adjusted operating ratio and a 120-basis-point adverse fuel effect, suggesting approximately 10 basis points of improvement on the same simplified fuel-neutral bridge. Q3’s approximately 110-basis-point core improvement therefore indicates a meaningful acceleration in underlying leverage.
Importantly, operating-ratio dilution from fuel is not equivalent to an equal dollar loss in operating profit. When a railroad recovers higher fuel costs through surcharge revenue, both revenue and expense rise. Even if the incremental revenue and expense were equal, operating ratio would worsen because the incremental activity carries little or no operating margin. Timing mismatches, index differences, contractual provisions, and unrecovered costs can also affect earnings, but the denominator effect must be distinguished from those economic effects.
Accordingly, multiplying the 140-basis-point fuel headwind by current revenue and treating the result as lost operating income would be analytically unsound. The call did not provide a sufficiently detailed surcharge-and-cost bridge to calculate a precise net fuel-related EPS impact.
COST CONTROL, PRODUCTIVITY, AND CAPACITY RESILIENCE
Operating expense increased $559 million, or approximately 15%, to $4.254 billion. Fuel expense increased $424 million and accounted for approximately 76% of the total expense increase. Excluding fuel, operating expense increased approximately 4.4%, below the 6% increase in revenue carloads. This provides tangible evidence of operating leverage, although traffic mix and the differing resource intensity of individual commodities remain relevant.
Compensation and benefits increased approximately 4% to $1.264 billion. Average total employment declined approximately 1%, while cost per employee increased approximately 5% because of wages, incentive compensation, and training. The active train, engine, and yard workforce increased approximately 1%, which is not inconsistent with the decline in total employment because the populations differ.
The reported workforce productivity metric improved approximately 5% to 1,219 car miles per employee from 1,165. It should not be equated mechanically with revenue carloads divided by total headcount. Car miles, crew deployment, route mix, and the relevant employee population all influence the measure. The underlying message remains favorable: more transportation output was produced without proportionate labor growth.
Average train length increased to 9,969 feet from 9,801 feet. The active locomotive fleet increased approximately 2% while gross ton-miles increased approximately 4%. Locomotive productivity remained at 140 gross ton-miles per horsepower day. Flat productivity on that specific measure does not invalidate the fleet-leverage observation because locomotive count, available horsepower, and operating days are not identical denominators.
Fuel consumption improved to 1.034 gallons per 1,000 gross ton-miles from 1.052. Applied to Q3 gross ton-miles, the difference equates to approximately 4.2 million gallons relative to operation at the prior-year consumption rate. At the Q3 average fuel price, that represents approximately $18 million of illustrative avoided locomotive fuel cost before other operating interactions. The calculation is not a company-disclosed savings figure, but it demonstrates that small efficiency improvements become economically more valuable when fuel prices are elevated.
Equipment and other rents declined approximately 3% to $206 million. This is consistent with improved asset utilization, but ownership decisions also matter. Year-to-date capital investments included $320 million of early locomotive and freight-car lease buyouts, compared with $311 million in the prior year. Rent reductions should therefore not automatically be classified entirely as operating productivity; cash investment and depreciation must be considered alongside lease expense.
Purchased services and materials increased approximately 9% to $746 million, reflecting inflation, intermodal-related costs, and the cost of returning locomotives to service. These expenses represent an important boundary on the scalability of the model. Incremental freight can be handled efficiently, but restoring equipment, staffing terminals, and maintaining resource availability still require spending.
Gehringer’s most important capacity statement was: “When we said used, we didn’t say used up.” Management indicated that resources remain available and that more than 300 employees are in training. This supports the ability to accommodate further growth without an immediate operating-capacity constraint.
The residual buffer should nevertheless be treated as an option with a carrying cost, not as free capacity. Locomotives require maintenance and preparation, employees require training, and terminal resources must be positioned before demand arrives. The increase in capital spending and purchased services suggests that management is replenishing capacity while utilizing it. This is prudent operationally, but it limits the assumption that every incremental unit will continue to carry unusually high contribution margins.
SERVICE QUALITY: RESILIENT, BUT NOT UNIFORMLY IMPROVING
The service evidence is more mixed than the strongest management rhetoric suggests. Freight car velocity improved approximately 1% year over year to 228 miles per day, and terminal dwell improved approximately 2% to 19.9 hours. These are constructive results while handling higher volume and support the conclusion that the network avoided a material congestion breakdown.
However, intermodal service performance index declined from 98% to 92%, while manifest service performance index declined from 100% to 93%, according to the issuer’s comparative operating tables. These decreases are significant enough to warrant attention, particularly because service quality is the foundation of the truck-conversion and pricing thesis.
Management explained that the index is designed to challenge performance against the best monthly threshold. The percentages should therefore not be interpreted automatically as conventional on-time delivery rates, nor should the decline be assumed to represent an equivalent deterioration in contractual service compliance. Benchmark changes and metric construction matter. Nevertheless, the reported decline cannot be dismissed simply because velocity and dwell improved.
Sequentially, velocity declined from 231 miles per day in Q2 to 228 in Q3, while dwell increased from 19.7 hours to 19.9 hours. These changes are modest and may reflect seasonal conditions and traffic growth. They also suggest that continued volume acceleration should be assessed alongside service stability rather than through productivity metrics alone.
The commercial risk is asymmetric. Customers trialing rail because of high diesel prices may tolerate less service variability than established rail-dependent shippers. Failure to maintain consistency could weaken retention precisely when the railroad seeks stronger renewal pricing. Service performance is therefore not merely an operating indicator; it is a leading indicator of revenue durability and pricing power.
Safety remains foundational, but the comparisons require care. The release explicitly reported improvement in personal injury rates, while the call discussed injury and derailment performance against several reference points, including a 3-year rolling average. No sufficiently detailed numerical safety bridge was provided to establish that every safety measure improved on every comparison basis. Continued safety progress supports reliability and regulatory credibility, but the call does not justify an unqualified claim of uniform improvement.
GUIDANCE: MAINTAINED EARNINGS EXPECTATIONS, A MORE QUALIFIED MARGIN COMMITMENT
The formal guidance progression is important. On April 23, Union Pacific affirmed mid-single-digit reported EPS growth for 2026 and a $3.3 billion capital plan. On July 23, it raised the EPS outlook to high-single-digit growth while maintaining the capital plan and its operating-ratio improvement objective. On October 22, it maintained the higher EPS growth outlook, increased capital spending to $3.5 billion, and explicitly separated core operating-ratio improvement from reported operating-ratio pressure caused by fuel.
The Q3 announcement was therefore an affirmation of the July earnings upgrade, not a new earnings upgrade. The revised margin language is also more consequential than a routine reiteration. The July release contained an unqualified operating-ratio improvement objective. The October release specified core-business improvement while warning that reported operating ratio is challenged by high fuel prices. This preserves the operating thesis but weakens the commitment to an improving headline margin.
Interpreting high-single-digit growth illustratively as 7% to 9%, rather than as a formally specified company range, implies 2026 reported EPS of approximately $12.82 to $13.06 against the $11.98 reported in 2025. With year-to-date reported EPS of $9.71, the corresponding Q4 EPS range is approximately $3.11 to $3.35. An 8% full-year growth assumption implies approximately $3.23 in Q4.
The comparable Q4 2025 reported EPS was approximately $3.11, based on full-year EPS less the reported 9-month total. Thus, the current annual guidance is consistent with approximately flat to 8% Q4 reported EPS growth, substantially slower than Q3’s approximately 16% increase.
That apparent deceleration is partly a comparison issue. Q4 2025 included a $0.30 land-sale benefit. Removing only that item produces a partial-normalization baseline of approximately $2.81, against which the implied Q4 2026 EPS range represents approximately 11% to 19% growth. This is not a fully adjusted comparison because other merger and accounting adjustments remain, but it demonstrates that modest reported Q4 growth would not necessarily indicate a sharp deterioration in underlying operations.
The absence of a guidance increase despite the Q3 beat should be interpreted as limited evidence of additional near-term upside, not necessarily as evidence of weakening demand. Higher fuel prices, seasonality, the prior-year land gain, resource replenishment, and business mix can absorb stronger volume performance. The company provided no quantified bridge allocating those effects.
Q4 fuel prices are expected to average approximately $4.85 per gallon, compared with $4.21 in Q3. At an illustrative consumption level equal to Q3’s 240 million gallons, the $0.64 increase would add approximately $154 million of gross locomotive fuel cost before surcharge recovery and changes in volume, mix, or efficiency. A $0.10-per-gallon change would correspond to approximately $24 million on the same consumption assumption. These are gross cost sensitivities, not EPS forecasts.
Hamann also highlighted normal Q4 seasonality, including holidays and lower absolute activity relative to the strongest operating quarters. Strong year-over-year growth can therefore coexist with sequentially lower volume and weaker reported operating ratio. The relevant test is whether core efficiency continues to improve against the prior-year period while customer service remains stable.
Management’s commitment was explicit: “on a core operating basis, you have seen us make year-over-year improvements to our core OR, and that’s going to continue.” That is a meaningful qualitative assertion, but no specific Q4 core operating-ratio target was supplied.
For 2027, the call provided a directional pricing opportunity, continued productivity ambitions, and an anticipated merger closing window, but no standalone annual EPS, revenue, capital-spending, or operating-ratio forecast. The existing 3-year EPS growth objective through 2027 is not equivalent to a newly issued 2027 earnings forecast.
CASH FLOW, CAPITAL ALLOCATION, AND BALANCE-SHEET QUALITY
The $8.3 billion of operating cash flow and approximately $2.4 billion of free cash flow discussed on the call are year-to-date figures, not Q3-only results. This distinction is essential when assessing cash conversion or comparing the amounts with quarterly earnings.
Operating cash flow increased 17.5% to $8.302 billion from $7.065 billion. Cash capital investments were $2.834 billion, compared with $2.792 billion. On a conventional operating-cash-flow-less-capital-investment basis, free cash flow was approximately $5.468 billion, up approximately 28% from $4.273 billion.
Union Pacific’s reported free cash flow uses a different definition. It deducts cash used in investing activities and dividends from operating cash flow. The reported $2.362 billion therefore reconciles as $8.302 billion of operating cash flow, less $3.456 billion of investing cash outflow, less $2.484 billion of dividends.
Investing cash outflow included $625 million of net purchases of short-term investments, in addition to capital investment and small other items. Consequently, reported free cash flow is affected by allocating cash into short-term investments, even though that activity does not represent an operating consumption of shareholder wealth. After cash capital investment and dividends, but before net purchases of short-term investments and other investing items, cash generation was approximately $2.984 billion.
This definition makes direct comparisons with other companies’ free cash flow potentially misleading. It also means that the approximately $2.4 billion headline should not be interpreted as the total cash available before dividends. The business generated substantially more cash than that measure alone suggests.
Cash-flow growth nevertheless deserves scrutiny. Of the $1.237 billion increase in operating cash flow, approximately $649 million came from the change in the condensed cash-flow statement’s “Other - net” category, which moved from a $238 million outflow adjustment to a $411 million inflow adjustment. That accounts for approximately 52% of the improvement. The condensed disclosure does not isolate the working-capital and other components sufficiently to establish how much will recur. Cash conversion was strong, but its full growth rate should not automatically be extrapolated.
Cash and short-term investments totaled $3.086 billion, up from $1.516 billion at year-end 2025. Total debt declined to $30.324 billion from $31.814 billion. A simple debt-less-cash-and-short-term-investments calculation therefore declined by approximately $3.060 billion to $27.238 billion. The company’s adjusted debt-to-adjusted-EBITDA ratio improved to 2.4 times from 2.7 times at year-end.
This improvement provides financial flexibility ahead of the merger. It is also a change in capital-allocation priorities. Share-repurchase cash outflow declined to $26 million year to date from $2.679 billion in the prior-year period. Retained cash is being directed toward balance-sheet preparation rather than substantial ongoing share-count reduction.
The quarterly dividend increased approximately 3% to $1.42, equivalent to $5.68 annualized at the current rate. Dividend growth was well below earnings growth, consistent with prioritizing cash accumulation. Existing shareholders continue to receive growing cash distributions, but the immediate earnings-per-share benefit from large buybacks is absent.
The $200 million capital-plan increase represents approximately 6.1% more spending than the prior plan. Management attributed it to locomotive modernization, infrastructure opportunities, growth investment, and work pulled forward from 2027. This is not necessarily a permanent increase in the multiyear capital requirement. However, no offsetting reduction to 2027 spending was committed, so the increase should not be assumed to reverse automatically.
The capital plan also should not be reconciled mechanically against cash-flow-statement capital investment without considering scope. Cash investment includes early lease buyouts and may differ from the operating capital-plan definition. The appropriate conclusion is that the railroad remains strongly cash-generative while spending more to preserve growth capacity, not that the call established a precise remaining-quarter capital-cash requirement.
THE NORFOLK SOUTHERN MERGER: STRATEGIC BENEFITS AND REGULATORY RISK
The strategic logic of the merger is coherent. Removing interchange points can reduce transit-time variability, car handling, customer inventory requirements, and equipment needs. A single-line product can also make rail more competitive with trucking on routes that are unattractive under separate railroad operating and commercial arrangements.
Those customer benefits are not equivalent to shareholder synergies. Some savings may accrue to shippers through lower transportation costs or improved inventory efficiency. Some may be competed away. Regulatory conditions may also require access protections or other measures that limit how much value the combined railroad retains. A credible shareholder valuation must distinguish gross supply-chain benefits from incremental operating profit after implementation costs and competitive responses.
The call did not provide an updated quantified synergy bridge. The original July 2025 transaction announcement identified approximately $2.75 billion of annualized synergies and anticipated adjusted EPS accretion in the 2nd full year after closing, rising thereafter. Those remain historical transaction assumptions rather than newly demonstrated earnings benefits from this quarter.
The original agreement contemplated 1.0 Union Pacific share plus $88.82 in cash for each Norfolk Southern share, with approximately 225 million Union Pacific shares expected to be issued. Using that original share estimate, the cash component is approximately $20 billion. Union Pacific’s current liquidity is meaningful but covers only part of that requirement. Acquisition financing, share issuance, assumed liabilities, and integration spending remain central to the eventual per-share outcome.
The original approximately 3.3-times closing debt-to-EBITDA expectation should not be compared mechanically with the current 2.4-times standalone adjusted ratio. The business perimeter, debt structure, measurement date, and potentially metric definitions differ. The current balance sheet demonstrates improving standalone capacity; it does not establish the final combined leverage ratio.
Timing also matters. The original July 2025 announcement targeted an early-2027 closing. The current call anticipates the 2nd half of 2027. This is later than the original transaction timetable, although the call does not establish that the shift was newly disclosed this quarter. If closing occurs during 2027, the 2nd full subsequent calendar year would generally be 2029. The original accretion framework therefore does not justify inserting mature merger benefits into 2027 standalone earnings estimates.
Vena’s statement that the company should report its first combined earnings approximately 1 year from the call is more specific than the broader 2nd-half-2027 closing window. It remains an aspiration dependent on regulatory timing, closing conditions, and the actual reporting period in which the transaction closes.
The STB’s August 18 procedural decision provides a defined sequence. Comments, protests, requests for conditions, and responsive applications are due November 18, 2026. Preliminary Department of Justice and Department of Transportation comments, if submitted, are due December 3, 2026. Responses and rebuttal supporting the principal application are due February 16, 2027, and final briefs are scheduled for May 28, 2027. The hearing date and close of the evidentiary record remain to be determined.
The Board intends to issue its decision within 90 days after the evidentiary record closes, subject to completing environmental review. This supports a possible 2nd-half-2027 outcome but does not guarantee it. The same decision explicitly states that advancing the procedural schedule is not a finding on the merits.
The regulatory distinction from Canadian Pacific-Kansas City Southern is especially important. Vena stated, “The pattern is set,” when discussing the prior merger. However, the STB’s merger FAQ explains that the Canadian Pacific-Kansas City Southern transaction received a waiver from the 2001 major-merger rules. The current Union Pacific-Norfolk Southern proceeding applies those rules, which impose a more demanding public-interest and competition framework.
The Canadian Pacific-Kansas City Southern approval also included extensive conditions, including gateway protections, restrictions on terminating reciprocal switching access, service commitments, environmental mitigation, and extended oversight. The Board rejected certain competitor requests aimed at protecting their own traffic, but that is not equivalent to approving the transaction without meaningful conditions.
Union Pacific’s end-to-end characterization is economically relevant but does not eliminate competition concerns. A combined carrier may have incentives to favor its own network, influence interchange economics, disadvantage alternative routes, or alter gateway access. Those issues can arise even where parallel track overlap is limited. The Board’s own procedural decision specifically recognized concerns associated with vertical combinations and the implications of subsequent industry consolidation.
The Canadian National agreement is constructive because it demonstrates that a negotiated remedy can preserve competition while reducing opposition. CN’s July 22 announcement described a binding memorandum of understanding covering access to affected shipper facilities, acquisition of Norfolk Southern’s interests in Kansas City and St. Louis terminal railroads, additional operating rights, and access to Union Pacific’s Neff Yard. The agreement is contingent on merger approval and closing.
Those provisions are more substantive than a generic endorsement. CN agreed not to oppose the merger in exchange for commercially meaningful protections and access. The call’s indication that final documentation is nearing completion is positive, but the framework had already been announced in July. It should not be treated as an entirely new regulatory breakthrough from this earnings call.
Management reported more than 500 customer support letters and approximately 30 customers participating in integration planning. This is relevant evidence of commercial interest. It does not establish that all affected customers benefit, that proposed remedies are sufficient, or that the statutory approval test has been satisfied. The quality and specificity of customer evidence matter more than the support-letter count alone.
NEGOTIATING POSTURE, LABOR PROTECTION, AND WALK-AWAY RISK
Management’s negotiating position became more flexible as the call progressed. Early answers suggested little need for additional concessions. In the final exchange, Vena acknowledged that “there’s always deals to be made” and indicated that the company would reassess after reviewing the November 18 submissions.
This is a more realistic posture than treating all opposition as commercially self-interested. Competitors may seek excessive remedies, but shipper access, gateway terms, labor protections, and network integration are legitimate regulatory issues. A successful outcome may require conditions that reduce some of the original transaction economics while preserving sufficient value to justify proceeding.
The most important capital-discipline statement was: “We will walk away from this.” This establishes that management does not view approval at any cost as the objective. It also broadens the risk distribution. An adverse outcome could be outright rejection, an extended delay, or approval with conditions the company considers unacceptable.
Walking away would preserve the standalone franchise and avoid potentially value-destructive concessions. It would not necessarily be costless. The original agreement includes a $2.5 billion reverse termination fee, subject to contractual triggers. That amount should not be assumed payable under every unsuccessful outcome, but its potential relevance underscores why standalone value is not automatically a hard floor for the stock during a failed transaction.
Labor discussions were less definitive than management’s broad assurances suggest. Statements about employment protection should be distinguished from guarantees regarding craft, location, seniority, compensation, or a particular operating assignment. The final BLET discussion also contains apparent drafting inconsistencies. Formal agreement terms, rather than the transcript’s broad rhetoric, are necessary to determine the actual scope and duration of protection.
From an earnings perspective, labor protections need not prevent productivity gains if growth and attrition allow more output without equivalent additions to employment. They can, however, constrain the speed and mechanism of cost reductions. A merger model should not simultaneously assume extensive employment guarantees and rapid headcount elimination without a specific reconciliation.
Management’s reluctance to sell substantial portions of the railroad also matters. Retaining network control may protect service quality and growth opportunities, but it reduces reliance on branch-line divestitures as a source of cash, cost reduction, or regulatory compromise. The merger thesis must therefore be supported primarily by operating integration, traffic growth, asset utilization, and targeted remedies rather than broad asset disposals.
TECHNOLOGY, AUTONOMOUS TRUCKING, AND MANAGEMENT TRANSITION
Technology supports the standalone productivity thesis through energy management, train planning, terminal decision support, maintenance, and semi-autonomous processes. Gehringer described technology as a means of improving frontline decisions rather than as a substitute for operating discipline. That framing is credible because the quarter’s gains are visible in train length, fuel intensity, labor productivity, and network performance.
The acknowledgment that Norfolk Southern has superior capabilities in aspects of wayside inspection was strategically constructive. It suggests the integration approach may incorporate technology from both railroads rather than simply imposing Union Pacific’s systems. However, system selection, data integration, employee adoption, cybersecurity, and rollout risk remain unquantified.
The response on autonomous trucking was directionally appropriate but analytically incomplete. Management accepted that the technology will develop and emphasized the need for continued rail efficiency. It did not provide a cost comparison, corridor analysis, adoption timetable, or estimate of the effect on intermodal pricing.
Rail retains structural advantages in fuel efficiency, labor leverage, and dense long-distance movement. Autonomous trucking could nevertheless lower competing labor costs and improve truck asset utilization, particularly on favorable long-haul corridors. It could also affect drayage economics and make some intermodal offerings more competitive. The net effect depends on the full door-to-door cost and service comparison, not solely on rail’s line-haul fuel advantage.
The near-term implication is limited because no material Q3 effect was established. The longer-term implication is that current high-fuel truck-to-rail conversion benefits should not be capitalized as permanent without allowing for changes in trucking technology and costs.
Hamann’s planned retirement in early 2027 creates a finance-leadership transition ahead of the expected merger closing and integration period. The call indicates a planned departure rather than an abrupt operational disruption. Nevertheless, succession quality matters because acquisition financing, accounting integration, capital allocation, and synergy verification will become more demanding. No successor or detailed transition framework was identified on the call.
INVESTMENT IMPLICATIONS, SCENARIOS, AND VALUATION DISCIPLINE
The strongest potential source of upside is a pricing improvement layered onto an already more productive network. At the current approximate annualized fuel-excluded freight-revenue run rate of $22.4 billion, an additional 1% of pure pricing would represent approximately $224 million of annual revenue. Assuming unchanged volume, negligible incremental operating cost, the Q3 tax rate, and the current diluted share count, that equates to approximately $0.29 of annual EPS. This is an illustrative sensitivity, not management guidance.
A 100-basis-point operating-margin improvement on Q3 revenue would equate to approximately $72 million of quarterly operating income and approximately $0.09 of quarterly EPS using the same tax and share assumptions. The sensitivity illustrates why a sustained combination of pricing and productivity could matter materially. It should not be applied mechanically to fuel-related operating-ratio changes, which can involve changes in the revenue denominator.
The principal downside is that the current growth mix proves less durable or less profitable than anticipated. Lower diesel prices could reduce some conversion incentives, international comparisons could become more demanding, contractor and resource-restoration costs could rise, and service performance could deteriorate. In that environment, higher capital spending and limited share repurchases would leave less financial support for per-share growth.
An illustrative standalone scenario framework assigns a 50% probability to a base case, a 25% probability to a bull case, and a 25% probability to a bear case. These probabilities are judgmental analytical assumptions, not market-implied probabilities or merger-approval estimates. The scenarios exclude acquired Norfolk Southern earnings, acquisition financing, new merger shares, and mature merger synergies.
In the base case, 2027 volume grows approximately 3% to 4%, underlying pricing improves approximately 2% to 3%, and core operating ratio improves approximately 50 to 75 basis points. Service remains sufficiently reliable to retain most recent wins, while inflation and resource investment absorb part of the benefit. Illustrative standalone adjusted EPS of $14.40 at 21 times earnings produces approximately $302 per share.
In the bull case, volume grows approximately 5% to 7%, pricing improves approximately 3% to 4%, and core operating ratio improves approximately 100 to 150 basis points. Intermodal renewals capture stronger market conditions, industrial growth remains robust, and service stabilizes despite greater activity. Illustrative standalone adjusted EPS of $15.60 at 23 times earnings produces approximately $359 per share. This outcome requires a sustained favorable operating cycle, not simply continued fuel-surcharge inflation.
In the bear case, volume is approximately flat to down 2%, pricing grows no more than approximately 1%, and core operating ratio is flat to approximately 100 basis points worse. Recent conversions prove less durable, service or inflation pressures increase, and merger uncertainty weighs on valuation. Illustrative standalone adjusted EPS of $12.40 at 17.5 times earnings produces approximately $217 per share. This operating valuation does not separately deduct a potential termination fee or other discrete transaction losses, which could create additional downside.
The probability-weighted value of these illustrative scenarios is approximately $295 per share before dividends. The selected multiples are valuation assumptions, not verified current trading multiples or peer-derived targets. The framework demonstrates the dependence of upside on both earnings delivery and valuation, rather than establishing that the shares are currently mispriced.
A verified contemporaneous share price and a complete acquisition-adjusted valuation were not established in the source set. An unconditional recommendation to buy at the prevailing market price is therefore not supported. The earnings evidence supports retaining exposure to the improving standalone franchise, while requiring a margin of safety before adding capital.
Within this illustrative framework, an entry at or below approximately $255 would provide approximately 16% upside to probability-weighted value before dividends, or approximately 18% including the current annualized dividend. The operating bear case would represent approximately 15% downside from that entry, before discrete merger-related losses. This is a conditional valuation threshold, not an assertion about where the shares currently trade.
For a diversified portfolio, an initial position of approximately 0.75% to 1.0% of net asset value would be more consistent with the unresolved transaction risk than a concentrated position. A 25% adverse gap scenario would produce approximately 19 to 25 basis points of portfolio loss at that size. A 10% price stop would provide ordinary trading discipline but would not cap losses through a regulatory gap. The 25-basis-point figure is a modeled risk budget, not a guaranteed maximum loss.
The holding-period thesis is approximately 12 to 18 months, covering the 2027 pricing reset and major regulatory milestones. Exit or material reduction would be warranted if stronger contract pricing fails to emerge, core margin improvement reverses despite reasonable volume, service deterioration begins to impair customer retention, or merger conditions materially weaken expected per-share economics. Valuation approaching the bull case without corresponding operating evidence would also justify reducing exposure.
Portfolio exposure would remain cyclical. Union Pacific adds sensitivity to industrial production, trade, construction, consumer-goods movement, and transportation capacity. High diesel prices can improve rail’s competitive position while simultaneously pressuring reported margins and customer spending. The stock is therefore neither a simple energy hedge nor a purely defensive infrastructure holding. Concurrent exposure to Norfolk Southern or other rails would require particular attention because regulatory developments can affect all of them through different channels. Actual portfolio correlations and concentration cannot be quantified without specified holdings and risk-model inputs.
CATALYSTS AND THE EVIDENCE REQUIRED FOR A STRONGER INVESTMENT CASE
The immediate operating catalysts are Q4 volume conversion, the realization of double-digit international intermodal growth, performance under the approximately $4.85 fuel assumption, and evidence that service remains stable as resources are deployed. The important distinction is whether volume growth generates durable operating profit rather than merely higher surcharge revenue.
Late-2026 and early-2027 contract renewals are the principal earnings catalyst. Stronger pricing would validate management’s explanation that the current revenue-per-unit outcome reflects timing and mix rather than an inability to monetize service. Continued flat fuel-excluded yields would require a more detailed mix and contract bridge before being accepted as benign.
The November 18 regulatory submissions and December 3 federal-agency comments are the principal near-term transaction catalysts. Their significance lies in identifying concrete competitive concerns and proposed remedies. The February 16 responses and subsequent hearing process will then test whether those concerns can be addressed without materially compromising the transaction’s economics.
The next earnings update should clarify the 2027 standalone outlook, capital requirements after the 2026 pull-forward, the extent of pricing improvement, and the durability of cash conversion. A CFO succession announcement is also relevant given the anticipated financing and integration workload.
The decisive investment question is whether Union Pacific can retain a larger customer base, improve price realization, and sustain core margin gains while preserving service. Q3 provides meaningful affirmative evidence on volume absorption and productivity, mixed evidence on service, and only directional evidence on pricing. It provides little new quantitative evidence on merger value.
The resulting conclusion is constructive on the standalone business and disciplined on the stock. Operating performance improved more than the headline margin indicates, but the small earnings beat, unchanged annual EPS guidance, premium revenue miss, weaker service indices, and unresolved regulatory economics argue against treating the quarter as an unqualified re-rating event.
SOURCE AND TRANSCRIPT QUALIFICATIONS
Financial comparisons use the October 22 issuer earnings release and accompanying financial tables, the supplied Bloomberg consensus notice, the supplied Q3 call transcript, and the issuer’s April 23 and July 23 earnings disclosures. Transaction context incorporates the original July 2025 merger announcement, CN’s July 2026 agreement announcement, and the STB’s procedural decision, merger FAQ, and Canadian Pacific-Kansas City Southern approval materials. The complete September 2026 investor-conference transcript was not independently accessible, so the prior-guidance comparison is anchored to the verified formal July release.
The initial draft contains apparent transcription and speaker-attribution errors. The issuer’s financial tables establish terminal dwell at 19.9 hours, rather than the isolated 14-hour reference in the Q&A. Garbled locomotive-buffer counts, facility names, and inconsistent labor-protection wording are not treated as verified quantitative evidence. These limitations do not alter the principal financial conclusions, but they matter for detailed operating-capacity and merger modeling.
COMPANY EMPLOYEES ON THE CALL
• Jim Vena, Chief Executive Officer. • Jennifer Hamann, Executive Vice President and Chief Financial Officer. • Kenny Rocker, Executive Vice President, Marketing and Sales. • Eric Gehringer, Executive Vice President, Operations.
The draft includes unidentified speaking turns. No additional employee identity or title can be established from those entries.
RESEARCH ANALYSTS ON THE CALL
• Christian Wetherbee, Wells Fargo. • Ken Hoexter, Bank of America Securities. • Scott Group, Wolfe Research. • Jason Seidl, TD Cowen. • Walter Spracklin, RBC Capital Markets. • David Vernon, Bernstein Research. • Stephanie Moore, Jefferies. • Jordan Alliger, Goldman Sachs. • Ariel Rosa, Citi. • Brian Ossenbeck, JPMorgan. • Thomas Wadewitz, UBS. • Jonathan Chappell, Evercore ISI. • Richa Harnain, Deutsche Bank. Identified by the operator; the subsequent question is labeled “Unidentified Participant” in the draft. • Brandon Oglenski, Barclays Capital.
Key Read-Throughs
KEY READ-THROUGHS FROM UNION PACIFIC’S Q3 2026 EARNINGS CALL
Union Pacific’s results indicate a selective recovery in freight activity, not a uniform acceleration in the economy. Volume increased 6%, but approximately 75% of incremental units came from intermodal, while fuel surcharges contributed approximately 900 basis points to freight-revenue growth. The strongest cross-sector signals are positive for locomotive modernization and intermodal utilization, negative for the assumption that stronger freight automatically requires substantial new equipment, and cautionary for merger-dependent railroad valuations. The Gulf Coast commentary also identifies an important divergence: new petrochemical capacity benefits its owners and transportation providers while creating additional competition for incumbent producers. Impact assessments below distinguish identifiable operating effects from uncertain consolidated earnings outcomes. Magnitudes describe business exposure, not predicted share-price movements.
RAIL EQUIPMENT AND TECHNOLOGY: MODERNIZATION BENEFITS MORE DIRECTLY THAN NEW LOCOMOTIVE DEMAND (READ-THROUGH 1)
Wabtec Corporation (WAB: United States) receives the clearest positive supplier read-through. The impact is moderate for revenue timing and existing-program visibility, with a potentially more durable benefit to demand for fuel-saving upgrades, control systems, and maintenance technology.
The supporting call evidence is unusually specific. Union Pacific increased its 2026 capital plan by $200 million to $3.5 billion. Eric Gehringer attributed part of the increase to accelerating work under existing multiyear locomotive modernization and overhaul contracts, stating that the company saw an opportunity “to pull some of that forward.” This is more actionable than a general statement about higher railroad capital spending because the expenditure category and procurement structure were identified.
The supplier relationship is independently established. Wabtec announced a $1.2 billion Union Pacific modernization agreement in February 2026, signed in Q4 2025, with deliveries scheduled to begin in 2027. An earlier modernization program was scheduled for completion in 2026. The earnings call therefore supports execution and potentially accelerated conversion of existing work, not an assumption that the entire $200 million increase represents a new Wabtec order. The allocation between suppliers, infrastructure, and locomotive projects was not disclosed.
The transmission mechanism is both financial and operational. Accelerated overhaul activity can support manufacturing throughput, aftermarket revenue, and associated hardware and software deliveries. More importantly, diesel prices increased 64% year over year to $4.21 per gallon, making a fixed reduction in gallons consumed worth approximately 64% more in dollars. That improves the economic attractiveness of fuel-efficiency investments without requiring a proportionate increase in locomotive fleet size.
The near-term catalyst is confirmation of delivery schedules and backlog conversion in Wabtec’s operating updates. The longer-duration benefit is a stronger customer incentive to extend locomotive life and improve efficiency. This is a modernization thesis, not evidence of an imminent industrywide new-locomotive purchasing cycle.
RAILCAR MANUFACTURING: FREIGHT GROWTH IS NOT TRANSLATING PROPORTIONATELY INTO EQUIPMENT REQUIREMENTS (READ-THROUGH 2)
The Greenbrier Companies (GBX: United States) and Trinity Industries (TRN: United States) face a modest negative read-through for incremental, growth-driven railcar orders relative to an optimistic freight-recovery thesis. The call does not establish falling backlogs, weaker lease rates, or a negative consolidated earnings revision.
The supporting evidence is the combination of 6% volume growth, improved asset productivity, and substantial remaining capacity. Union Pacific increased train length approximately 2%, improved freight-car velocity approximately 1%, and reduced terminal dwell approximately 2%. Gehringer emphasized: “When we said used, we didn’t say used up.” Management also described unstacking existing containers and deploying previously available resources rather than purchasing a wholly new operating fleet.
The precise mechanism is lower incremental equipment intensity. Faster equipment cycles allow more freight to move with a given number of cars. Existing stored resources can meet an initial increase in demand before customers place new orders. Moreover, most incremental traffic was intermodal, while bulk volume was essentially flat and coal volume declined 3%. That mix is less supportive of a broad-based order recovery across conventional freight-car categories than the headline 6% growth rate suggests.
The distinction from Wabtec is important. Modernization can receive spending even when existing fleet capacity remains sufficient. New-car manufacturers generally require replacement needs, customer-specific shortages, or sustained growth beyond available capacity to generate additional orders. Higher railroad capital spending is therefore not automatically interchangeable across equipment suppliers.
Near-term trading implications are primarily relative: the call supports modernization exposure more directly than a generalized rail-equipment rally. The longer-duration negative is improved freight output per unit of equipment, which can reduce growth-related purchases. Replacement demand, specialized chemical cars, and shipper-owned fleets remain offsets. Union Pacific’s 3% decline in equipment and other rents should not be interpreted as evidence of lower market lease rates, because lease buyouts and ownership decisions also affect that expense.
INTERMODAL AND TRUCKLOAD: MODAL CONVERSION SUPPORTS INTERMODAL UTILIZATION, BUT NOT AUTOMATIC MARGIN EXPANSION (READ-THROUGH 3)
Hub Group (HUBG: United States) and Schneider National (SNDR: United States) receive a positive read-through through their established Union Pacific intermodal relationships. The potential effect is material at the intermodal-business level and more diluted at the consolidated level. J.B. Hunt Transport Services (JBHT: United States) receives a positive industry-demand signal rather than the same direct counterparty signal, given its major western relationship with BNSF.
The call reported 13% domestic intermodal volume growth, a 5th consecutive record domestic intermodal quarter, and an expected 3rd consecutive record-volume year. Kenny Rocker explicitly stated that growth began before the recent diesel-price acceleration. He identified service quality and investments in the Twin Cities, Phoenix, Kansas City, and Inland Empire as contributing factors. This makes the opportunity more durable than a purely temporary response to expensive trucking fuel.
The transmission mechanism is improved container utilization, more productive drayage deployment, and greater recovery of fixed operating costs. A larger usable terminal network also expands the range of customers and lanes that can be served economically. For Hub and Schneider, Union Pacific’s demonstrated ability to absorb additional traffic supports the capacity and service assumptions underlying their own commercial offerings.
The most important qualification is the allocation of future pricing gains. Management said trucking conditions improved after much of the current bid season was established and anticipated “a better environment for stronger pricing” in late 2026 and early 2027. Higher railroad pricing is purchased transportation expense for an intermodal marketing company. Volume growth can therefore coexist with pressure on gross profit per load if rail costs reset before customer rates. The call is more strongly positive for utilization than for an unqualified margin expansion forecast.
For Werner Enterprises (WERN: United States), the same evidence is negative for contestable long-haul dry-van volumes. Rail conversions remove shipments from the road, potentially reducing tractor utilization and increasing the need to reposition capacity. The effect is likely moderate on directly competing lanes and less certain for consolidated earnings, because firmer trucking rates and dedicated operations can offset it. This is not a basis for a blanket truckload short.
Near-term catalysts are carrier volume disclosures and the late-2026 to early-2027 bid cycle. The longer-duration shift is greater intermodal penetration supported by service and terminal coverage. Union Pacific’s growth does not prove that J.B. Hunt or any particular trucker lost share, and the railroad’s weaker reported service indices remain a constraint on how aggressively the conversion opportunity should be extrapolated.
RAILROADS: CANADIAN NATIONAL CAN GAIN NETWORK ACCESS THROUGH MERGER REMEDIES (READ-THROUGH 4)
Canadian National Railway (CNI: Canada) receives a positive, merger-contingent read-through for network access and commercial growth opportunities. The likely near-term earnings impact is small. The longer-term strategic benefit could be moderate if approval, closing, and successful implementation occur.
Vena said the agreement with Canadian National was close to final documentation and described CN as a competitor that would gain opportunities in the St. Louis-Kansas City corridor. This commentary provides an execution update on an already announced arrangement, not an entirely new agreement.
CN’s July framework identifies the economic substance. It includes access to certain facilities where competitive rail options would otherwise decline, acquisition of Norfolk Southern’s interests in the Kansas City Terminal Railway and Terminal Railroad Association of St. Louis, additional operating rights, and access to Union Pacific’s Neff Yard in Kansas City. CN agreed not to oppose the merger, subject to the framework’s implementation.
The transmission mechanism is expanded customer reach and improved terminal connectivity without acquiring an entire Class I railroad. Access rights can create additional origin-destination combinations, improve the usefulness of existing routes, and support incremental traffic over CN’s established network. This is a more concrete benefit than a generic argument that industry consolidation improves railroad pricing.
The important cross-portfolio distinction is that CN can obtain specific protections and commercial opportunities while other railroads continue to seek broader remedies. Its position is therefore not economically identical to that of an uncompensated competitor facing a stronger transcontinental network.
Near-term catalysts are definitive documentation and the regulatory treatment of the agreement. Fundamental benefits would arise only after the merger closes and traffic develops. No revenue, profit, implementation-cost, or capital requirement was quantified. The access benefits are directionally positive, but they do not establish that the overall competitive effect of the larger merger is positive for every part of CN’s business.
RAILROAD MERGER ARBITRAGE: NORFOLK SOUTHERN REMAINS EXPOSED TO REMEDY SEVERITY, NOT JUST APPROVAL (READ-THROUGH 5)
Norfolk Southern Corporation (NSC: United States) carries a negative risk read-through for positions premised on near-certain completion. The potential valuation magnitude is high because the relevant exposure is the acquisition premium and transaction timetable, rather than a small quarterly earnings variation. The call does not demonstrate that approval probability declined; it demonstrates why approval certainty is an inappropriate assumption.
The key supporting statements were management’s anticipation of closing in the 2nd half of 2027, its willingness to reassess after the November 18 submissions, and Vena’s explicit declaration: “We will walk away from this.” That last statement makes the severity of regulatory conditions economically important. An acceptable outcome requires both regulatory approval and conditions under which the acquirer remains willing and contractually able to proceed.
The mechanism is straightforward. Conditions that materially reduce synergies, constrain commercial flexibility, or increase implementation costs can weaken transaction economics even if the regulator permits a combination. Delay also lowers the annualized return on a merger-arbitrage position and extends exposure to business performance, financing, dividends, and borrowing costs.
The original consideration includes 1.0 Union Pacific share plus $88.82 in cash for each Norfolk Southern share. Norfolk Southern’s transaction value therefore has substantial Union Pacific equity exposure. Hedging the stock component can reduce that exposure but cannot eliminate deal-break risk, timing risk, or the gap between the consideration and Norfolk Southern’s standalone value.
The regulatory precedent cited on the call should not be treated as determinative. Canadian Pacific-Kansas City Southern received an exemption from the 2001 major-merger rules. The current transaction faces that more demanding framework, and the STB has explicitly stated that advancing the procedural schedule is not a merits determination.
The near-term catalysts are the November 18, 2026 opposition and remedy filings and the December 3 federal-agency comments. The longer-duration valuation issue is whether the final conditions preserve enough value to sustain the transaction. Management’s confidence is not a substitute for those decisions, and the existence of a reverse termination fee does not guarantee completion or fully protect target shareholders.
RAILROAD COMPETITION: CSX FACES A CONDITIONAL NETWORK DISADVANTAGE, NOT A CONFIRMED TAKEOVER CATALYST (READ-THROUGH 6)
CSX Corporation (CSX: United States) faces a potentially moderate negative competitive effect on overlapping east-west traffic if Union Pacific-Norfolk Southern closes and delivers its promised service improvements. Berkshire Hathaway (BRK.B: United States), through BNSF, faces a related competitive issue, although the effect is more diluted at the parent-company level.
The call repeatedly identified fewer interchange events, faster transit, and lower customer supply-chain costs as the merger’s principal benefits. Rocker described customers with large private railcar fleets that could benefit from improved equipment turns. These comments identify the commercial mechanism more precisely than a general claim that a larger railroad is stronger.
A combined Union Pacific-Norfolk Southern network could offer some customers a single commercial and operating interface across routes that currently require interline coordination. If reliability improves and handoffs decline, competing routes may need to respond through better service, investment, or price concessions. CSX could also face a less favorable position in competing for traffic that Union Pacific can route over its own eastern network.
This does not mean existing gateways will close or that traffic losses are inevitable. Regulatory protections, customer choice, network geography, and competing service improvements can limit the effect. The adverse direction is conditional on successful execution of the merger’s claimed benefits, not merely legal completion.
Vena’s willingness to contemplate a hypothetical CSX-BNSF combination is not evidence that either company intends to pursue it. The call also described Berkshire’s opposition to the current merger. A takeover premium for CSX cannot be justified solely by the acquirer’s comments about what competitors could eventually do.
Near-term trading catalysts are regulatory filings and competing service announcements. The operating impact would principally arise after closing and integration, likely from late 2027 onward. The most important valuation distinction is between an identifiable future competitive challenge and an unverified assumption that another merger will automatically compensate shareholders.
PETROCHEMICAL PROJECT OWNERS: GOLDEN TRIANGLE PROVIDES A VERIFIED EXECUTION SIGNAL FOR PHILLIPS 66 AND CHEVRON (READ-THROUGH 7)
Phillips 66 (PSX: United States) and Chevron Corporation (CVX: United States) receive a positive project-execution read-through from Golden Triangle Polymers. The potential fundamental effect is more meaningful relative to Phillips 66’s chemicals exposure and smaller relative to Chevron’s consolidated business. The immediate incremental trading signal is modest because the project is already disclosed.
Rocker specifically highlighted the Golden Triangle Polymers plant in Texas continuing “commissioning and start-up activities towards full operations.” A transportation provider identifying activity around a named project provides useful corroboration that the asset is progressing toward a freight-generating operating phase.
The ownership chain is important. Golden Triangle is owned 51% by Chevron Phillips Chemical and 49% by QatarEnergy. Chevron Phillips Chemical is owned equally by Chevron and Phillips 66, giving each listed parent an indirect 25.5% interest in the project. The publicly traded beneficiaries are therefore the parent companies, not a separately listed Chevron Phillips Chemical entity.
The project includes approximately 2.08 million metric tons of annual ethylene capacity and 2 million metric tons of annual high-density polyethylene capacity. Its current project materials identify startup in 2027. The call’s reference to commissioning should not be interpreted as evidence that full commercial production has already begun or that the timetable has accelerated.
The transmission mechanism is the transition from construction expenditure toward operating output and eventual cash generation. An integrated Gulf Coast ethane-based facility also adds production with a potentially favorable feedstock position relative to higher-cost competing assets. Successful commissioning reduces a component of execution risk, but it does not establish utilization, realized polymer margins, or project returns.
The near-term catalysts are owner updates on commissioning, remaining capital, and startup readiness. The longer-duration benefit depends on the 2027 ramp and market conditions thereafter. This is positive evidence about a specific asset, not a justification for assuming immediate consolidated earnings accretion.
GLOBAL CHEMICALS: STRONGER U.S. PLASTICS EXPORTS CAN SIGNAL SHARE REDISTRIBUTION RATHER THAN A GLOBAL DEMAND RECOVERY (READ-THROUGH 8)
Lotte Chemical Corporation (011170: South Korea) faces a negative competitive read-through for exposed Asian petrochemical operations. LyondellBasell Industries (LYB: Netherlands) faces a more mixed but negative incremental supply effect in competing polyethylene markets, partly offset by its own advantaged production assets. The potential magnitude is moderate within exposed commodity businesses, with greater effects possible when industry margins are already narrow.
The supporting call commentary has 2 distinct elements. Rocker said plastics export demand was strong because customers were responding to “disruptions in global supply.” He also identified Golden Triangle’s progress toward operation. The first observation describes a potentially temporary redistribution of supply; the second points to a durable addition to supply capacity.
The transmission mechanism is export competition. During disruptions, U.S. producers can fill supply gaps and gain shipments without an equivalent increase in global end demand. As disrupted capacity returns, those exceptional export opportunities may narrow. Additional Gulf Coast polyethylene capacity then competes for customers in the same internationally traded markets.
For Lotte’s naphtha-based operations, the risk is pressure on utilization and product netbacks when competing against large ethane-based production. Lotte’s diversified assets mean the company is not a pure exposure to that disadvantage. For LyondellBasell, the issue is additional competing polyethylene supply rather than a claim that all of its facilities are structurally high-cost.
This is not evidence that polyethylene prices must fall immediately. Demand growth, operating rates, shutdowns, logistics costs, and the pace of new capacity ramp-up will determine the actual price response. The high-conviction conclusion is narrower: stronger Union Pacific plastics traffic does not, by itself, validate a bullish global chemical-spread thesis.
Near-term effects can favor U.S. utilization while disruptions persist. The longer-duration competitive pressure emerges as new capacity ramps in 2027 and beyond. The cross-portfolio implication is that a railroad can benefit from higher chemical shipments while an incumbent chemical producer experiences weaker margins. Freight-volume growth and chemical profitability should not be treated as interchangeable signals.
THERMAL COAL: HIGH DIESEL PRICES DO NOT TRANSLATE INTO A BROAD COAL-DEMAND TAILWIND (READ-THROUGH 9)
Peabody Energy (BTU: United States) and Core Natural Resources (CNR: United States) receive a negative demand read-through for their Powder River Basin thermal-coal businesses. The effect is moderate at the exposed operating-segment level and more limited or variable at the consolidated level because both companies have other coal exposures.
Union Pacific reported a 3% decline in coal and renewables volume and identified lower natural gas prices and elevated inventories as the causes. Management stated that those conditions would remain challenging. This is more informative for near-term coal demand than the simultaneous increase in railroad revenue from the category.
The mechanism runs through utility dispatch and inventory management. Lower natural gas prices improve the competitiveness of gas-fired generation, reducing coal burn at plants where dispatch is responsive to fuel economics. Elevated coal inventories then allow utilities to meet consumption from existing stockpiles, reducing replenishment shipments and potentially delaying contracted deliveries.
For producers, weaker shipments can reduce fixed-cost absorption and operating cash generation even when contract prices remain relatively stable. Inventory conditions can also weaken negotiating leverage for future commitments. Peabody’s substantial Powder River Basin operations and Core’s Black Thunder and Coal Creek mines provide direct exposure to this mechanism.
The coexistence of expensive diesel and inexpensive natural gas is the important cross-market signal. “Higher energy prices” is not a sufficiently precise investment thesis: different fuels are transmitting different incentives. The call also weakens the assumption that growth in electricity demand automatically produces an equivalent increase in coal shipments. Generation mix and inventory levels remain decisive.
Near-term catalysts are Q4 shipment schedules, utility inventory drawdowns, weather, and natural gas prices. The longer-duration vulnerability is the sensitivity of marginal thermal-coal demand to competing generation economics. The read-through should not be extended indiscriminately to metallurgical coal, export coal, or every mine owned by the affected companies.
Report record
- Sector
- Industrials
- Fiscal period end
- September 30, 2026
- Report date
- October 22, 2026
- Analysis
- 8379 words
- Read-throughs
- 3131 words
- Content fingerprint (PDF)
516039276f7f- Content fingerprint (analysis)
33a4955e02a1- Content fingerprint (read-throughs)
5b7a7562c133
Prepared from the company's earnings release and earnings call transcript. Figures as reported by the company. For information only. Not investment advice.
More from Union Pacific Corp
No other reports yet.
All Union Pacific Corp reports
More in Industrials
Earnings Expansion Durable, but the Beat Was Not Unequivocal
Improved visibility into 2027 rather than a substantial upgrade to 2026 earnings
Follow @AtlasPeakRes on X for new earnings reports as they publish.