AI Participation Is Proven; a Consolidated Growth Inflection Is Not
Earnings Reports
VeriSign, Inc. FQ3 2026 Earnings Report
VeriSign, Inc. (VRSN) FQ3 2026 earnings: Core Registry Strengthened; the New-Product Case Remains Unproven. Full earnings analysis, key read-throughs, and the one-page exhibit from Atlas Peak Research.
VeriSign, Inc. (VRSN)
Sector: Information Technology · FQ3 2026 · Period end September 30, 2026 · Reported October 22, 2026
VeriSign’s Q3 2026 earnings call strengthened the investment case for the core domain registry business, but did not establish a sufficiently quantified contribution from new products to justify a materially higher valuation independently of the existing franchise.
Download the one-page report (PDF)
View one-page exhibit
Download analysis (.md)
Download read-throughs (.md)
Post to X
One-Page Exhibit
Earnings Analysis
EXECUTIVE CALL SUMMARY: VeriSign, Inc. (10/22/26)
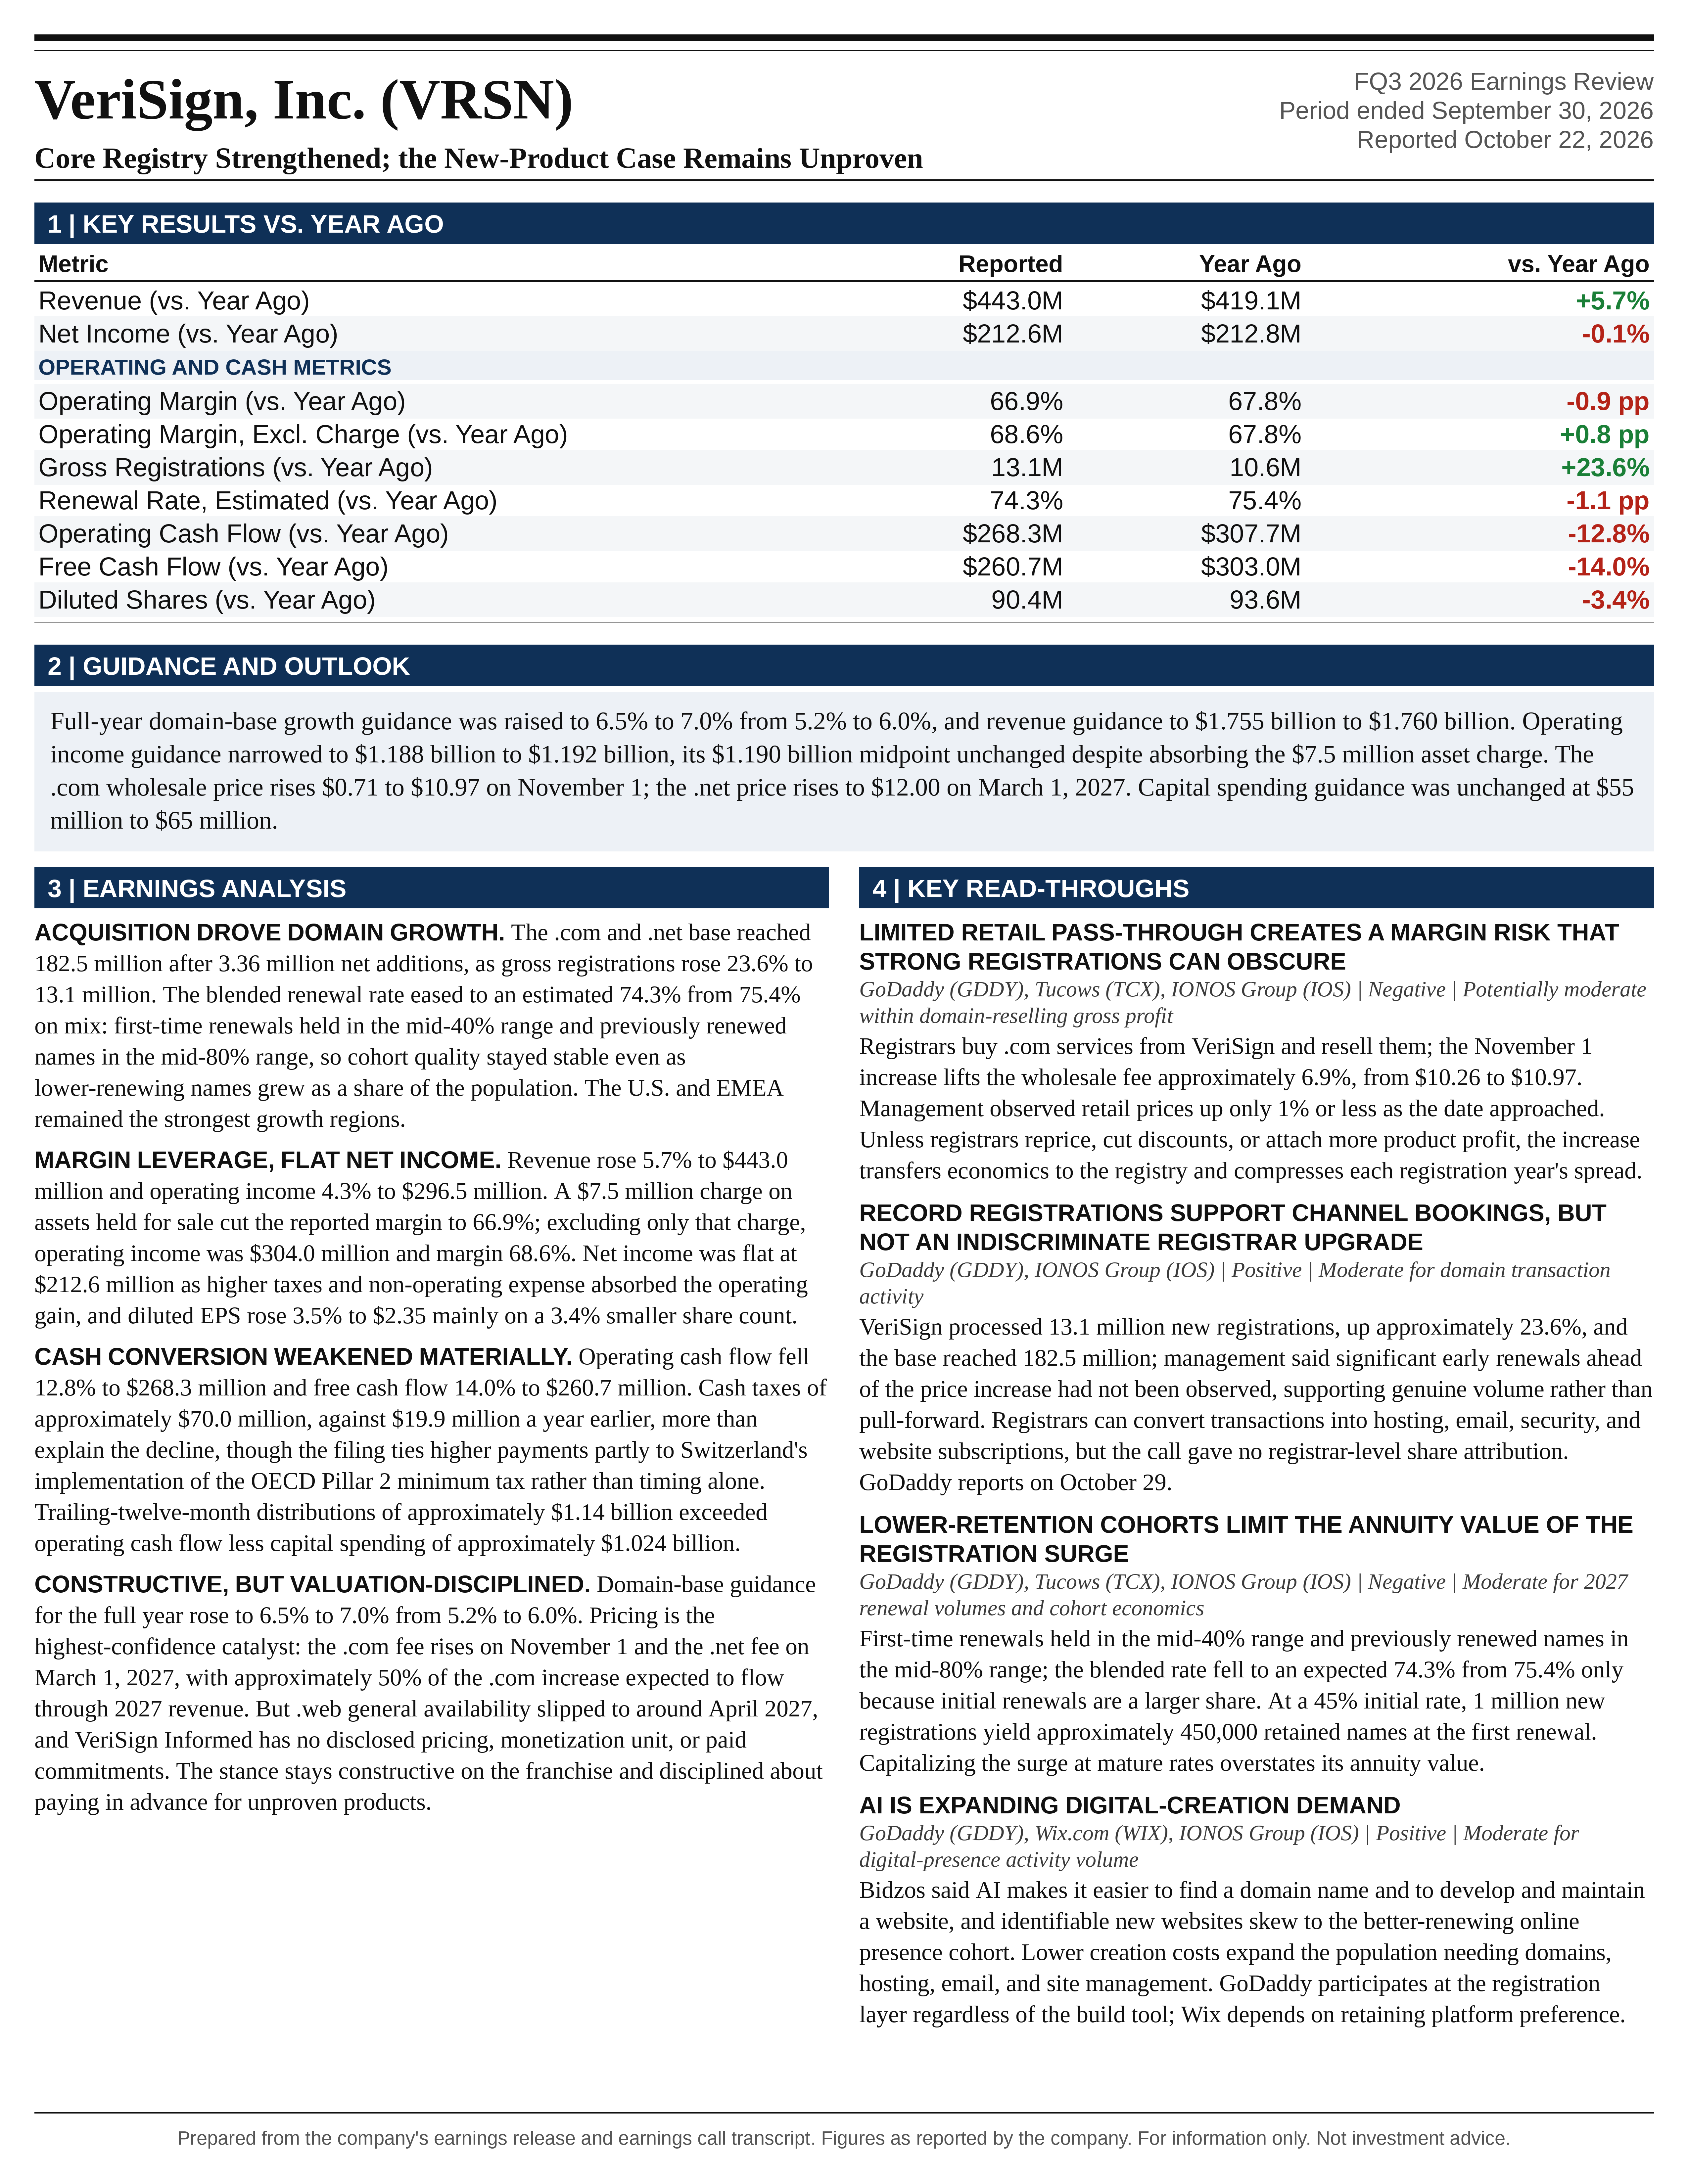
VeriSign’s Q3 2026 earnings call strengthened the investment case for the core domain registry business, but did not establish a sufficiently quantified contribution from new products to justify a materially higher valuation independently of the existing franchise. Record registrations, accelerating net additions, stable renewal behavior within customer cohorts, and a substantial increase in domain-base guidance support a stronger revenue trajectory into 2027. The principal qualification is that operating momentum translated into only modest reported EPS growth and lower cash generation. The appropriate fundamental stance is constructive on the business and valuation-disciplined on the shares: retain exposure to the core compounding franchise, but avoid paying in advance for an unproven cybersecurity revenue stream or an aggressive .web adoption curve.
Revenue increased 5.7% to $443.0 million, operating income increased 4.3% to $296.5 million using the detailed financial statements, and diluted EPS increased 3.5% to $2.35. A $7.5 million charge to reduce the carrying value of assets held for sale obscured stronger underlying operating performance. Excluding only that charge, operating income would have been $304.0 million, up 6.9%, and operating margin would have reached 68.6%, compared with 67.8% a year earlier. EPS would have been approximately $2.41 using the company’s disclosed $0.06 impact. These are analytical adjustments, not separately reported company non-GAAP earnings measures.
The most consequential guidance change was operational rather than immediately financial. Full-year domain-base growth guidance increased to 6.5%-7.0% from 5.2%-6.0% on the July 23 call. That represents approximately 2.0 million additional year-end domains at the midpoint. Revenue guidance increased by $7.5 million at the midpoint to $1.7575 billion. Reported operating-income guidance retained its $1.190 billion midpoint despite incorporating the $7.5 million charge. Consequently, the underlying operating-profit outlook improved, but the headline GAAP earnings outlook did not increase at the midpoint.
The highest-confidence forward catalyst is the November 1 .com wholesale price increase, followed by the previously announced March 1, 2027 .net increase disclosed in the quarterly filing. The more speculative catalysts are .web general availability around April 2027 and VeriSign Informed production availability in H1 2027. Importantly, .web’s broad commercial launch is later than the late-2026 or very-early-2027 general-availability expectation discussed on the prior call. VeriSign Informed is technically operational and entering commercial validation, but pricing, the monetization unit, paid customer commitments, and revenue expectations remain undisclosed.
The quarter therefore supports higher confidence in core revenue growth and operating leverage, not an unrestricted growth-stock reclassification. The investment debate has shifted toward the durability of acquisition-driven domain growth, the conversion of the enlarged registration cohorts into recurring renewals, and the price at which the existing cash-flow stream is being capitalized.
OPERATING PERFORMANCE AND EARNINGS QUALITY
The detailed earnings release shows revenue of $443.0 million against $419.1 million in Q3 2025 and $434.6 million in Q2 2026. Sequential growth was 1.9%. Revenue growth moderated slightly from 6.0% in Q2, even as domain-base growth accelerated from 5.1% to 6.1%. This is not inherently contradictory. Ending domain counts, average revenue-generating registration periods, promotional economics, and the recognition of previously collected registration fees operate on different schedules. Stronger late-period registrations create more forward revenue visibility than immediate recognized revenue.
Reported operating expenses increased to $146.5 million from $134.8 million a year earlier and $138.3 million sequentially. The $7.5 million asset-related charge accounted for approximately 64% of the year-over-year increase and approximately 91% of the sequential increase. Excluding that item, expenses were $139.0 million, up 3.1% year over year and approximately 0.5% sequentially. The underlying cost base therefore grew substantially more slowly than revenue.
The September 30 Form 10-Q clarifies that the charge related to property and equipment already classified as held for sale, including at December 31, 2025. It was recorded within selling, general and administrative expenses to adjust those assets to estimated fair value less selling costs. It should not be conflated with an impairment of .web or evidence of a failed VeriSign Informed investment. Equally, excluding it for operating comparability does not eliminate the economic loss associated with the asset disposal.
Reported operating margin declined approximately 91 basis points year over year to 66.9%. After the charge adjustment, margin increased approximately 79 basis points to 68.6%. The implied adjusted incremental operating margin was approximately 82% on the $23.9 million revenue increase. That provides tangible evidence that the registry infrastructure continues to support substantial operating leverage. It does not establish that every future revenue increment will convert at that rate, particularly if new-product commercialization requires additional marketing, channel economics, support, or compliance spending.
The cost composition reinforces that conclusion. Cost of revenue increased only $1.0 million to $49.8 million, while research and development increased $1.1 million to $26.5 million. Selling, general and administrative expense increased $9.6 million, of which $7.5 million was the asset charge. Excluding that charge, the increase in selling, general and administrative expense was approximately 3.5%. There was no broad-based Q3 expense acceleration consistent with an uncontrolled investment cycle.
Net income was essentially unchanged at $212.6 million versus $212.8 million. The bridge from operating growth to flat net income is important. Operating income improved $12.2 million, but net interest and other non-operating expense increased $4.3 million, while income-tax expense increased $8.1 million. The effective tax rate rose to approximately 24.0% from 21.7%. Consequently, the weak net-income growth should not be attributed entirely to the asset charge or entirely to deterioration in the underlying franchise.
Diluted shares declined 3.4% to 90.4 million from 93.6 million. Virtually all reported EPS growth therefore came from the smaller share denominator rather than higher total net income. That is a legitimate benefit of capital allocation, but it differs economically from organic earnings expansion. Even after removing the disclosed $0.06 charge impact, approximately 6.2% EPS growth was not evidence of a major earnings acceleration. The strongest acceleration remains in the operational leading indicators.
DOMAIN GROWTH: STRONGER ACQUISITION, NOT DEMONSTRABLY BETTER RETENTION
The combined .com and .net base reached 182.5 million registrations, with an exact quarterly net increase of 3.36 million in the earnings release. This exceeded Q2’s 3.05 million net additions by approximately 10.2%. Gross registrations reached 13.1 million, up 23.6% from 10.6 million a year earlier and 3.1% from 12.7 million sequentially. The result extended the acceleration from 11.5 million gross registrations in Q1.
The distinction between gross acquisition and net retention is central. Subtracting net additions from gross registrations produces an approximate Q3 deletion residual of 9.74 million names, compared with approximately 9.65 million in Q2. These are rounded stock-flow calculations, not a company-disclosed deletion series, and are subject to timing and definitional differences. Nevertheless, they indicate that the sequential improvement in net additions was predominantly acquisition-led rather than driven by a large reduction in deletions.
Management described the drivers as a “synergistic convergence of demand for domain names from businesses, new business starts, but also our marketing programs and an AI tailwind.” This is a plausible description of interacting demand factors, but not a quantified attribution. No numerical decomposition was provided between underlying business formation, registrar promotional activity, AI-assisted website creation, or other sources of demand. The evidence supports stronger registrations; it does not establish how much growth would remain if marketing support or registrar acquisition priorities changed.
The estimated Q3 renewal rate declined to 74.3% from 75.4% a year earlier. It also declined from Q2’s final 75.2% and Q1’s final 76.3%. Q3 remained an estimate because renewals are not fully measurable until 45 days after quarter-end. That distinction matters when assessing whether the deterioration is precisely tracking expectations.
The most important renewal disclosure was the absence of meaningful improvement or deterioration within cohorts. John Calys stated that first-time renewals “have remained fairly steady in the mid-40% range” and previously renewed names “have remained fairly steady in the mid-80% range.” The call therefore did not validate the suggestion that unusually strong gross registrations were already producing higher initial renewal rates. It validated stability in cohort quality despite higher registration volumes.
A simple mix calculation illustrates the mechanism. Assuming representative renewal rates of 45% for initial renewals and 85% for previously renewed names, a 74.3% blended rate implies that approximately 26.8% of the renewal-eligible population consists of initial renewals. A 75.4% blended rate implies approximately 24.0%. A shift of roughly 2.8 percentage points in that renewal population could explain the entire observed decline without any deterioration within either cohort. These percentages are illustrative, not disclosed cohort weights, and should not be applied to the entire registered domain base.
The cash-flow value of the growth depends on eventual renewal conversion. Under a simplified assumption that the additional 2.5 million Q3 gross registrations versus last year are all annual registrations and renew initially at 45%, approximately 1.1 million would survive the first renewal event. The initial registration year still generates revenue, but the more valuable durable contribution emerges only after renewal. This explains why gross registration growth cannot be capitalized as though every incremental domain will remain indefinitely.
Management’s observation that identifiable new websites disproportionately fall within the better-renewing “online presence cohort” is encouraging. It is not yet decisive evidence. The qualification “to the extent we can identify the purpose of the websites” creates potential selection bias: domains with identifiable operating websites may be more representative of committed users than the unclassified population. The strongest validation will be actual renewal behavior of the enlarged 2026 cohorts during 2027.
GEOGRAPHIC QUALITY, MARKET SHARE, AND THE AI INTERPRETATION
The U.S. and EMEA remained the strongest growth regions. The quarterly filing provides corroborating revenue evidence: U.S. revenue increased approximately 7.0% to $295.1 million, EMEA increased approximately 9.6% to $78.0 million, and APAC was approximately flat at $46.8 million. Geographic revenue is based on customer billing addresses, principally registrars, rather than the ultimate location of every registrant. It should therefore be treated as a channel-geography indicator, not a precise map of end-user demand.
The regional pattern is directionally more reassuring than the speculative China-led registration surge referenced by management from 2016. However, the comparison does not eliminate promotional churn risk. The relevant distinction is whether registrations support durable operating websites and business identities rather than temporary inventory accumulation, regardless of geography.
The broader industry data also prevents an overly bullish market-share interpretation. VeriSign’s October 22 Domain Name Industry Brief release reported 411.6 million registrations across all top-level domains, up 8.7% year over year. The .com/.net base grew 6.1%. Their combined share of total registrations therefore declined approximately from 45.4% to 44.3%, using the reported rounded counts. VeriSign is benefiting from industry expansion, but the quarter does not demonstrate aggregate domain-unit share gains. Differences in pricing, registration quality, and renewal economics mean that unit share is not equivalent to revenue share or economic value.
AI plausibly improves domain demand by lowering the cost of finding names, creating websites, maintaining content, and launching small businesses. It may also increase the importance of persistent machine-readable identities. The countervailing possibility is that more activity occurs within large platforms, existing domains, hosted subdomains, or agent ecosystems without requiring a new separately registered domain for every application or agent.
Management’s approximately 800 billion daily DNS queries demonstrate infrastructure relevance and scale. They are not a direct revenue driver under the existing registry model. Increased queries to an existing domain do not create incremental registration fees. Query growth may strengthen strategic relevance while simultaneously increasing infrastructure requirements. The economic bridge from AI activity to registry revenue remains incremental paid domains, renewal retention, and realized pricing, not DNS traffic alone.
The security language also requires precision. Reliable DNS operation and cryptographically protected DNS responses do not establish that the underlying website content is accurate, that its operator is trustworthy, or that an AI-generated assertion is authentic. VeriSign’s infrastructure can improve the integrity and availability of naming and validation services without guaranteeing the truthfulness of the activity conducted through them.
GUIDANCE REVISIONS AND THE IMPLIED Q4
The increase in domain-base guidance from 5.2%-6.0% to 6.5%-7.0% is substantial. The midpoint increased 1.15 percentage points, and the range narrowed from 0.8 percentage points to 0.5 percentage points. Using the disclosed 173.5 million year-end 2025 base, the revised forecast implies approximately 184.8 million-185.6 million domains at year-end 2026.
Against 182.5 million at September 30, that implies approximately 2.3 million-3.1 million Q4 net additions, compared with 3.36 million in Q3. Management is therefore not assuming that the latest quarterly net-addition pace continues unchanged. The forecast incorporates holiday seasonality and an increasing mix of lower-renewing initial cohorts. The implied deceleration is consistent with management’s explanation, rather than an obvious contradiction of its positive demand commentary.
Revenue guidance increased from $1.745 billion-$1.755 billion to $1.755 billion-$1.760 billion. The midpoint increased approximately 0.4%, while the range narrowed by 50%. Against 2025 revenue of $1.6566 billion, the revised midpoint implies approximately 6.1% growth.
Operating-income guidance narrowed from $1.185 billion-$1.195 billion to $1.188 billion-$1.192 billion. Both ranges have a $1.190 billion midpoint. Because the new range includes the $7.5 million charge, an analytical charge-excluded range would be $1.1955 billion-$1.1995 billion, with a $1.1975 billion midpoint. The apparent absence of a reported profit upgrade therefore masks a $7.5 million improvement on a comparable basis.
The matching $7.5 million increases in revenue and charge-excluded operating-income midpoints imply very strong incremental profitability in the revised forecast. That should not be interpreted as a formally guided 100% marginal operating margin. Midpoint comparisons combine different forecast ranges and expense assumptions. The defensible conclusion is that the additional revenue outlook was not accompanied by a comparable increase in underlying expense expectations.
Using reported 9-month results, full-year guidance implies Q4 revenue of $448.5 million-$453.5 million and operating income of $301.6 million-$305.6 million. These compare with $425.3 million and $284.8 million, respectively, in Q4 2025. Implied Q4 revenue growth is approximately 5.5%-6.6%, while operating-income growth is approximately 5.9%-7.3%. The midpoint operating margin is approximately 67.3%. The forecast thus supports continued growth, but not an immediate revenue acceleration matching the latest gross registration growth.
Net interest and non-operating expense guidance remained $59 million-$65 million, capital expenditure guidance remained $55 million-$65 million, and the effective tax-rate range remained 22%-25%. At the operating-income midpoint, the midpoint net non-operating expense and midpoint tax rate imply approximately $863 million in annual net income before any forecast deviations. This is an analytical implication, not company EPS guidance. Because the reported operating-income midpoint and these below-the-line assumptions were unchanged, the call did not materially raise the central GAAP net-income outlook.
PRICING: HIGH-CONFIDENCE UPSIDE WITH DELAYED RECOGNITION
The .com wholesale fee rises from $10.26 to $10.97 on November 1, an increase of $0.71, or approximately 6.9%. The quarterly filing also confirms that the .net wholesale fee will rise from $10.91 to $12.00 on March 1, 2027, approximately 10.0%. The .net increase was announced on August 27 and is relevant to the forward earnings trajectory even though it received little attention in this call.
Management’s observation that registrar retail prices had risen only approximately 1% or less since the .com notice supports the possibility of limited immediate end-customer disruption. It does not prove that registrars will permanently absorb the increase. Retail pricing decisions may occur closer to the effective date, differ across customer groups, or appear through changes to promotions and bundled offerings rather than published headline prices.
Bidzos emphasized that many registrars renew .com names at approximately twice the wholesale fee. At an illustrative $20.52 retail renewal price, passing through the entire $0.71 wholesale increase would raise the retail price approximately 3.5%, not 6.9%. This helps explain why the increase can be manageable for an operating business. Conversely, low-priced introductory registrations and large speculative portfolios may have materially greater sensitivity.
There was no evidence of significant early-renewal acceleration at the time of the call. Calys stated, “we have not seen a lot of early renewals at this point.” That reduces concern that the observed demand strength was primarily a cash or registration pull-forward ahead of the price increase. It does not eliminate the possibility of activity during the remaining period before November 1.
The revenue-recognition reminder was particularly important. David Atchley reiterated that approximately “50% of the .com price increase” is expected to flow through revenue in 2027, with most of the balance in 2028. This is not a forecast of 50% revenue growth or a statement that every domain immediately reprices in recognized revenue. Existing registration terms, renewal dates, and deferred-revenue recognition spread the effect over time.
The industry brief reported approximately 169.8 million .com registrations at September 30. Multiplying that static base by $0.71 produces approximately $120.6 million of annualized gross fee uplift at full penetration. Applying management’s approximate 50% recognition comment produces a rough $60 million 2027 sensitivity, equivalent to approximately 3.4% of the 2026 revenue-guidance midpoint. This is not company guidance. It excludes changes in domain volumes, promotional discounts, registration duration, mix, and the precise recognition schedule.
The corresponding static .net calculation, using approximately 12.6 million names and a $1.09 increase, produces approximately $13.7 million of fully penetrated annual fee uplift. Only a portion would be recognized in 2027 because the increase begins in March and recognized revenue follows registration terms. The combined implication is that already announced pricing provides meaningful support for 2027 and 2028 without requiring aggressive new-product assumptions.
CASH FLOW: TAXES EXPLAIN MUCH OF THE DECLINE, BUT NOT ALL PRESSURE IS TEMPORARY
Q3 operating cash flow was $268 million and reported free cash flow was $261 million, compared with $308 million and $303 million a year earlier. Using the current and prior interim cash-flow statements, the more precise quarterly amounts are $268.3 million of operating cash flow and $260.7 million after $7.6 million of property-and-equipment purchases. The comparable prior-year amounts were $307.7 million and $303.0 million.
Operating cash flow therefore declined approximately 12.8%, and free cash flow declined approximately 14.0%. Free cash flow remained strong at approximately 58.8% of revenue and approximately 123% of net income. The business continues to convert a substantial proportion of revenue into cash, but Q3 cash performance was materially weaker than the earnings narrative alone suggested.
The tax bridge is revealing. Subtracting H1 cash-tax payments from the 9-month totals produces Q3 cash taxes of approximately $70.0 million versus $19.9 million a year earlier. The $50.1 million increase exceeded the $39.4 million operating-cash-flow decline. Holding only cash-tax payments constant would have produced approximately $10.7 million of operating-cash-flow growth. That is a sensitivity, not a normalized cash-flow forecast, because cash taxes are a recurring economic obligation.
The quarterly filing specifically attributes higher year-to-date tax payments to higher taxable income and higher non-U.S. payments associated with Switzerland’s implementation of the OECD Pillar 2 minimum tax. Accordingly, the entire increase should not be assumed to reverse as a timing item. Employee and vendor payments also increased, reflecting both expense growth and payment timing.
For the first 9 months, operating cash flow declined to $772.3 million from $801.5 million. Operating cash flow less property-and-equipment purchases declined approximately 5.7% to $738.7 million from $783.2 million. Capital spending increased to $33.6 million from $18.3 million. This broader comparison confirms that Q3 was not the only period in which cash conversion lagged the income statement.
The unchanged $55 million-$65 million annual capital-spending forecast implies $21.4 million-$31.4 million in Q4 expenditure. That is substantially above Q3’s $7.6 million. A sequential increase in Q4 capital spending is therefore embedded in guidance and should be reflected in near-term cash-flow expectations.
Deferred revenue increased to $1.463 billion, including $1.094 billion classified as current. The Q3 increase was approximately $14.4 million, compared with approximately $4.6 million in the prior-year quarter. Revenue plus the change in deferred revenue produces a rough billing proxy of $457.4 million, up approximately 8.0%. That supports the view that forward activity was stronger than recognized revenue, although the proxy is not identical to customer cash collections because deposits, receivables, credits, and other adjustments intervene.
The $7.5 million asset charge should not be added again to free cash flow merely because it is excluded from an analytical earnings measure. The operating cash-flow reconciliation already captures noncash adjustments. Repeating the adjustment would overstate economic cash generation.
CAPITAL ALLOCATION AND BALANCE-SHEET CAPACITY
VeriSign returned approximately $1.14 billion through repurchases and dividends over the trailing 12 months. Operating cash flow less property-and-equipment purchases over that same period was approximately $1.024 billion, derived from the annual and interim statements. Distributions therefore exceeded this cash-flow measure by approximately 12%.
The policy is supportable over limited periods, but it is not a perpetual source of incremental return. Distributions above internally generated cash ultimately require lower liquidity, higher borrowing, asset proceeds, or subsequent cash-flow growth. The investment-grade commitment provides an important constraint on how far capital returns can be expanded.
Cash, equivalents, and marketable securities were $476.1 million at September 30. The large sequential decline from approximately $1.034 billion at June 30 primarily reflects the July repayment of $550 million of notes after their replacement debt had already been issued in June. It should not be interpreted as a comparable operating cash burn.
Long-term senior notes had a carrying amount of approximately $1.786 billion, producing net debt of approximately $1.310 billion. That is approximately 1.1 times the annual operating-income guidance midpoint, not an EBITDA-based leverage ratio. Balance-sheet capacity remains reasonable relative to recurring operating profitability, although deferred-revenue obligations, infrastructure spending, and rating requirements remain economically relevant.
The refinancing replaced $550 million of 4.75% notes due in 2027 with 5.10% notes due in 2031. The 35-basis-point coupon increase adds approximately $1.9 million of annual interest before issuance-cost amortization and other timing effects. The transaction extended maturity risk rather than creating a material earnings burden.
The $0.81 quarterly dividend equates to $3.24 annually if maintained. At the September 30 share count, the annualized cash requirement is approximately $291 million before subsequent repurchases. The dividend was unchanged from Q2, rather than newly increased on this call.
Q3 open-market program repurchases totaled $189.1 million at an average price of $282.34. The filing separately identifies shares repurchased for employee tax withholding. Year-to-date program purchases were $600.3 million, while total repurchases including withholding were $620.0 million. That distinction matters when assessing discretionary capital allocation and comparing announced shareholder returns with financing cash flows.
Repurchases clearly contributed to EPS growth, but EPS accretion alone does not establish value creation. The remaining $1.36 billion authorization is permission to buy, not a commitment or an independent valuation signal. Repurchase effectiveness depends on the price paid relative to future cash generation.
.WEB: BETTER COMMERCIAL DEFINITION, LATER BROAD AVAILABILITY
The call provided a more actionable .web timetable. The required 30-day sunrise period is planned to begin in mid-December, followed by a limited registration period beginning in mid-January and potentially continuing into early April 2027. General availability is expected afterward.
This is later than the prior call’s expectation that general availability would occur in late 2026 or very early 2027. The distinction between beginning a restricted launch process in 2026 and opening broad commercial availability in 2027 is economically important. The latest timetable does not imply a major change to 2026 earnings because management previously expected little revenue or expense contribution. It does reduce the portion of 2027 available for unrestricted customer acquisition and subsequent revenue recognition.
During the limited registration period, most holders of .com domains are expected to have an opportunity to obtain the exact-match .web name. This creates a natural distribution mechanism through the installed base. It may produce defensive registrations, companion sites, brand protection, or genuinely incremental websites. Those use cases have different renewal economics and should not be treated as interchangeable.
The revenue opportunity depends on the number of eligible .com names, take-up, realized wholesale pricing, premium-name economics, registration timing, and renewal behavior. As a scale illustration, 1% take-up against approximately 169.8 million .com registrations would represent approximately 1.7 million names before eligibility restrictions. At an assumed $10 annual realized wholesale fee, those names would represent approximately $17 million of annualized registration revenue after full recognition. Neither the take-up rate nor the price is guided, and launch-year recognized revenue would be lower if registrations occur progressively.
VeriSign’s principal advantages are distribution access, infrastructure integration, and pricing flexibility. Management stated that the agreement permits premium names and greater marketing flexibility than .com and .net. These provisions can support differentiated monetization and registrar incentives. They do not remove the need to create end-user demand for a new namespace.
Premium-name monetization also complicates comparisons with the mature registry model. Initial premium sales may differ from recurring renewal fees in price, timing, and durability. A large launch-period billing number would not automatically establish a comparable recurring revenue run rate.
The filing adds an important accounting point: .web is recorded as a $171.4 million indefinite-lived intangible asset, consisting of a $145.2 million deposit reclassification and $26.2 million of additional capitalized acquisition costs. It is not amortized and will be tested for impairment annually. Consequently, reported operating margins will not include systematic amortization of this acquisition investment. Economic returns should still be judged against the capital committed, rather than treating future operating profit as costless optionality.
Cannibalization is another relevant variable. Additional .web registrations alongside retained .com names are incremental. A .web registration replacing a .com registration is not fully incremental at the company level. The launch structure appears designed to encourage companion ownership, but actual registration and renewal behavior will determine the outcome.
VERISIGN INFORMED: CREDIBLE TECHNICAL ADJACENCY, UNPROVEN COMMERCIAL MODEL
VeriSign Informed addresses certificate-status freshness. Its central function is to provide current information about whether a certificate has been revoked when a trust decision is made. Bidzos summarized the proposition directly: “At its core, VI answers the question, has this certificate been revoked?”
The technical relevance is credible. Certificates underpin network authentication, software signing, secure communications, device identity, and other machine-to-machine interactions. When applications rely on stale status information, a revoked credential may continue to be accepted. High availability and low-latency status checking can reduce that exposure, particularly where automated activity compresses the interval between compromise and exploitation.
The strongest financial reassurance was management’s statement: “All financial data from 2024 up to and including our guidance through 2026 includes all VI expense.” This indicates that the development and current operating effort is already reflected in the historical cost base and current guidance. The company is not presenting a product whose disclosed operating history excludes all prelaunch expense.
That statement should not be extended into a claim that commercialization will require no incremental spending. Production support, service-level commitments, integrations, channel compensation, audits, customer acquisition, and infrastructure growth can create additional costs. Existing infrastructure leverage improves the opportunity, but does not establish a future product margin.
The commercial disclosure remained incomplete. Pricing is expected by year-end, with production availability in H1 2027. Management did not specify whether the monetization unit will be queries, certificates, provisioned identities, reserved capacity, or another subscription structure. It also did not disclose paid customers, contracted revenue, minimum commitments, pilot conversions, or a financial target.
The absence of a monetization unit prevents reliable market sizing. A per-query model would make transaction intensity more directly relevant, but could also introduce volume discounts, caching incentives, and cost-management behavior. A per-certificate model would depend more heavily on enrolled identity counts and pricing per identity. A capacity or subscription model would depend on procurement decisions and service tiers. The same technical adoption can therefore produce materially different revenue outcomes.
Management’s proposed distribution through registrars, PKI providers, application vendors, and self-service provisioning may reduce integration friction. However, the ability to provision a service through an existing channel is not the same as proven channel demand. Enterprise PKI purchasing, compliance review, and security architecture decisions differ from ordinary domain registration.
COMPETITIVE AND TECHNICAL LIMITS OF THE VALIDATION OPPORTUNITY
VeriSign has a credible advantage in operating globally distributed, high-availability infrastructure. The unproven element is whether that advantage is sufficiently differentiated, economically valuable, and difficult to replicate to create a durable paid service franchise.
The relevant comparison is not the entire cybersecurity market. It includes certificate-authority status services, outsourced OCSP infrastructure, enterprise PKI systems, certificate revocation lists, stapling mechanisms, shorter-lived certificates, and application-specific trust policies. Incumbents may act as customers or distribution partners, but can also provide competing functionality or resist surrendering economics.
Independent industry developments reinforce the need for segmentation. Let’s Encrypt shut down its OCSP service on August 6, 2025 and moved to certificate revocation lists, citing privacy and operational considerations. The CA/Browser Forum also approved a schedule reducing maximum public TLS certificate validity toward 47 days by 2029. These developments do not invalidate VeriSign Informed, but they show that large parts of the public-web certificate ecosystem have pursued alternatives to traditional online status checking.
VeriSign’s own technical discussion acknowledges that browser vendors have largely moved away from OCSP and argues that private PKI, code signing, provenance, and machine identity remain attractive applications. The most credible initial commercial framing is therefore a targeted high-assurance validation service for applications where freshness has substantial economic value, rather than universal replacement of public-web certificate-status infrastructure.
Latency is only part of the security problem. A rapid status response cannot reveal a compromise that has not been detected and reported by the relevant authority. It cannot repair compromised endpoints, prevent every misuse of a valid credential, or independently determine whether an authorized AI agent is acting appropriately. Effective protection also depends on issuer update propagation, client checking behavior, status-cache policies, and what the application does when the service cannot be reached.
Privacy and operational dependence remain relevant even if response times improve. External status queries can reveal information about certificate usage unless the architecture and deployment model address that exposure. Hard-fail policies can improve security but introduce availability risk; soft-fail policies can preserve availability while weakening enforcement. These trade-offs require production evidence, not only low-latency demonstrations.
The company-sponsored Forrester survey supports recognition of the problem, not verified willingness to pay. Its finding that 84% of 158 surveyed IT and security decision makers regarded closing validation gaps as important to a stronger Zero Trust posture is directionally useful. It is not a customer conversion rate, independent product benchmark, or revenue forecast.
The .pki application is strategically consistent with the security initiative but should carry little near-term financial weight. An application is not a delegated, launched, or commercially adopted domain. Management’s statement that .pki was the only TLD applied for indicates selectivity, but does not establish adoption of a proprietary trust namespace as an industry standard.
REGULATORY AND CONTRACTUAL RISK
The core moat remains substantially contractual. The .com registry agreement extends through November 30, 2030 and permits increases of up to 7% in the final 4 years of each 6-year pricing period. The current period began October 26, 2024. The .net agreement permits increases of up to 10% annually through June 30, 2029. These rights support pricing visibility, but permitted increases should not be modeled as unconditional annual outcomes indefinitely.
The September 30 filing discloses a September 4, 2026 putative class action against VeriSign and ICANN alleging federal and California antitrust and unfair-competition claims concerning the .com agreement and pricing. The complaint seeks injunctive relief and damages. VeriSign states that it intends to defend the matter and cannot reasonably estimate a possible loss range.
The filing does not establish that the allegations have merit or that an adverse outcome is likely. Nevertheless, potential injunctive relief makes the issue relevant beyond a hypothetical damages payment, because the investment case depends heavily on registry economics and pricing rights. The absence of discussion during the call should not be interpreted as elimination of the risk.
The expansion into validation services also creates additional execution and reputational exposure. A security product must be evaluated on its own production performance, contractual commitments, and failure modes. The historical DNS availability record is valuable evidence of operating competence, but it is not a substitute for an established record in a new paid service.
2027 SCENARIOS AND VALUATION IMPLICATIONS
No formal 2027 financial guidance was issued. The following scenarios are illustrative underwriting assumptions rather than company forecasts or verified consensus estimates. They use the 2026 revenue-guidance midpoint as the starting point and incorporate the announced pricing changes without assuming additional unannounced .com increases.
A base case assigned a 55% probability assumes 10% revenue growth to approximately $1.933 billion, a 68.5% operating margin, $65 million of net non-operating expense, a 24% tax rate, and 88 million diluted shares. This produces approximately $10.88 of EPS. The operating premise is that the enlarged domain base and price recognition support stronger revenue growth, renewal cohorts remain broadly stable, .web contributes modestly, and VeriSign Informed does not need to become financially material. An illustrative 26 times earnings valuation produces approximately $283 per share.
A bull case assigned a 25% probability assumes 13% revenue growth to approximately $1.986 billion, a 70.0% operating margin, $62 million of net non-operating expense, a 24% tax rate, and 87 million diluted shares. This produces approximately $11.60 of EPS. It requires sustained acquisition strength, successful renewal conversion, favorable pricing realization, and meaningful commercial progress in the new offerings without a disproportionate expense increase. An illustrative 30 times earnings valuation produces approximately $348 per share.
A bear case assigned a 20% probability assumes 6% revenue growth to approximately $1.863 billion, a 66.0% operating margin, $68 million of net non-operating expense, a 25% tax rate, and 90 million diluted shares. This produces approximately $9.68 of EPS. Announced pricing and the larger opening domain base cushion the result, but weaker acquisition economics, higher deletions, promotional pressure, new-product costs, or reduced repurchases limit earnings progression. An illustrative 21 times earnings valuation produces approximately $203 per share.
These selected valuation multiples are judgments about growth durability and risk, not observed market comparables. The probability-weighted value is approximately $283 before dividends. The sensitivity illustrates the central investment issue: strong business quality does not eliminate substantial multiple risk. A change of 3 earnings-multiple turns at approximately $10.88 of EPS changes value by roughly $33 per share, more than the likely near-term EPS contribution of an initially small product launch.
A price near $245 would represent an approximately 13% discount to the illustrative base-case value and approximately 17% probability-weighted total-return potential including an unchanged annual dividend. A price near $280 would offer much less margin for error under the same assumptions. These are conditional valuation reference points, not assertions about the contemporaneous market price.
The most defensible valuation approach remains to underwrite the core registry cash flow first, assign a measured value to .web only as launch economics become visible, and avoid material base-case earnings credit for VeriSign Informed before pricing and paid adoption are established.
CATALYSTS, MONITORING PRIORITIES, AND PORTFOLIO CONSEQUENCES
The immediate operating catalyst is the November 1 .com increase. Subsequent registration and renewal data will reveal whether limited retail pass-through persists and whether activity accelerates or reverses around the effective date. The next earnings cycle should clarify the 2027 financial framework and the extent to which stronger domain volumes translate into higher recognized revenue and cash generation.
The product calendar is concentrated between late 2026 and H1 2027. .web pricing should be communicated shortly, sunrise is planned for mid-December, the limited registration period should begin in mid-January, and general availability is expected around April. VeriSign Informed pricing is expected by year-end, followed by H1 production availability. The .net increase becomes effective March 1. These milestones provide observable tests rather than a purely long-duration narrative.
The decisive medium-term test is the 2027 renewal performance of the 2026 acquisition cohorts. An aggregate renewal-rate decline remains compatible with a healthy franchise if it is explained by mix. A sustained decline within initial or previously renewed cohorts would be more concerning. Promotional cohorts should be evaluated on retained registrations and realized lifetime economics, not launch-period registration counts alone.
Cash-flow monitoring should distinguish tax timing from structural tax costs, recurring operating expenses from payment timing, and capital spending from development expense. Evidence that cash conversion stabilizes while announced pricing begins to contribute would strengthen the case that current cash weakness is manageable rather than a persistent limitation on capital returns.
For a diversified TMT portfolio, VeriSign offers recurring cash generation and substantially lower direct dependence on AI hardware investment than infrastructure suppliers. It nevertheless retains exposure to valuation duration, internet business formation, registrar behavior, contractual pricing, and concentrated infrastructure risk. The new AI-related narrative should not be assumed to create diversification if it simultaneously increases correlation with richly valued technology franchises. Portfolio-specific correlations cannot be quantified without holdings and factor exposures.
Any incremental position should be sized against the core-business valuation rather than a new-product success assumption. An illustrative initial allocation of 1.0%-1.5% of NAV, with a 12% price-based risk limit, implies approximately 12-18 basis points of portfolio loss before gaps or execution effects. Such a stop is a review and de-risking mechanism, not protection against litigation or operational discontinuities. A larger allocation would require demonstrated cohort durability, improved cash conversion, and clearer product economics.
Thesis-based exit or reduction triggers include sustained deterioration in renewal rates within cohorts, a material adverse change to pricing rights, a serious availability or security incident, capital returns that undermine investment-grade flexibility, or evidence that new-product spending is rising without corresponding adoption. Valuation-based reduction becomes appropriate if the shares capitalize bull-case growth while commercial evidence remains at the beta stage.
The quarter’s central conclusion is favorable but bounded. VeriSign has a stronger core demand trajectory, visible pricing support, and credible infrastructure-adjacent growth opportunities. It has not yet demonstrated that those opportunities warrant a substantially different earnings multiple. Durable upside depends on converting record registrations into recurring renewals and converting technical capability into paid, high-return commercial adoption.
COMPANY EMPLOYEES ON THE CALL
• Jim Bidzos, Executive Chairman, President, and Chief Executive Officer. • John Calys, Executive Vice President and Chief Financial Officer. • David Atchley, Vice President of Finance and Corporate Treasurer, as introduced on the call.
RESEARCH ANALYSTS ON THE CALL
• Rob Oliver, Baird. • Ygal Arounian, Wedbush. • Jamesmichael Sherman-Lewis, Citi. • Alexei Gogolev, JPMorgan.
Key Read-Throughs
KEY READ-THROUGHS FROM VERISIGN’S Q3 2026 EARNINGS CALL
VeriSign’s results provide a positive demand signal for domain distribution and small-business digital presence, but a more mixed signal for the profitability of the companies selling those services. Record registrations indicate that AI-assisted creation is expanding activity on the open web rather than eliminating the need for domains. However, limited retail price increases ahead of the November 1 wholesale increase create potential pressure on registrar margins, while the expanding population of lower-retention initial registrations complicates the conversion of current bookings into durable recurring revenue. The strongest actionable implications concern GoDaddy, IONOS, Wix, and Tucows. The call does not establish a sufficiently direct earnings transmission to justify broader recommendations in cybersecurity, semiconductors, networking equipment, digital advertising, or payments. VeriSign Informed’s unspecified commercial model and rising DNS query volumes are not evidence of incremental revenue for those sectors.
DOMAIN REGISTRARS AND RESELLERS
LIMITED RETAIL PASS-THROUGH CREATES A MARGIN RISK THAT STRONG REGISTRATIONS CAN OBSCURE (READ-THROUGH 1)
Affected companies: GoDaddy (GDDY: United States), Tucows (TCX: Canada), and IONOS Group (IOS: Germany).
Direction and magnitude: Negative input-cost effect, potentially moderate within domain-reselling gross profit but smaller at diversified consolidated businesses. The procurement-cost increase is certain for affected transactions; the ultimate earnings impact depends on retail repricing, contractual pass-through, promotional support, and product mix. This is not evidence that every registrar will suffer a net earnings decline.
The critical commentary was John Calys’s observation that registrar price increases had been “in the neighborhood of 1% or even less.” Jim Bidzos separately identified the upcoming wholesale increase as $0.71 and argued that registrars could absorb it. The important incremental information is not the wholesale increase itself, which had already been announced. It is that retail pricing had not moved materially as the effective date approached.
The transmission mechanism is direct. Registrars purchase .com registration services from VeriSign and sell them to customers or resellers. The November 1 increase from $10.26 to $10.97 raises procurement cost approximately 6.9%. Unless offset by higher selling prices, lower discounts, supplier incentives, or additional attached-product profit, the increase reduces the dollar contribution from each affected registration year.
For every 10 million annual registration-years purchased at the new rate, the gross procurement-cost increase is $7.1 million before offsets. This is a sensitivity, not an estimate of any company’s .com exposure. At an illustrative retail renewal price of $20.52, equivalent to twice the previous wholesale fee, absorbing the increase reduces the pre-other-cost spread from $10.26 to $9.55, approximately 6.9%. Full pass-through would require a retail increase of approximately 3.5%. That is manageable for many operating businesses, but materially different from the approximately 1% or less observed by management.
GoDaddy has substantial direct exposure through domain distribution, although its applications, commerce, and other services diversify consolidated profitability. Tucows is exposed through its wholesale and retail domain operations, but reseller contract terms and its ability to pass through registry changes are essential to assessing the actual impact. IONOS also bears domain procurement costs, including within bundled offerings, although its hosting, software, cloud, and country-code domain exposure dilute the specific .com sensitivity.
The non-consensus implication is that registry and registrar earnings should not automatically receive the same positive interpretation. Strong domain demand benefits both layers, but a wholesale price increase transfers economics toward the registry unless the distribution channel reprices. Higher registrar bookings could coexist with weaker gross-profit conversion.
Near-term trading catalyst: GoDaddy’s October 29 results provide an immediate opportunity for management to address retail pricing, promotional intensity, and Q4 margin assumptions. The November 1 effective date is the operating catalyst. Cost recognition will follow each company’s accounting treatment and registration activity rather than necessarily creating an instantaneous full income-statement impact.
Longer-duration implication: The relevant differentiation is pricing execution and cross-selling capability, not simply domain volume. Registrars able to retain customers while repricing or selling higher-value services should be better positioned than intermediaries competing primarily on domain price. The downside interpretation would weaken materially if company-specific disclosures demonstrate prompt pass-through or sufficient supplier incentives.
RECORD REGISTRATIONS SUPPORT CHANNEL BOOKINGS, BUT NOT AN INDISCRIMINATE REGISTRAR UPGRADE (READ-THROUGH 2)
Affected companies: GoDaddy (GDDY: United States) and IONOS Group (IOS: Germany), with a materially less straightforward read-through for Tucows (TCX: Canada).
Direction and magnitude: Positive, moderate for domain transaction activity and associated acquisition opportunities; small to moderate for consolidated revenue. The evidence is stronger for industry demand than for individual-company market share, customer additions, or EPS upside.
VeriSign processed 13.1 million new registrations, compared with 10.6 million a year earlier, an increase of approximately 23.6%. The domain base reached 182.5 million, up 6.1%, and management raised full-year base-growth guidance to 6.5%-7.0%. Bidzos stated that registrars were “focused on customer acquisition” and successfully engaging with VeriSign’s marketing programs. Calys also said that significant early renewals ahead of the wholesale increase had not been observed.
These disclosures support a genuine transaction-volume tailwind rather than a demand interpretation dominated by pre-price-increase renewal activity. Higher new registrations create additional opportunities for registrars to collect registration fees and sell hosting, email, security, website subscriptions, and other services. The absence of significant observed early-renewal activity reduces, but does not eliminate, the risk that the apparent strength is merely borrowing activity from subsequent periods.
GoDaddy is the most direct large-cap beneficiary because domain discovery and registration are central acquisition channels for its broader small-business offering. The financial benefit can extend beyond the initial registration fee if the customer subsequently adopts applications and commerce services. Its Q2 disclosure reported $783.2 million of Core Platform revenue and $514.8 million of Applications and Commerce revenue, demonstrating that the potential monetization extends across a substantial existing product base.
IONOS benefits from the geographic alignment. VeriSign identified the U.S. and EMEA as its strongest growth regions. This corroborates, rather than contradicts, IONOS’s own H1 customer acquisition improvement: approximately 280,000 additions versus 150,000 in the comparable prior-year period. The relevant transmission is demand for web presence, hosting, domains, and related subscriptions. The commentary does not independently validate IONOS cloud infrastructure demand, and .com/.net trends are not a complete proxy for its country-code domain business.
Tucows illustrates why the sector signal cannot be applied mechanically. Its latest reported domain base was approximately 21.3 million in Q2, versus 24.0 million a year earlier. Domain-services revenue declined approximately 3.9% to $65.0 million, while segment gross profit was approximately stable. Those company-specific results show that industry expansion can coexist with a distributor’s declining domain count and relatively resilient profitability. Registrar routing, customer mix, and revenue per retained domain remain important.
A domain can move between registrars without leaving VeriSign’s registry. Consequently, VeriSign can capture industry growth regardless of which distributor wins the transaction. The call provides no registrar-level market-share attribution and does not establish that GoDaddy, IONOS, or Tucows participated proportionately in the registration acceleration.
Near-term trading catalyst: The results support a favorable backdrop for upcoming registrar bookings commentary, particularly GoDaddy on October 29 and IONOS on November 12. A stronger sector backdrop is not equivalent to a verified consensus earnings beat.
Longer-duration implication: Customer ownership and attached-service conversion determine which distributors capture the greatest economic benefit. The most useful confirmation would be stronger gross profit, net customer additions, and product attachment alongside domain transactions. An increase in transactions alone is a lower-quality confirmation.
LOWER-RETENTION COHORTS LIMIT THE ANNUITY VALUE OF THE REGISTRATION SURGE (READ-THROUGH 3)
Affected companies: GoDaddy (GDDY: United States), Tucows (TCX: Canada), and IONOS Group (IOS: Germany).
Direction and magnitude: Negative for assumptions that capitalize the registration surge as immediately durable recurring revenue. The potential impact is moderate for 2027 domain renewal volumes and acquisition-cohort economics, but the call does not establish deterioration in the companies’ existing customer relationships or platform retention.
Calys stated that first-time renewal rates remained “in the mid-40% range,” while previously renewed names remained “in the mid-80% range.” The aggregate renewal rate was expected to decline to 74.3% from 75.4% a year earlier because initial renewals were becoming a larger share of the population. Management anticipated a further mix-related decline in Q4.
The important distinction is that stronger acquisition is expanding the population with the lowest observed renewal probability. The quarter demonstrated stable cohort quality, not a structural improvement in initial retention. It therefore supports higher current activity without validating an equivalent increase in long-duration recurring value.
Using 45% as an illustrative initial renewal rate, 1 million new annual registrations would produce approximately 450,000 retained registrations at the first renewal event, assuming the aggregate rate applied. The other 550,000 registrations would still generate initial-period revenue, but would not immediately become part of the more durable renewal pool. This calculation is illustrative and cannot be applied directly to any named registrar without its cohort data.
For distributors, the economic issue is the relationship between acquisition spending and retained contribution. Marketing expenditure, introductory discounts, and customer support can be incurred before the first renewal decision. More registrations can create attractive lifetime economics if acquisition costs are sufficiently low and product attachment is strong. However, a registration acquired through promotion is not economically interchangeable with a mature domain renewing at a higher retail price.
There is also a denominator problem. Registrations are not unique customers. An existing customer can register multiple names, experiment with AI-generated projects, or purchase defensive domains without becoming a new paying website-platform customer. GoDaddy’s Q2 disclosure reported approximately 22,000 net customer additions despite the contemporaneously strong domain market. That does not imply poor execution, but it demonstrates why domain transaction growth should not be translated directly into customer growth.
The risk is most relevant to forecasts that assume the enlarged 2026 registration cohorts will renew at mature-base rates or create proportionate cross-selling populations. Conversely, the decline in VeriSign’s blended renewal rate should not be interpreted as proof of weakening customer satisfaction at GoDaddy, Tucows, or IONOS. Registry-level domain renewals and company-level customer retention measure different populations.
Near-term trading catalyst: Initial results may continue to look strong through bookings and registrations. The more consequential test occurs as the enlarged cohorts reach their first renewal dates during 2027. Company disclosures on introductory pricing, customer additions, and acquisition efficiency can reveal the issue earlier.
Longer-duration implication: The strongest business models will convert inexpensive domain acquisition into durable multi-product relationships. The negative conclusion would weaken if actual initial renewal rates improve, customer acquisition costs fall, or attached-service profit increases sufficiently to offset domain attrition. Stable renewal rates alone are not evidence that every increment of gross acquisition has the same lifetime value.
SMALL-BUSINESS SOFTWARE AND WEBSITE CREATION
AI IS EXPANDING DIGITAL-CREATION DEMAND, WITH THE MOST ROBUST BENEFIT ACCRUING TO DISTRIBUTION AND OPERATING PLATFORMS (READ-THROUGH 4)
Affected companies: GoDaddy (GDDY: United States), Wix.com (WIX: Israel), and IONOS Group (IOS: Germany).
Direction and magnitude: Positive, moderate for the addressable volume of digital-presence activity and for the durability of the category. Near-term earnings implications are smaller and more company-specific. The evidence argues against blanket AI-disintermediation assumptions, but does not establish that every incumbent website builder will gain share.
Bidzos stated, “AI clearly makes it easier to find a domain name, develop a website, and maintain a website.” He also observed that content creators want their content found by AI and that a domain is a primary way to make that content available. Management’s analysis of identifiable new websites suggested that they were associated with the better-renewing “online presence cohort.”
The transmission mechanism is a reduction in the time, skill, and cost required to establish an online business presence. A lower creation threshold can expand the population of projects and businesses seeking domains, hosting, paid publishing capabilities, email, commerce tools, and ongoing site management. The financial opportunity therefore extends beyond charging for the initial act of designing a page.
GoDaddy has comparatively broad exposure to this expansion because it can participate at the domain-discovery and registration layer even when the eventual website is built with another tool. Its upside becomes larger if the customer also adopts its operating software. Its Q2 release reported that Airo reached a $50 million annualized bookings run rate, compared with $10 million disclosed a quarter earlier. That is a bookings run rate, not ARR, and VeriSign’s results do not prove that Airo generated the industry increase. They provide external corroboration that AI-enabled creation is coinciding with expanding domain demand.
Wix has more direct exposure to the website and application-creation decision through its core platform and Base44. More completed projects can translate into paid subscriptions and, where businesses become operational, additional transaction and business-solutions revenue. The positive read-through is therefore real at the category level, but platform selection remains crucial: a domain registered for an application built on a competing platform benefits the domain channel without necessarily benefiting Wix.
IONOS has a similar opportunity through its web-presence products and AI App & Site Builder. The EMEA strength reported by VeriSign provides an additional geographic corroboration. It does not justify extrapolating the same growth into every IONOS product or assuming that European demand is uniformly accelerating.
The non-consensus distinction is between the commoditization of website production and the economics of operating a digital business. AI can reduce the price of generating pages while increasing the number of businesses requiring persistent hosting, identity, payments, email, maintenance, and management. Incumbents integrating those functions can benefit even if standalone design work becomes less valuable.
There are important boundaries. Wix’s Q2 disclosure separately identified softness in its Partners business, showing that a larger creation market does not guarantee uniform strength across agencies, resellers, and direct customers. AI inference costs and marketing expenditure also remain material to platform profitability. VeriSign’s high-margin registry economics should not be applied to AI software businesses with different cost structures.
Near-term trading catalyst: The call is supportive evidence ahead of upcoming software-platform results and may challenge categorical assumptions that AI eliminates the need for independent websites. Verification requires paid conversion, subscription growth, and gross-profit performance, not merely AI engagement metrics.
Longer-duration implication: The relative advantage belongs to companies retaining the customer relationship after the site or application is generated. GoDaddy’s participation across domain distribution and operating services makes its exposure less dependent on winning every creation workflow. Wix’s upside is more directly tied to retaining platform preference and monetizing the resulting applications and websites.
NEW DOMAIN DISTRIBUTION AND REGISTRY COMPETITION
.WEB CREATES AN INSTALLED-BASE CROSS-SELL OPPORTUNITY, BUT CONTRIBUTION IS BACK-END-LOADED AND NOT ENTIRELY INCREMENTAL (READ-THROUGH 5)
Affected companies: GoDaddy (GDDY: United States), Tucows (TCX: Canada), and IONOS Group (IOS: Germany).
Direction and magnitude: Positive but initially small for participating domain distributors. Potentially more meaningful within domain-focused operations than at diversified groups, but insufficiently quantified to justify a large consolidated earnings revision. GoDaddy also has an offsetting competitive exposure through its registry operations.
The key disclosure was that, during the limited registration period, “most registrants of a .com domain name will have an opportunity to register an exact match .web domain name.” Management also stated that .web permits premium pricing and provides greater marketing flexibility than .com and .net.
The transmission mechanism is an additional product offered to an existing customer population. A registrar already managing a customer’s .com domain has a natural opportunity to market the corresponding .web name for brand protection, a companion website, or a separate project. This can generate an additional registration spread without requiring the acquisition of an entirely new customer.
Tucows can distribute the opportunity through its reseller network, while GoDaddy and IONOS have direct customer relationships through which to market additional domains. The call did not identify named launch agreements or allocate expected volume to particular registrars. These are established distribution exposures, not confirmed company-specific contract awards.
The economic attraction is more likely to be incremental contribution per existing customer than a surge in new customer counts. As an illustrative sensitivity, 1 million incremental annual registrations at a retained distributor spread of $5 would produce $5 million of annual gross contribution before support, marketing, and other costs. Neither the spread nor the volume has been disclosed. The example shows why a successful launch could be useful without necessarily transforming consolidated earnings at a large distributor.
The timing limits the near-term impact. Sunrise is planned for mid-December, followed by a limited registration period beginning in mid-January and potentially extending into early April 2027. General availability would follow. Broad 2026 revenue contribution should therefore not be expected. Initial billings or registration activity may also precede full recognized revenue.
Not every .web registration will represent a genuinely incremental economic relationship. Defensive registrations may produce registration revenue without hosting, commerce, or software attachment. Some spending could substitute for purchases of other extensions. Renewal behavior after the initial launch period will determine whether the product becomes a durable recurring contribution or primarily a launch-cycle opportunity.
GoDaddy’s exposure is additionally mixed because it operates registry infrastructure for extensions including .biz, .club, and .design. A well-marketed .web launch creates another competitor for alternative-domain demand, potentially pressuring volume or promotional economics in existing extensions. The distributor opportunity is more direct, while the registry offset prevents a uniformly positive interpretation across all of GoDaddy’s domain activities.
Near-term trading catalyst: Final pricing, premium-name terms, registrar participation, and marketing arrangements are the relevant late-2026 information events. These disclosures can change expected channel economics before significant revenue is recognized.
Longer-duration implication: General availability around April 2027 begins the commercial test, while subsequent renewal cycles establish durability. The highest-quality outcome for distributors is additional retained domain ownership with low incremental acquisition cost. The lower-quality outcome is a promotion-heavy launch that reallocates spending across extensions without expanding customer lifetime profit.
Report record
- Sector
- Information Technology
- Fiscal period end
- September 30, 2026
- Report date
- October 22, 2026
- Analysis
- 6288 words
- Read-throughs
- 2907 words
- Content fingerprint (PDF)
ad24130afc7c- Content fingerprint (analysis)
f6219b23f91f- Content fingerprint (read-throughs)
0ea79ee83593
Prepared from the company's earnings release and earnings call transcript. Figures as reported by the company. For information only. Not investment advice.
More from VeriSign, Inc.
No other reports yet.
More in Information Technology
Operating Thesis Strengthened; Cash Conversion Remains Unproven
Optical and IP Growth Validated; Cash Conversion Moved the Other Way
All Information Technology reports
Follow @AtlasPeakRes on X for new earnings reports as they publish.